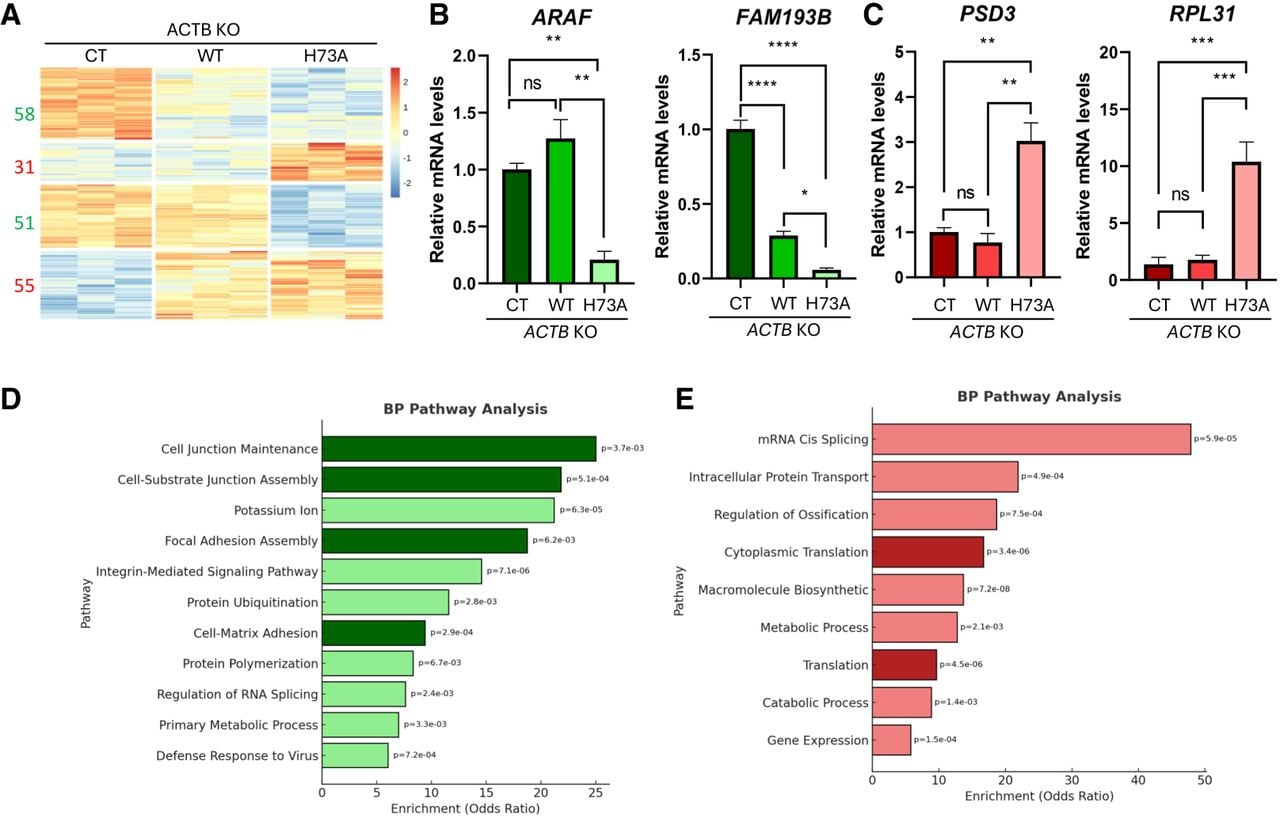
Methylated ACTB at H73 regulates gene transcription. (A) Heat map showing up- and downregulated genes from RNA sequencing analysis of control and HCT116 ACTB KO cells expressing empty vector (CT), ACTB WT (ACTB WT), or ACTB H73A mutant (ACTB Mut). The numbers on the left indicate the number of genes which are down- (green) and up- (red) regulated under KO/perturbation conditions. Three biological replicas were tested for each condition. (B,C) RT-qPCR analysis of representative downregulated genes (B) and upregulated genes (C) identified in the RNA-seq data set shown in panel A. Data are presented as mean ± SEM from three independent experiments, normalized to GAPDH expression. Statistical analysis was performed using one-way ANOVA on two biological repeats. (*) P < 0.05, (**) P < 0.01, (***) P < 0.001, (****) P < 0.0001. (D,E) Selected pathways from Gene Ontology (GO) analysis of the differentially expressed downregulated (D) and upregulated (E) genes. Bars represent enrichment odds ratios, and P-values are indicated for each pathway.