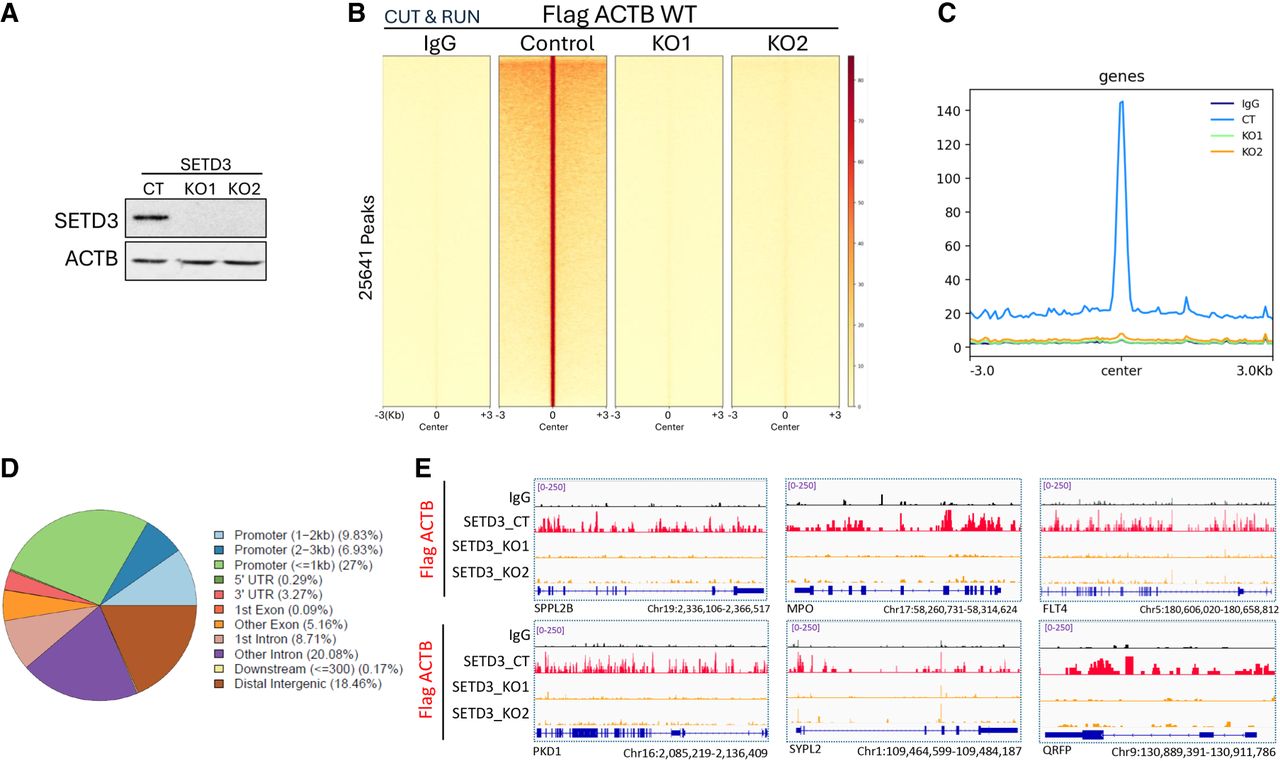
SETD3-dependent ACTB genomic distribution. (A) Protein expression levels of SETD3 and ACTB (loading control) were measured in HCT116 cells by western blot (WB). (B) Heat maps showing CUT&RUN read densities for IgG (NC) and Flag-ACTB in SETD3 control and HCT116 KO cells expressing Flag-ACTB. (C) Read density profiles ±3 kb around the center in the genome for Flag ACTB WT. Plots are shown for IgG, Control, and two SETD3 KOs (KO1 and KO2) HCT116 cells. (D) Genome-wide distribution of Flag-ACTB peaks across annotated genomic features. Peaks were assigned to promoters (≤1 kb, 1–2 kb, and 2–3 kb from TSS), UTRs, exons, introns, downstream regions, and distal intergenic sites. (E) Representative IGV snapshots showing binding profiles of six genomic regions. Black tracks represent IgG control, whereas red and orange tracks represent Flag-ACTB in SETD3 control cells and SETD3 KO1/KO2 cells, respectively.