

Abstract
Host shifts in insects are considered a key process with the potential to contribute to reproductive isolation and speciation. Both genomic and transcriptomic variation are attributed to such a process, in which gene families with functions associated with host localization, acceptance, and usage are proposed to evolve. In this context, cactophilic Drosophila species serve as an excellent model to study host shift evolution, because they use a wide range of cacti as hosts, and many species display different preferences. Transposable elements are a source of genetic novelty between populations and species, driving rapid adaptive evolution. However, the extent of TEs’ contribution to host shift remains unexplored. Here, we perform genomic and transcriptomic analyses in six genomes of cactophilic species/subspecies to investigate how TEs interact with genes associated with host shift. Our results reveal enrichment of TEs at promoter regions of host shift–related genes, with ∼39% of the odorant receptors containing their transcription factor binding sites within TEs. We observe that ∼50% of these TEs are Helitrons, demonstrating an unprecedented putative cis-regulatory role of Helitrons in Drosophila. Differential expression analysis between species with different preferred hosts reveals divergence in gene expression in heads and larvae. Although TEs’ presence does not affect overall gene expression, we observe 6.27% of the expressed genes generating gene–TE chimeric transcripts, including those with function affecting host preference. Our combined genomic and transcriptomic approaches provide evidence of TE-driven divergence between species, highlighting the evolutionary role of TEs in the context of host shift, a key adaptive process that can cause reproductive isolation.
The molecular consequences of host shift evolution can ultimately cause specialization and ecological speciation (Whiteman and Pierce 2008). In many species, reproductive isolation arises as a result of successive adaptations driven by host shift, which results from divergent selection between different environments (Howard and Berlocher 1998; Rundle and Nosil 2005; Whiteman and Pierce 2008; Forbes et al. 2017). Thus, natural selection increases the frequency of alleles that confer higher fitness benefits when a host shift occurs. Drosophila species use a wide range of necrotic host tissues as feeding and breeding sites, providing a suitable model to study the host shift process and its role in insect speciation. Among them, the repleta group comprises a clade with about 100 cactophilic Drosophila species (O'Grady and Markow 2012). The specialization in cacti represents an important ecological challenge to the flies, mainly owing to the presence of toxic compounds (Oliveira et al. 2012). In the repleta species, the host shift was initially to the Opuntia sp. cacti, and secondarily, several independent shifts happened to columnar cacti (Oliveira et al. 2012), considered a host with higher toxicity than Opuntia sp. (Stintzing and Carle 2005). Such host shift is observed between sibling species with recent divergence in two clusters of the subgroup mulleri: cluster buzzatii and cluster mojavensis. In the cluster buzzatii, Drosophila buzzatii and Drosophila koepferae are sibling species (divergence 4–5 Mya) (Gomez 2003) with different primary hosts. The former species preferentially use Opuntia sp. cacti, whereas the latter is a columnar cacti dweller (Hasson et al. 1992). In the cluster mojavensis, Drosophila arizonae and the four allopatric subspecies of Drosophila mojavensis have different cacti preferences. D. arizonae uses both Opuntia sp. and columnar cacti, whereas D. m. mojavensis uses the columnar cacti Ferocactus cylindraceus as preferential host; D. m. wrigleyi uses only Opuntia sp., D. m. baja uses the columnar cacti Stenocereus gummosus, and D. m. sonorensis is also a columnar cacti dweller, using Stenocereus thurberi (Newby and Etges 1998). Therefore, this set of species from the buzzatii and mojavensis clusters provides an excellent model to investigate the molecular mechanisms underlying host shift evolution.
The radiation of cactophilic Drosophila species across different hosts is an evolutionary outcome that gave rise to specific adaptations (Rane et al. 2019). They can be summarized into three steps: localization, acceptance, and host usage (Markow 2019). In the localization step, odorant-binding proteins (OBPs) and odorant receptors (ORs) are key proteins to distinguish specific hosts in the environment through the integration of the visual and olfactory systems. Subsequently, in the acceptance step, the insect evaluates the nutritional compounds present on the host, as well as the presence of competitors, predators, pathogens and parasites (Markow 2019). Several receptors are associated with this process, such as gustatory receptors (GRs) (Montell 2009) and ionotropic receptors (IRs) (Chen and Amrein 2017; Gomez-Diaz et al. 2018; Ni 2021). Finally, the use of metabolites derived from the host is essential for feeding and completing the breeding process. Although not always associated with detoxification (Lang et al. 2012), cactophilic flies must overcome the presence of toxic substances from cacti. Several gene families are associated with detoxification, such as cytochrome P450s (CYPs), glutathione S-transferases (GSTs), UDP-glycosyltransferases (UGTs), esterases (ESTs), and ATP binding-cassette transporters (ABCs). Altogether, these nine gene families associated with the host localization, acceptance, and usage will henceforth be referred to as HLAU.
Transposable elements (TEs) may play a role in environmental adaptation because of their ability to generate mutations. In most cases, mutations caused by TEs are likely to be deleterious or neutral. Throughout evolutionary time, TEs that remain in the genome tend to be silenced by epigenetic control and/or small RNA pathways (Aravin et al. 2007), accumulating mutations and losing their transposition ability (Fedoroff 2012). Despite the majority of TEs becoming silenced, the remaining TE sequences may still contain regulatory motifs or protein domains (Capy 2021). These sequences can be co-opted by the cell machinery, modifying gene expression or protein sequences of the nearby genes (for review, see Drongitis et al. 2019). The impact of co-option on individual fitness determines whether TE copies increase in frequency within populations, thereby contributing to evolutionary change and hence being fixed as adaptive insertions. For instance, the SETMAR gene has a transposase domain derived from an Hsmar1 insertion conserved in primates, providing functional DNA-binding to target methylation (Cordaux et al. 2006). Such exaptation and domestication events can often be identified by the occurrence of chimeric transcripts, which are mRNAs with both gene- and TE-derived sequences (Lipatov et al. 2005). A recent transcriptome-wide study identified 327 genes in Drosophila melanogaster that generate chimeric transcripts across different populations (Oliveira et al. 2023). Among all genes, 76 generate chimeric transcripts from TE insertions that were present in one strain but absent in another, highlighting the potential of TEs as a source of genetic novelty between different Drosophila ecotypes.
Many aspects involving host shift adaptation in repleta species have been shown previously, such as detoxification pathways (Matzkin 2008), morphology (Pfeiler et al. 2009), life history traits (Etges 1993), behavior (Crowley-Gall et al. 2016), and genomic and transcriptomic differences (Matzkin and Markow 2013; Rajpurohit et al. 2013; Benowitz et al. 2020, 2024; De Panis et al. 2022). However, the contribution of TEs to the evolution of HLAU genes has not yet been assessed. Here, we aimed to uncover the extension of the genetic variability derived from TEs in cactophilic Drosophila species, using both genome- and transcriptome-wide analysis. We tested the hypothesis whether TEs have contributed to the evolution of HLAU genes and, consequently, to the host shift in cactophilic species.
Results
Genome assemblies and gene annotation
To investigate the potential role of TEs in host shift of cactophilic Drosophila species, we performed Oxford Nanopore Technologies (ONT) long-read sequencing on species that have different preferential cacti as hosts: D. buzzatii (Opuntia sp.), D. koepferae (columnar cacti), D. arizonae (Opuntia sp. or columnar cacti), D. m. mojavensis (F. cylindraceus), D. m. wrigleyi (Opuntia sp.), and D. m. sonorensis (S. thurberi). We obtained high-resolution assemblies for all genomes, with an average of 567 scaffolds, 13.8 Mb of N50 (Supplemental Table S1), and ∼98% of benchmarking universal single-copy orthologs (BUSCO) genes (Supplemental Fig. S1). Furthermore, the gene annotation for these genomes covered 98.63% of all reference genes in the D. mojavensis subspecies and 95.98% in D. arizonae. The de novo gene annotation in D. buzzatii and D. koepferae revealed a total of 18,050 and 17,848 coding genes, for which 63.77% and 64.13% were successfully assigned as one-to-one orthologs with D. mojavensis, respectively. These results represent the higher gene repertoire identified for the D. buzzatii and D. koepferae species, altogether with their ortholog relationship with D. mojavensis and D. arizonae. Because the analysis of HLAU genes is the focus of this study, their efficient annotation is relevant. They are represented by nine gene families associated with the three steps in the use of host resources: (1) localization—OBPs and ORs, (2) acceptance—GRs and IRs, and (3) host usage—ABCs, ESTs, GSTs, UDPs, and CYPs (Supplemental Table S2). In the D. arizonae and D. mojavensis subspecies, we recovered ∼98.21% of the total HLAU genes from the D. mojavensis reference genome. In D. buzzatii and D. koepferae, the number of annotated HLAU genes covered ∼95% in both species compared with D. mojavensis (Table 1).
Total number of genes annotated in the six cactophilic Drosophila species sequenced in this work
| Species/subspecies | Total genes | Host localization, acceptance, and usage genes | ||||||||
|---|---|---|---|---|---|---|---|---|---|---|
| Localization | Acceptance | Host usage | ||||||||
| OBP | OR | GR | IR | ABC | EST | GST | UDP | CYP | ||
| Ref. D. m. wrigleyi | 15,045 | 25 | 59 | 45 | 22 | 27 | 17 | 28 | 21 | 59 |
| D. m. mojavensis | 14,810 | 25 | 59 | 44 | 22 | 27 | 17 | 27 | 20 | 59 |
| D. m. wrigleyi | 14,948 | 25 | 59 | 45 | 22 | 27 | 17 | 27 | 20 | 59 |
| D. m. sonorensis | 14,808 | 25 | 57 | 44 | 22 | 27 | 17 | 27 | 20 | 58 |
| D. arizonae | 14,441 | 25 | 56 | 41 | 21 | 27 | 17 | 27 | 20 | 59 |
| D. buzzatii | 18,050 | 25 | 52 | 34 | 21 | 27 | 16 | 27 | 20 | 68 |
| D. koepferae | 17,848 | 25 | 45 | 34 | 24 | 27 | 13 | 25 | 23 | 62 |
[i] The “Ref. D. m. wrigleyi” represents the annotation in the reference genome used to perform the gene annotation for our long-read ONT genomes. HLAU genes are separated according to their functions: localization—odorant-binding proteins (OBP) and odorant receptor (OR), acceptance—gustatory receptor (GR) and ionotropic receptor (IR), and host usage—ATP-binding cassette (ABC), carboxylesterase (EST), glutathione S-Transferase (GST), glycosyltransferase (UDP), and cytochrome P450 (CYP).
Minor effects of positive selection in HLAU genes
The use of Opuntia sp. has been proposed as the ancestral state in cactophilic Drosophila species, whereas columnar cacti are the derived state (Oliveira et al. 2012). To investigate whether species that prefer columnar cacti as hosts exhibit signs of positive selection in HLAU genes, we employed a branch-site approach to compare their evolutionary rates with those of species that use Opuntia sp. We also performed selection analysis with branch and site approaches separately. These analyses were assessed without D. arizonae due to its nonpreferential usage between columnar and Opuntia sp. cacti (Oliveira et al. 2012). Moreover, we added Drosophila navojoa (publicly available from the NCBI Genomes database (https://www.ncbi.nlm.nih.gov/home/genomes/) under accession number GCF_001654015.2), which is a basal species of the mojavensis cluster that uses solely Opuntia sp. (Oliveira et al. 2012). Thus, we carried out the branch-site selection test with D. buzzatii, D. m. wrigleyi, and D. navojoa as Opuntia-related branches (background), and D. m. mojavensis, D. sonorensis, and D. koepferae as columnar-related branches (foreground). It is important to highlight that because of the requirement for one-to-one orthologous genes between the six genomes, our analysis reduced the total number of HLAU genes to 42.9% of the initial number presented in Table 1.
The site model revealed two genes with sites under positive selection: Atet (LOC26527843, FDR = 0.0215) with seven sites with ω > 3 and Cyp4ae1 (LOC6585222, FDR = 0.0394) with two sites with ω > 4 (Supplemental Table S3). This result suggests that both genes have sites under diversifying selection across the six cactophilic species. Still, it does not test the hypothesis of positive selection between species with preference columnar cacti versus Opuntia sp. Thus, we applied the branch model with columnar cacti dwellers labeled as foreground. This approach allows us to test the evolutionary rate between species with different host preferences. The analysis revealed that 96.7% of the genes exhibit different selective regimes on the foreground branch compared with the background (FDR < 0.05). Although the test supports a significant shift in ω, no cases of positive selection (ω > 1 in the foreground) were reported (Supplemental Table S3). The average ω in the foreground branch (columnar cacti dwellers) is 0.13, whereas in the background it is 0.11. Some dramatic changes have been observed, as in the Or92a (LOC6585146) for instance. This gene has ω = 0.0001 in the foreground and ω = 0.02694 in the background (FDR = 2.15 × 10⁻⁷) (Supplemental Table S3), suggesting it has evolved under strong purifying selection. Altogether, these results indicate that HLAU genes are under purifying selection in columnar cacti dwellers. Given that the branch model does not differentiate among codons, these results reflect a global change in selective pressure across the entire gene in the foreground. Then, we also investigated whether specific sites could be under positive selection with the branch-site model, but we did not observe any significant difference (FDR < 0.05) between the foreground and background branches (Supplemental Table S3). This result is consistent with the branch model, in which we did not obtain any signature of positive selection.
Evolutionary dynamics of TEs in cactophilic Drosophila species
We used a combination of automatic and manual methods to build a curated TE library for each species based on the classification of TEs (Wicker et al. 2007). The method was designed to perform polishing steps in both TE consensus and copies to remove artifacts (see Methods). The total number of TE consensuses (LTRs separated from internal sequences) ranged from 255 in D. buzzatii to 372 in D. m. mojavensis (available in Zenodo repository: https://zenodo.org/records/16501018). The TE content in the genomes ranged from 15.04% in D. buzzatii to 22.01% in D. m. mojavensis (Fig. 1A). In addition, we observed a positive correlation between TE content and genome size estimated from the assemblies (Pearson's correlation: P = 0.0082; R = 0.93) (Supplemental Fig. S2). Both species from the buzzatii cluster had the lower genome sizes and TE contents compared with species of the mojavensis cluster (Fig. 1A). Regarding the proportional load of TE orders in the genomes, LTRs and Helitrons contribute on average with ∼70% of total TE content in all species (Fig. 1B).
TE annotation in the six genomes of the cactophilic Drosophila species. (A) Genome size of the six cactophilic Drosophila species sequenced in this work, and their respective TE content (blue). (B) Proportional distribution of the total TE content in the genomes. (C) Phylogenetic relationship among species (adapted from Matzkin 2008; Oliveira et al. 2012), alongside TE order landscapes representing total copy number (y-axis) and the divergence of TE insertions compared with the consensuses (x-axis), based on the Kimura two-parameter (K2P) model corrected with CpG. The copies located on the left of the graph have low divergence with their respective consensus, hence inferring that they might be conserved/recent/active, whereas copies on the right side represent copies with high divergence owing to the accumulation of mutations, corresponding to old/inactive copies.
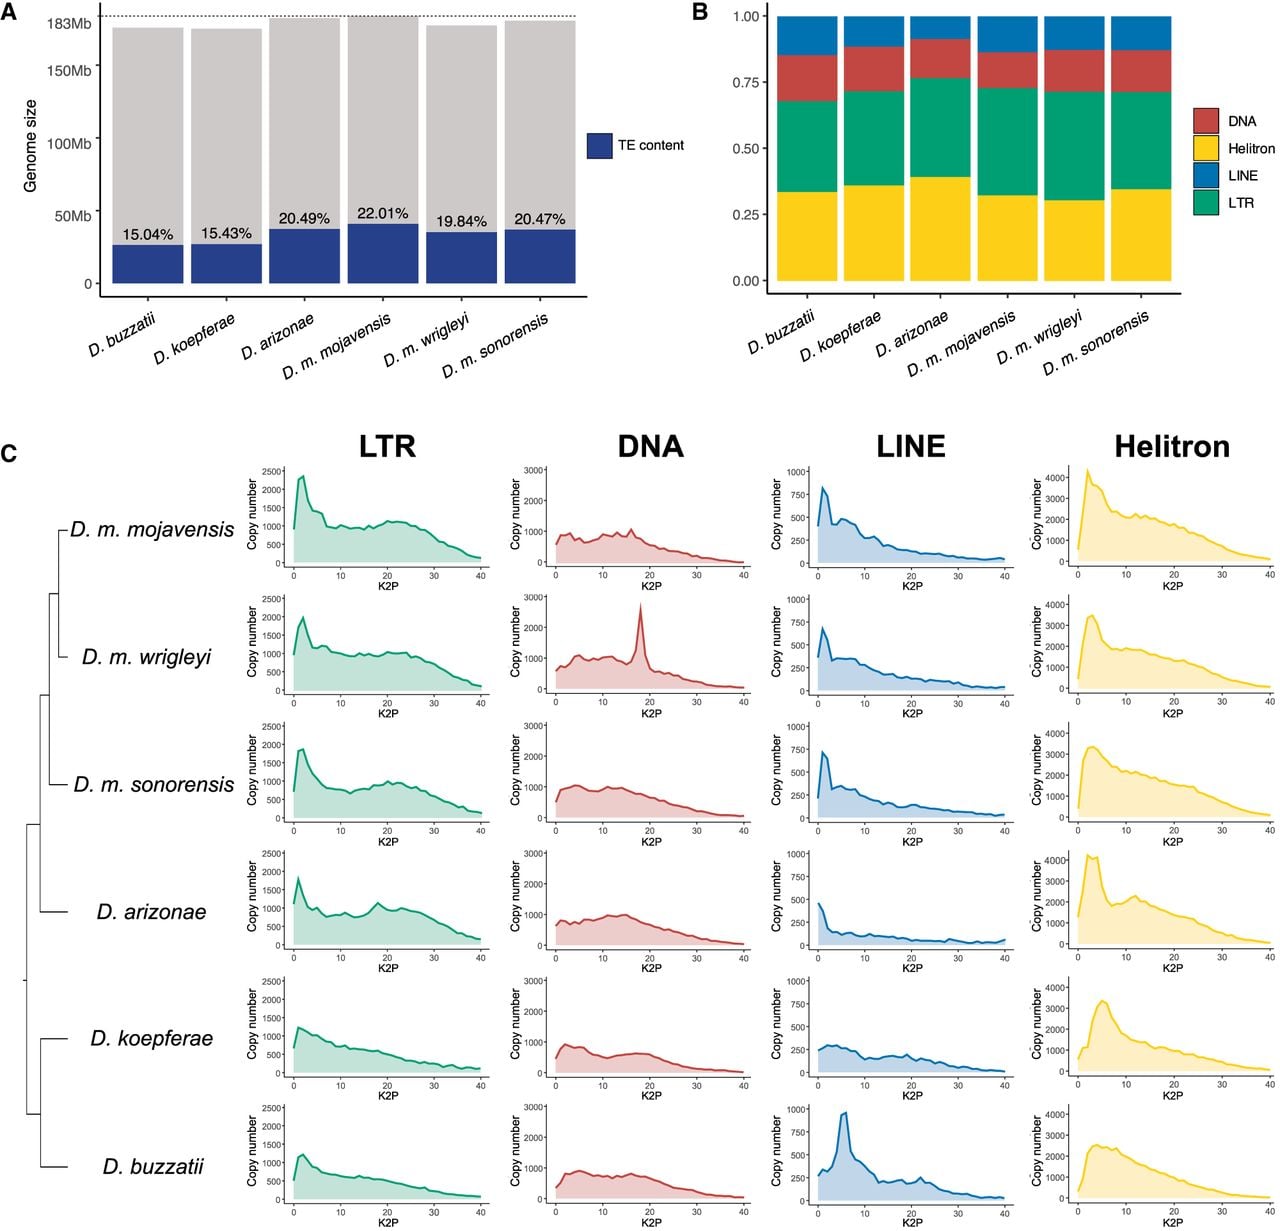
In the mojavensis cluster (D. arizonae and the three D. mojavensis subspecies), the abundance of TEs in the genome varied substantially (Fig. 1B), despite their recent divergence time of 1.5 Mya (Sanchez-Flores et al. 2016). D. m. mojavensis has the TE-richest genome (22.01%), with the abundance following from the highest to the lowest: LTR > Helitron > LINE > DNA (Fig. 1B). The distribution of TEs in the other two D. mojavensis subspecies and D. buzzatii does not follow such order. LTRs and Helitrons have the highest abundance, followed by DNA and LINEs (Fig. 1B). In D. arizonae and D. koepferae, Helitrons are the most abundant, followed by LTR, DNA, and LINEs (Fig. 1B). The observed differences are often associated with the divergence in the evolutionary patterns of the TE orders between the genomes. We used copy number as a proxy to measure TE expansion in the genomes, and divergence Kimura two-parameter as age measurement. In the mojavensis cluster, we observed that LTRs and Helitrons had a higher expansion in D. m. mojavensis compared with the other genomes (Fig. 1C). The higher copy number in D. m. mojavensis is mostly from young TEs (K2P = 0–5), which might explain the higher TE content in this species. DNA elements have a constant evolutionary dynamics in the genomes, except in D. m. wrigleyi. In this species, we observed a peak in copy number with K2P between 15 and 20, considered old insertions. We analyzed whether these insertions were distributed across the genome or had local accumulation. The result revealed an even distribution across the longest scaffolds of the genome (Supplemental Fig. S3), following similar patterns of both younger and older insertions. LINEs had a similar evolutionary landscape in D. mojavensis subspecies, with a higher copy number from young copies compared with D. arizonae. In the buzzatii cluster, Helitrons show higher copy number from young insertions in D. koepferae than in D. buzzatii (Fig. 1C), whereas LINEs show a past transposition burst in D. buzzatii than in D. koepferae. The antagonistic patterns of TE dynamics observed in the six genomes suggest that TEs had different successful lineages across these species.
HLAU genes are enriched in TEs within regulatory regions
TE insertions may be selected in the promoter of genes if they provide a benefit to the individual fitness, through the spreading of histone marks, or cis-regulatory elements (Daborn et al. 2002; Guio et al. 2018). To investigate whether TEs are enriched in the promoters (2 kb upstream of the transcription start site [TSS]) from the nine HLAU families, we performed permutation tests in the six genomes (see Methods). To compare our findings with other non-host shift–related genes, we also included zinc-finger (ZF) and serine/threonine kinases (SER) as two non-HLAU gene families. We observed that ORs have enrichment of TEs at the promoters in all genomes from species of the mojavensis cluster (P-value < 0.05) (Fig. 2A). For acceptance genes, D. koepferae had enrichment of TEs in the promoters of GRs (Fig. 2A). Finally, the enrichment of TEs within promoters of detoxification genes was observed in D. arizonae (CYPs), D. buzzatii (GSTs), and D. koepferae (ABCs). The results depicting the histograms with frequency of genes with TEs for each significant permutation test, and P-values are shown in the Supplemental Figure S4 and Supplemental Table S4. Overall, detoxification genes had z-scores toward depletion of TEs on promoters, with significant depletion for UGTs in D. buzzatii (P-value = 0.033) and D. arizonae (P-value = 0.0135) and for GSTs in D. koepferae (P-value = 0.0205) (Fig. 2A). In the non-HLAU gene families, we observed the expected result by chance: either the z-score indicated the expected number of genes with TEs on promoters in a genome-wide comparison (z-score near zero), or it indicated depletion of TEs, as observed for SER genes in D. buzzatii. This result reinforces our findings, indicating the significant and evolutionary unexpected enrichment of TEs in HLAU genes, especially on the promoters of ORs.
Enrichment of TEs in HLAU genes. (A) Enrichment of TEs in the promoter region (2 kb upstream) of the HLAU gene families. Z-score > 0 indicates enrichment, and Z-score < 0 indicates depletion. Red dots indicate P-value < 0.05; gray dots, P-value > 0.05. (B) The same enrichment analysis as depicted in A, but for non-HLAU gene families, represented by zinc-finger proteins (ZF) and serine/threonine kinases (SER). (C) Proportion of TE orders located upstream and downstream ORs. (D) Transcription factor binding site (TFBS) frequency on TEs located upstream of OR genes in all species under study. (E) Proportional frequency of TE families with TFBSs embedded in their sequences from TE copies located upstream of OR genes. (F) Significant Fisher's exact test between OR genes with OR-related TFBSs from TE insertions compared with the frequency observed in the non-HLAU gene families SER and ZF. (G) Proportion of TE orders carrying OR-related TFBSs in non-HLAU gene families.
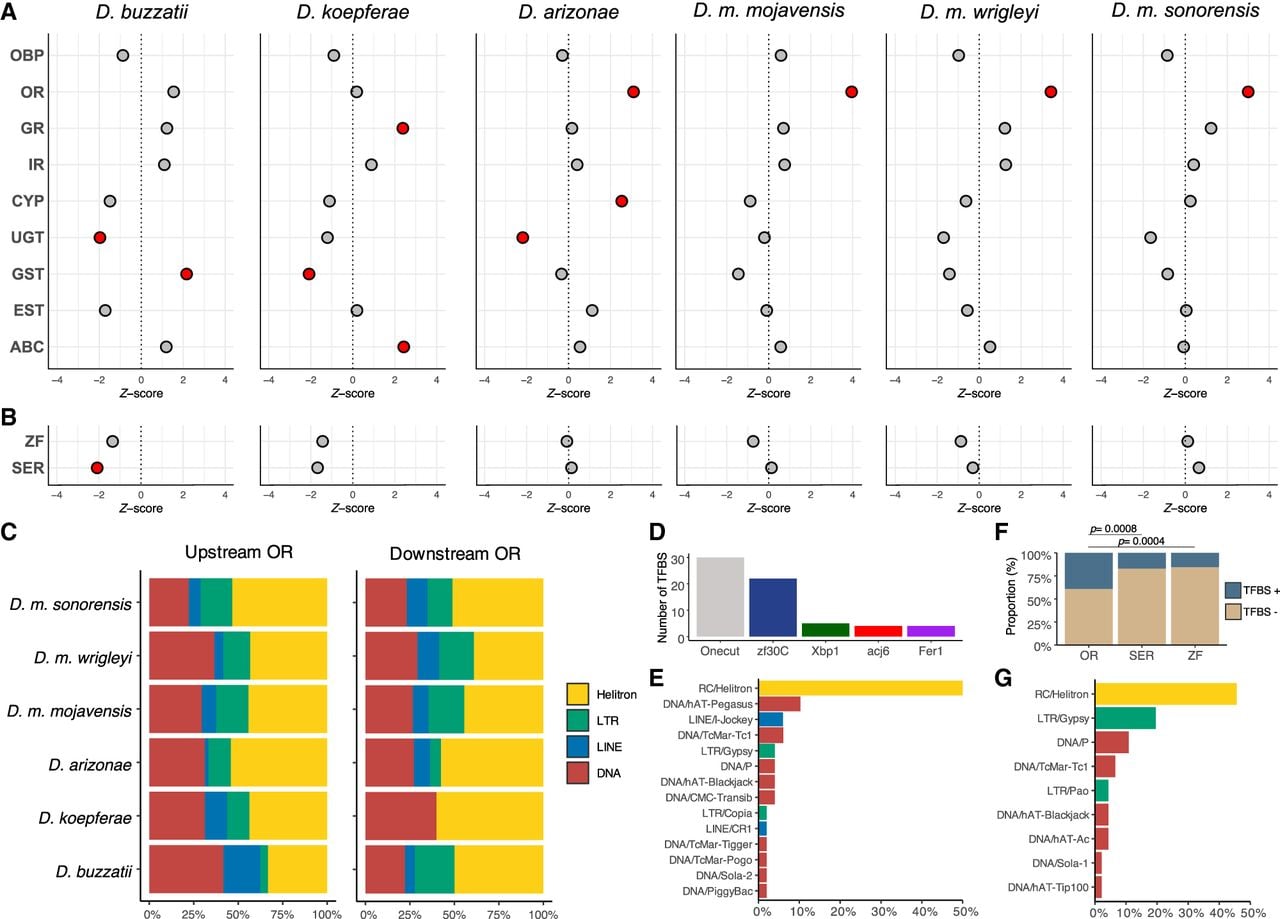
To obtain further insights into the potential regulatory role of TEs, we also analyzed the enrichment at the 2 kb downstream region. Among all species, the only significant enrichments were observed in ORs from species of the mojavensis cluster (Supplemental Table S4), as we observed in the promoters. The TE enrichment upstream of and downstream from ORs indicates a possible coevolution of this gene family with TEs. Alternatively, it may also suggest that ORs are located in TE-rich regions of the genomes. To investigate this hypothesis, we identified TE-rich regions (Supplemental Fig. S5) and analyzed the frequency of ORs. We observed a single OR in TE-rich regions in D. arizonae, D. m. mojavensis, and D. m. wrigleyi. (Supplemental Table S5). Therefore, we rejected the hypothesis that ORs are enriched with TEs in their vicinity owing to their location in TE-rich regions. Other factors might be involved in the evolutionary maintenance of TEs near ORs, such as the co-option of regulatory motifs.
A few TE families are more prone to contribute to cis-elements than others, such as retroelements in D. melanogaster (Chang et al. 2022). Therefore, we investigated whether the observed enrichment of TEs in the HLAU gene families is TE specific. Considering all species, 45.36% and 50.36% of the insertions located upstream of and downstream from, respectively, ORs correspond to Helitrons (Fig. 2C). The frequency of Helitrons upstream ORs is significantly higher than expected given their genomic distribution in species of the mojavensis cluster (Supplemental Table S6). We decided to analyze whether these Helitron insertions upstream of OR genes could contain gene fragments. Helitrons carrying host gene exons have been reported previously in other species than Drosophila, resulting in a high copy number of insertions overlapping with genes (Pritham and Feschotte 2007; Thomas et al. 2014). By intersecting exons from genes enriched with their respective upstream Helitrons, we observed that Or85c (overlap, 772 nt) and Or22c (52 nt) had overlap with Helitrons in D. m. mojavensis, whereas D. m. sonorensis had only Or22c (58 nt). Although the insertion in Or85c suggests a subspecies-specific insertion, the insertion in Or22c is likely to be inherited from the species’ common ancestor (Supplemental Table S7). At the ORs’ downstream region, we observed four genes with Helitrons overlapping exons: Or71a, Or10a, Or13a, and Or82a. The same Helitron in the Or82a was observed in the three D. mojavensis subspecies, highlighting the inheritance from the common ancestor and maintenance of the insertion over time. Taken together, our results rejected the hypothesis of spread Helitron copies with OR fragments, which could explain the high frequency of these elements upstream of and downstream from ORs. However, these elements could still act on gene regulation if they carry cis-elements as transcription factor binding site (TFBS).
TEs located near genes can modulate gene expression by donating TFBSs or poly(A) signals to the ancestral regulatory motifs. To investigate the potential functional role of the observed enrichment of TEs in ORs, we performed TFBS identification on all TE insertions located in OR promoters. We used the transcription factors (TFs) previously described to participate in OR's transcription in D. melanogaster: acj6, onecut, xbp1, fer1, and zf30C (Jafari et al. 2012). Taking all species together, the most frequent TFBS found was for the TF onecut (46.15%), followed by zf30C (33.84%) and Xbp1 (7.69%) (Fig. 2D). Helitrons were the TEs with the highest frequency, representing 50% of all insertions carrying ORs’ TFBSs (Fig. 2E). Our analysis revealed that 39.28% of the ORs with TEs in promoters have the TFBS located within insertions (Supplemental Table S8). To test whether these results are specific to ORs, we also performed the same detection of TFBSs and calculation of TE frequency in the non-HLAU families ZF and SER. Our results show that ZF and SER have, on average, 15.55% and 17.14% of the genes with OR-related TFBSs, respectively. The detection of these TFBSs in ZF and SER is likely owing to chance, given the short length of the motifs. Comparing these proportions with the ones found in ORs, we observed significantly more TFBSs compared with ZF (Fisher's exact test: P-value = 0.0004341) and SER (Fisher's exact test: P-value = 0.0008519) (Fig. 2F; Supplemental Table S9). In addition, Helitrons also had higher prevalence than other TEs upstream of SER and ZF genes (Fig. 2G), demonstrating a potential insertion preference for promoter regions. Although similar Helitron frequencies between OR, SER, and ZF genes, our data suggest that Helitrons might have been retained in OR promoters owing to the presence of functional TFBSs (Fig. 2F).
HLAU genes are differentially expressed between Opuntia sp. and columnar cacti dwellers
Differential expression of genes has been associated with adaptation to new hosts in insects (Matzkin and Markow 2013). Here, aiming to test whether gene expression divergence is associated with adaptation to different cactus hosts, we performed differential expression analysis between species with Opuntia sp. preference versus columnar cacti preference, in adult heads and larvae. Because our fly stocks were reared in the laboratory with corn media, the observed transcriptome response is constitutive rather than triggered by the native cacti. Overall, the principal component analysis from HLAU gene expression (normalized read counts) revealed remarkable differences between species in both head and larval tissues (Fig. 3A). The variance of gene expression resembles the phylogenetic divergence of the species, with the highest variance between the buzzatii and mojavensis clusters (PC1) followed by divergence between D. buzzatii and D. koepferae (PC2). The species of the mojavensis cluster were clustered together with a slight separation between D. arizonae and the subspecies of D. mojavensis.
Differential expression analysis of HLAU genes. (A) Principal component analysis of HLAU genes’ expression in head and larval tissues. Both tissues had HLAU genes’ variance representing the phylogenetic distance between species: D. buzzatii and D. koepferae, compared with the mojavensis cluster corresponds to the PC1 (45%), and 26% between them in PC2. Species from the mojavensis cluster had strong similarity, with D. arizonae slightly separated from D. mojavensis. (B) HLAU genes’ expression in the Opuntia sp. dweller D. m. wrigleyi versus its sister species D. arizonae, which does not have preference between Opuntia sp. and columnar cacti. The left plot represents expression in the head; the right plot, in larval tissue. (C) HLAU expression in head: differential expression analysis of HLAU genes from heads in the Opuntia sp. dweller D. m. wrigleyi versus the three columnar dwellers D. m. mojavensis, and D. buzzatii versus D. koepferae. (D) HLAU expression in larvae: the same pairwise species as in C with Opuntia sp. dweller versus columnar dwellers, but from larvae tissue. (B–D) Filled dots represent HLAU genes with log2 fold-change > |1| and FDR < 0.05; transparent dots represent nonsignificant differential expression.
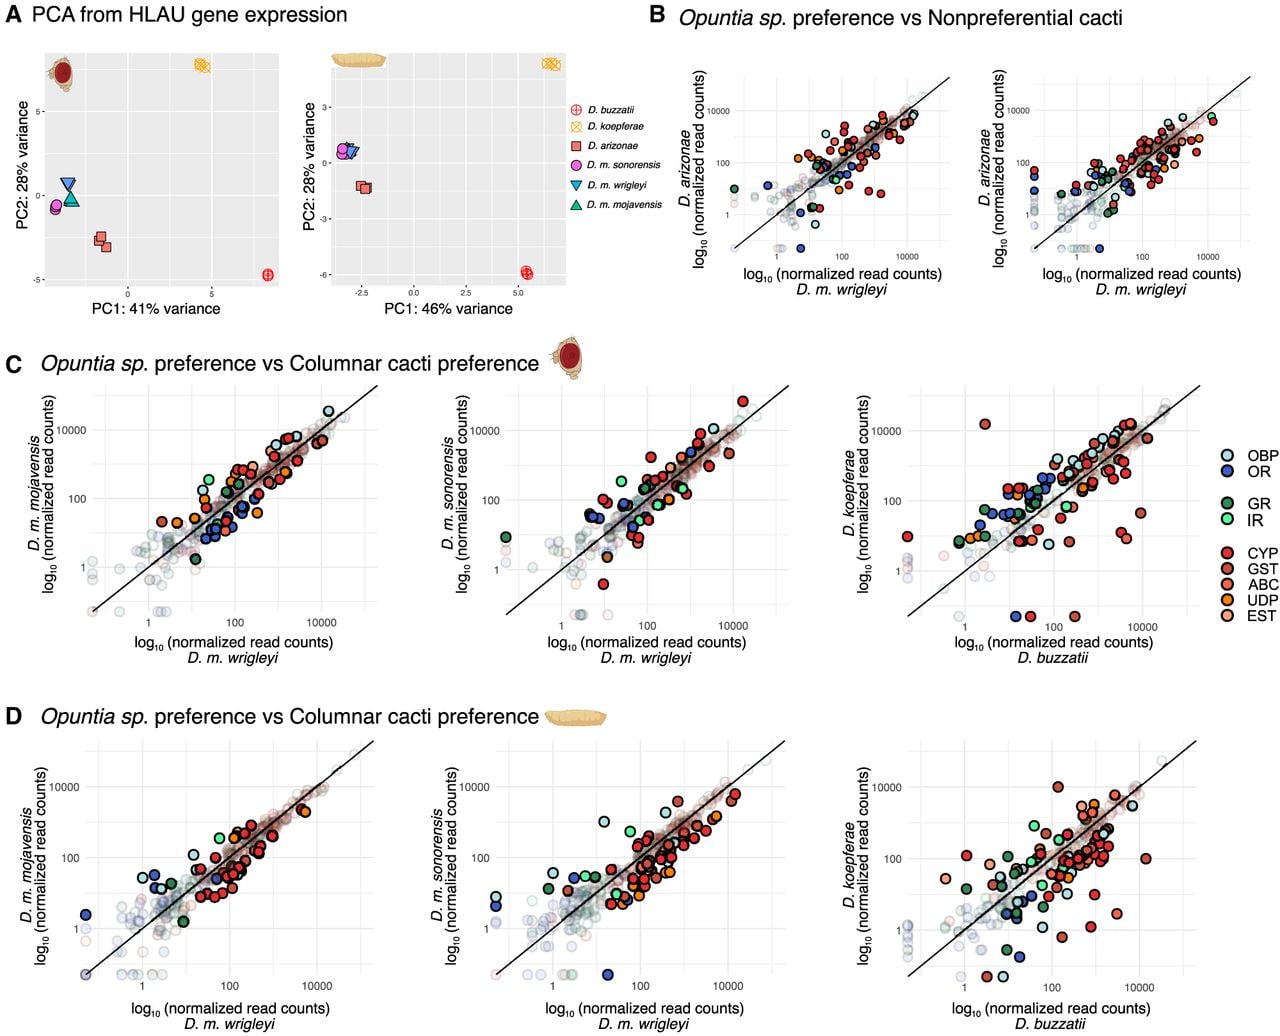
The PCA variance in the heads was highly correlated with ABC, UDP, and GST expression for PC1, whereas EST had a high correlation with PC2 (Supplemental Fig. S6A). In larvae, we observed that ABC, UDP, EST, and CYP are correlated to PC1, whereas GR, IR, and OBP are positively correlated to PC2 (Supplemental Fig. S6B). These results suggest that genes associated with host usage contribute to the variance of expression patterns between species in heads, whereas variance in larvae is represented by families from location, acceptance, and host usage.
We performed pairwise analysis of HLAU gene expression between species with Opuntia sp. preference (D. m. wrigleyi and D. buzzatii) versus species with preference for columnar cacti and with D. arizonae as nonpreferential cacti. All differentially expressed HLAU genes, as well as the presence of TEs in their promoters, can be accessed in Supplemental Table S10. In heads, D. m. wrigleyi had 27 and 19 HLAU genes with higher expression compared with D. m. mojavensis and D. m. sonorensis, respectively (Fig. 3C). Four genes were found with higher expression in the heads of D. m. wrigleyi compared with the other two subspecies: UDP-Ugt4, Gst-theta3, Abc-a3, and Cyp6a21. In the subspecies with columnar cacti preference, we observed, on average, 26 HLAU genes with higher expression compared with D. m. wrigleyi. Among them, seven were recurrent in the two subspecies: Ir21a, EstB1, UDP2, UDP-Ugt5, Cyp9b2, UDP-Ugt5-1, and Cyp12a2. Because they were observed in the two subspecies with columnar cacti preference, we propose that they are candidates to be related to the adaptation to columnar cacti. Finally, the same analysis on larvae revealed that D. m. wrigleyi has three genes with recurrent higher expression compared with the other subspecies—Or82a, Obp59a, and Ir21a; whereas in the other two D. mojavensis subspecies, we observed 17 common upregulated genes compared with D. m. wrigleyi, which comprise seven CYP genes, three GSTs, four UDPs, one EST, and one OBP (Fig. 3D). Regarding D. buzzatii and D. koepferae, we observed 27 HLAU genes in heads and 54 in larvae with higher expression in D. buzzatii, and 63 in heads and 29 with higher expression in D. koepferae. We also compared the head expression of HLAU genes between D. m. wrigleyi and its sister species, D. arizonae, without cacti host preference: D. arizonae. In D. m. wrigleyi, we found 31 HLAU genes with higher expression compared with its counterpart D. arizonae. In larvae, D. m. wrigleyi had 43 HLAU genes with higher expression compared with D. arizonae (Fig. 3B). This result demonstrates that HLAU genes have divergent differential expression in both heads and larvae.
To further investigate whether differential expression of HLAU genes has a higher prevalence compared with non-HLAU genes, we compared the proportion of differentially expressed genes associated with localization, acceptance, and usage with the proportion of differentially expressed genes from the non-HLAU gene families SER and ZF. In heads, our analysis revealed that localization and usage have higher differential expression than non-HLAU genes between D. buzzatii and D. koepferae (Supplemental Fig. S7). In D. mojavensis subspecies, we observed higher differential expression for localization genes between D. m. wrigleyi and D. m. mojavensis. In larvae, we did not observe any significant difference between non-HLAU and HLAU genes in D. buzzatii versus D. koepferae, but the pairwise differential expression between D. m. wrigleyi and two subspecies and D. arizonae revealed a higher prevalence of gene families associated with usage (detoxification) compared with non-HLAU (Supplemental Fig. S7). In D. m. wrigleyi versus D. arizonae, we also observed higher differential expression of localization genes than in non-HLAU. Taken together, the quantitative results suggest that adaptations that have allowed the shift from Opuntia sp. to columnar cacti may arise from the evolution of gene expression.
The enrichment of TEs on HLAU genes is not associated with changes in gene expression
Because we observed enrichment of TEs on the regulatory regions of a few host shift–related families, mainly ORs, and we also found differentially expressed HLAU genes between species, we tested whether the presence of TE insertions is associated with differential expression. To do so, we selected expressed HLAU genes (see Methods) and performed a X2 independence test, splitting them into two variables with two categories each: (1) expression level—differentially expressed, and nondifferentially—and (2) TE presence—with TEs at 2 kb upstream and without TE at 2 kb upstream. Considering all pairwise analysis (Fig. 3B–D), the X2 results demonstrated that the differential expression of HLAU genes is not associated with the presence of TEs on the promoter region (Supplemental Table S11). Because we did not observe overall effects of TEs on the expression of HLAU genes together, we investigated the association of TEs with differential expression only for HLAU gene families that we found TE enrichment (Fig. 2A). None of the enriched gene families had a significant association between the presence of TEs and their expression level (Supplemental Table S11). Thus, a global enrichment of TEs in the regulatory region is not likely to be associated with the differential expression of HLAU genes.
Make or break: gene–TE chimeras contribute either predominantly or marginally to gene expression
Although highly deleterious, a small fraction of TEs generating chimeric transcripts can be positively selected, giving rise to domestication and exaptation events (Capy 2021). Aiming to identify the extent of the transcriptome variability generated by gene–TE chimeric transcripts, we analyzed the transcriptome of head and larval tissues in the six cactophilic Drosophila species. The method employed in this work considered paired-end reads spanning from TEs to exons. Although systematically found in all replicates, many chimeras are likely to be products of pervasive transcription, generating ectopic transcripts whose expression levels are insufficient to play a functional role. Therefore, we developed an automatic method to assemble chimeric transcript isoforms and compute their expression contribution relative to the total gene expression. This method is implemented in the pipeline ChimeraTE v2.0 (Oliveira et al. 2023) as an optional downstream analysis to the total chimeras detection.
Our results revealed that, on average, 715 and 574 genes produce chimeric transcripts across all species, corresponding to 7.51% and 5.04% of the expressed genes in heads and larvae, respectively. In both, TE-exonized transcripts represented the highest frequency, with 87.59% in heads and 89.09% in larvae (Fig. 4A), followed by TE-terminated transcripts with 10.63% and 9.45% and in TE-initiated transcripts with 1.79% and 1.51%. All species have a similar number of expressed genes (heads: x¯ = 9508, σ = 300; larvae: x¯ = 11,375, σ = 117), but we observed on average 11-fold fewer chimeric transcripts in D. buzzatii and D. koepferae compared with the D. arizonae and D. mojavensis subspecies. This result suggests that either species from the mojavensis cluster are more prone to generate chimeras or that D. buzzatii and D. koepferae have a strong purifying selection against gene–TE chimeric transcripts.
Chimeric transcripts in cactophilic Drosophila species. (A) Proportion of each chimeric transcript category based on the position of TE insertions relative to the gene structure. (B) Histograms with contribution of chimeric transcript isoform relative to total gene expression (x-axis). Chimeric transcripts without assembled sequence or contribution <25% were removed (gray bars). (C) Number of common and unique chimeric transcripts from HLAU genes detected in heads and larvae. (D) The Eato/LOC6578120 (ABC transporter) gene has a conserved TE-exonized transcript with a LINE/R1 element located in its seventh intron. The depth in exons, including the seventh intron, was assessed with RNA-seq from head tissue.
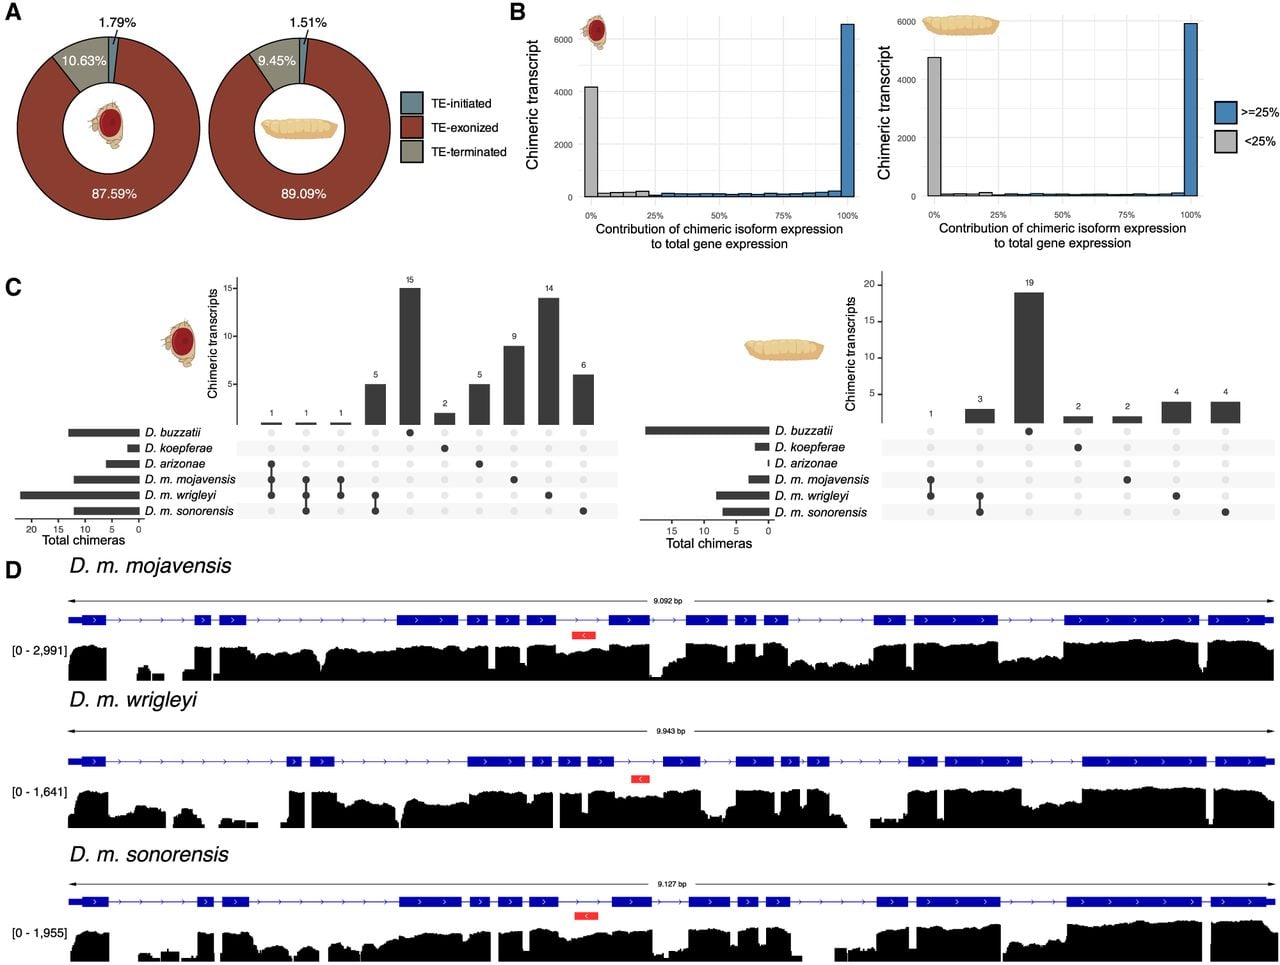
In heads and larvae, ∼49% of the detected chimeric transcript isoforms were not assembled or had a contribution to gene expression <25% (Fig. 4B). Among these discarded chimeras, the vast majority were not detected by the transcriptome assembly approach (0% contribution) (Fig. 4B), which is likely to be associated with negligible expression. Considering chimeric transcripts with contribution ≥25%, >95% have contribution equal to 100% (Fig. 4B). This result indicates that almost all genes producing chimeras are dependent on the TE sequence to constitute their complete mRNA sequence. Because ∼88% of all chimeras detected with >25% contribution are from TE-exonized transcripts, for which 72.35% are from TEs embedded in exons, a high frequency of chimeras with total gene expression could be expected. Notably, this pattern is also observed in TE-initiated and TE-terminated transcripts (Supplemental Fig. S8), despite the TEs being located upstream of and downstream from the gene body. Our results reveal a clear bimodal trend: Either chimeric transcripts have low expression and are unlikely to be biologically relevant, or they account for the total gene expression, suggesting a functional role.
HLAU genes generate chimeric transcripts
To investigate cases in which TEs produce chimeric transcripts from HLAU genes, as well as their possible role in the evolution of these genes, we identified all chimeras derived from HLAU genes in head and larval transcriptomes. We found a total of 28 (head) and 24 (larvae) HLAU genes producing chimeric transcripts. Although D. buzzatii had 11-fold fewer chimeras than did species from the mojavensis cluster, we observed 29 gene–TE (a few genes with more than one chimera) chimeras derived from HLAU genes in heads and larvae, the highest number among all species. Its sister species D. koepferae had only four chimeras, which are the same two ABC genes in heads and larvae (Supplemental Table S12). In D. buzzatii, ∼93% of all chimeras are from GSTs, expressed in both larvae and heads. All of them represent cases of Helitron exonizations (Supplemental Table S12). We did not find any GST with chimeric transcripts in the other transcriptomes, revealing an unprecedented recent evolutionary novelty in GSTs’ evolution in D. buzzatii.
Chimeric transcripts from HLAU genes are represented by 14.81% TE-terminated transcripts and 85.19% TE-exonized transcripts. We did not observe any TE-initiated transcript from HLAU genes. Despite the compelling evidence of TEs enrichment in the promoter of OR genes from species of the mojavensis cluster, we did not observe chimeric transcripts from ORs at high frequency. Only Or45b (LOC6578440), Or13a (LOC26527676), and Or85a (LOC26528431) had chimeric transcripts in D. m. sonorensis, D. m. wrigleyi, and D. arizonae, respectively (Supplemental Table S12). This result reveals that TEs located in the promoter of ORs are not likely to be co-opted as alternative TSSs. In the species of the mojavensis cluster, we observed ABCs as the gene family with the highest frequency of chimeras (Supplemental Table S12), despite not having enrichment (Fig. 2A). We observed, on average, five ABC genes with exonization of multiple TE copies in this group of species. This result indicates that the genomic distribution of TEs is not necessarily associated with their transcriptional interaction with genes.
The quantitative analysis on chimeric transcripts revealed transcriptional polymorphism in HLAU genes owing to TEs. We investigated common chimeras present in more than one species, highlighting their retention over evolutionary time, as well as species-specific chimeras that may be associated with recent insertions. Our results revealed that 94.44% and 88.57% of the chimeric transcripts derived from HLAU genes are species specific in heads and larvae, respectively (Fig. 4C). In heads, the Opuntia sp. dwellers D. buzzatii and D. m. wrigleyi were the ones with the highest number of HLAU genes with species-specific chimeric transcripts (Fig. 4C). The 15 chimeras uniquely found in D. buzzatii were derived from 12 genes (two ABCs and 10 GSTs), whereas the 14 chimeras from D. m. wrigleyi were observed from 10 genes (five ABCs, three IRs, one CYP, and one OBP) (Supplemental Table S13). In larvae, D. buzzatii follows a similar result as observed in heads, 15 chimeras derived from 14 genes (two ABCs and 12 GSTs), whereas D. m. wrigleyi had only four unique chimeras (two ORs, one IR, and one CYP).
Cases of common chimeric transcripts between populations/species may indicate exaptation/domestication events. In the six transcriptomes analyzed here, we found eight genes in the heads and four in larvae present in more than one genome (Supplemental Table S13). These common chimeric transcripts occurred only between D. mojavensis subspecies, revealing that TEs interacting with HLAU genes are likely to be lost over higher evolutionary scales. Their inclusion into the mRNA sequence and high contribution can be observed. For instance, the ABC transporter (Eato gene) has an exonized LINE/R1, which is located in the seventh intron (Fig. 4D), with an average contribution of 84.25% to the gene expression. Taken together, these results demonstrate unprecedented transcriptional interaction between TEs and HLAU genes in adult heads and larvae.
Discussion
Insect host shift and its role in speciation have been the subject of research to understand the evolution of reproductive isolating barriers and adaptation to local environments. Indeed, many insects have finely tuned adaptations to locate, feed, reproduce, and develop on the host tissue. Adaptations to new hosts can lead to reproductive isolation, wherein ecological speciation arises as a consequence within divergent natural populations inhabiting distinct environments. In this context, we investigated whether TEs could play a role in contributing to the evolution of HLAU genes, with the potential to facilitate rapid adaptive radiation to new hosts. To test this hypothesis, we selected six Drosophila species/subspecies from the repleta group with different primary cacti hosts.
No positive selection in columnar cacti dwellers versus Opuntia sp. dwellers
The necrotic tissue of each cactus-host used by cactophilic Drosophila species differs in its composition in terms of yeasts and alkaloids (Fogleman et al. 1982; Fogleman and Danielson 2001). Therefore, species have adapted to feed and breed on different hosts, as demonstrated by behavioral and physiological response when species feed and breed in nonpreferential hosts. Positive selection in HLAU genes has been proposed to allow the recognition of a broader spectrum of odors, to metabolize nutrients, and to activate detoxification pathways (Markow 2019). Indeed, specialist species are likely to lose some of their genes related to sensory pathways, whereas the genes that are retained are subject to positive selection (McBride 2007; McBride and Arguello 2007). A preliminary genome-wide analysis of signatures of positive selection in the four D. mojavensis subspecies revealed high ω rates on genes associated with chemosensation, perception, immunity, behavior, detoxification, and reproduction (Allan and Matzkin 2019). Although a previous genome-wide analysis has identified 1294 genes under positive selection (Guillén et al. 2015), here we focused the analysis to specifically investigate HLAU gene families. Although the site model identified diversifying selection at specific sites of Atet and Cyp4ae1 genes, the branch and branch-site models revealed no evidence of diversifying selection. The branch and branch-site models analyze the common differences of species adapted to columnar cacti, rather than independent evolutionary events, making it more stringent. The lack of genes with statistical support (FDR < 0.05) for positive selection in the branch analyses may also be associated with technical limitations, because we based our analysis on one:one orthologs, and a certain proportion of the genes evolve too fast to be correctly assigned during ortholog identification (Kristensen et al. 2011).
OR promoters are enriched with TE insertions
The literature has recurrently demonstrated that TEs can create new regulatory elements, including gene promoters (Faulkner et al. 2009; Emera et al. 2012; Kapusta et al. 2013), enhancers (Xie et al. 2013, 2; Ye et al. 2020), and insulators (Schmidt et al. 2012; Wang et al. 2012). In mammals, TE-derived sequences contribute up to 40% of genome-wide binding sites for TFs located in TE-rich regions (Sundaram et al. 2014). It has been proposed that such co-option of TE-regulatory elements for gene regulatory networks can provide substantial modification of gene expression over short timescales, contributing to genetic variability at the transcriptome level (Mateo et al. 2014; van't Hof et al. 2016; Gill et al. 2021). The colonization of new habitats and hosts is accompanied by behavioral changes, mainly through alterations in environmental perception (Dekker et al. 2006; Matsuo et al. 2007). Here, we observed that ORs are enriched by TEs in the three subspecies from the mojavensis cluster. In ants, ORs have also been found enriched in TEs. In this case, TEs are associated with tandem duplication by crossing over, allowing massive duplication events (McKenzie and Kronauer 2018). Because there is no expansion of ORs in cactophilic species, the enrichment in TEs is likely to have another function, probably related to gene regulation owing to its specific location in promoters. Although we did not observe a significant enrichment of TEs in differentially expressed genes, we argue that TEs might contribute to the regulation of specific HLAU genes. In ORs, ∼39% of the genes have the OR's TFBSs located within TEs. We propose that this subset of genes is not sufficient to have a significant signal when tested with ORs without TEs, but they may have functional TE-derived cis-regulatory elements.
Helitrons have been extensively reported on the promoter of other eukaryotic species (Gupta et al. 2005; Cultrone et al. 2007; Thomas et al. 2014; Huang et al. 2016), in which a few cases of embedded TFBSs were reported (Carareto et al. 2014; Batista et al. 2019). Here, we demonstrated that ∼50% of the enrichment in TEs observed at the promoter region of ORs might be owing to the exaptation of TFBSs derived from Helitrons. In addition, the recurrent enrichment in species of the mojavensis cluster might demonstrate potential cases of TE co-option inherited by the common ancestor. Our genomic analysis provides a robust list of potential candidate genes in which Helitrons might play a regulatory role. This is an interesting hypothesis that can be determined through cutting-edge technologies such as CRISPR methods to delete insertions with site-specific resolution (Merenciano et al. 2023). Our results suggest a putative role of TEs in the regulation of HLAU genes across multiple species/subspecies.
Head transcriptome reveals subspecies-specific patterns
The differential expression of HLAU genes in heads revealed that localization and host usage (detoxification) gene families have the highest divergence across the subspecies, because we observed more differentially expressed genes for these families. In D. m. wrigleyi, which is the only D. mojavensis subspecies with a preference for Opuntia sp., we observed that CYP genes had on average 12 upregulated genes compared with the other subspecies. This result highlights that the divergence of cacti preference between D. mojavensis subspecies might be explained by modifications in gene expression of HLAU genes in the head. Although Opuntia sp. has lower toxicity than columnar cacti (Wright and William 2014), we found a similar number of upregulated detoxification genes in D. m. wrigleyi and compared to the other subspecies. This suggests that D. m. wrigleyi has a constitutive detoxification response that is independent of host toxicity. This is a plausible explanation because Opuntia sp. produces fewer benzaldehyde volatiles than the columnar cacti S. thurberi, but both cacti are lethal to D. melanogaster after 48 h (Wright and William 2014). Therefore, the adaptation to use Opuntia sp. must have a constitutive gene expression of the detoxification pathways in D. m. wrigleyi.
Comparative transcriptomic studies have revealed divergence in gene expression between D. buzzatii and D. koepferae, particularly in head tissues associated with sensory perception and detoxification. For instance, Guillén et al. (2015) reported significant differences in the expression of genes involved in olfaction and xenobiotic metabolism, suggesting that these species have adapted to their respective cactus hosts (Opuntia for D. buzzatii and columnar cacti for D. koepferae). Similarly, divergence in expression patterns has been reported in these species in ORs, OBPs, and CYP genes (Hasson et al. 2019). These differences are consistent with our results in heads and larvae, reinforcing the hypothesis that ecological specialization and divergence in head transcriptomes play a role in host shift between D. buzzatii and D. koepferae. Further studies must be conducted to explore the differential expression of HLAU genes in the gut, in which a significant portion of the detoxification occurs in Drosophila (Wu et al. 2015).
Previous studies with D. melanogaster have shown that sequence divergence in ORs and OBPs significantly modulates odor sensitivity (Matsuo et al. 2007; Hickner et al. 2016), potentially leading to divergence of host location. In addition, many ORs are involved in a broad range of ecological interactions, influencing behaviors associated with oviposition and feeding (Mansourian and Stensmyr 2015). For instance, OR evolution has mediated the herbivorous nature of leaf-mining specialist Scaptomyza flava (Goldman-Huertas et al. 2015). Furthermore, transcriptomic analyses have identified 18 ORs that are differentially expressed between heads of D. m. wrigleyi and D. m. mojavensis, demonstrating that modifications in the sensory transcriptome have evolved between these species (Crowley-Gall et al. 2016). In this study, we expanded the understanding of this divergence by comparing species with a preference for Opuntia sp. and columnar cacti, and showed that each species has a distinct set of differentially expressed HLAU genes.
Gene expression in larvae is one of the factors shaping the adaptation to new hosts
Differences in larval behavior and survival have been observed when Opuntia-related species are reared in columnar cacti (Ruiz and Heed 1988; Mateus et al. 2019). A previous study showed that D. m. mojavensis, which primarily uses S. thurberi as its host, has a 60% reduction in larval viability when reared on S. gummosus–based media (Matzkin 2012). The authors also proposed that 21% of the genes are differentially expressed between larvae reared in the primary and alternative cacti hosts. Many genes were reported with detoxification and energy production, among others. Another similar study with larvae transcriptome, but with D. buzzatii and D. koepferae, proposed that D. buzzatii flies reared in columnar cacti media have a stronger detoxification response in comparison with D. koepferae flies, suggesting that D. koepferae has a canalized transcriptome response to the toxic alkaloids from columnar cacti (De Panis et al. 2022).
Here, we observed that the majority of differentially expressed HLAU genes are from gene families associated with detoxification. Because D. m. wrigleyi and D. buzzatii use primarily Opuntia sp., we expected to find a higher number of detoxification genes in the other species/subspecies with columnar cacti preference. However, we observed a similar number of differentially expressed detoxification genes regardless of the host preference. CYPs were overrepresented in our results, but they represent a diverse gene family that can have functions other than detoxification, such as those related to developmental pathways in larvae (Tijet et al. 2001; Feyereisen 2012). Thus, further analysis of the biological role of upregulated CYP genes in D. m. wrigleyi and D. buzzatii might be assessed. Alternatively, as we observed in the head transcriptome, although Opuntia sp. has lower toxic compounds compared with columnar cacti, D. m. wrigleyi and D. buzzatii may also have a resistance to toxicity (Wright and William 2014). Thus, any cactophilic species is expected to have evolved a certain level of detoxification ability, which explains our observations. In this study, we propose a set of common HLAU genes in columnar cacti dweller species associated with detoxification. We observed that the three D. mojavensis subspecies have the same seven genes with higher expression compared with D. m. wrigleyi. Most of them are associated with detoxification (EstB1, UDP2, UDP-Ugt5, Cyp9b2, UDP-Ugt5-1, Cyp12a2), except Ir21a. It is noteworthy that other evolutionary forces than gene expression might be associated with host shift. For instance, gene duplication events have been reported in CYPs and GSTs in cactophilic Drosophila species (Rane et al. 2019). These duplications are thought to enable flies’ resistance to different toxic environments. Similarly, D. buzzatii and D. koepferae show both copy number variation and expression divergence in detoxification genes, indicating that gene duplication followed by regulatory or coding sequence divergence contributes to host-specific physiological adaptations (Guillén et al. 2015; Rane et al. 2019). These findings support the view that gene duplication serves as a key evolutionary mechanism facilitating ecological specialization in cactophilic Drosophila. Our results show that divergence in the regulation of gene expression in larvae is one of the factors likely to shape the adaptation to new hosts.
TEs are a source of transcriptome variability between cactophilic Drosophila species
TEs contribute to genome and transcriptome evolution by rewiring regulatory networks and by incorporating protein domains into gene transcripts. In both cases, TE copies that are inserted within genes can integrate their sequences into the mRNA, generating chimeric transcripts. A recent study with different ecotypes of D. melanogaster has shown that these chimeras have the potential to generate transcriptome novelties (Oliveira et al. 2023). These chimeras have also been demonstrated to be active in a tissue-specific manner (Coronado-Zamora and González 2023). Although the production of chimeric transcripts derived from polymorphic TE insertions is well known, there is no study addressing the question of how TEs contribute to the evolution of genes associated with host shift. Here, we took advantage of genomic and transcriptomic data to analyze the transcriptional interaction of TEs with HLAU genes through gene–TE chimeric transcripts. Our finding demonstrated that around one-half of the chimeras have low expression levels (0%–5%) and are likely to represent pervasive transcription of TEs. Notably, >95% of the chimeras overpassing the 5% contribution to gene expression constitute nearly the total gene expression. In this analysis, we included only TE copies located within 3 kb upstream and 3 kb downstream regions, although longer-range gene–TE interactions have been reported (Chuong et al. 2016). Further studies integrating RNA-seq with 3D chromatin folding approaches such as Hi-C could help identify chimeric transcripts from TEs in trans.
Considering previous findings in different tissues of D. melanogaster, in which 38% of all chimeric transcripts express only the chimeric isoform (Coronado-Zamora and González 2023), our result shows a higher prevalence of chimeras in the repertoire of gene splicing. In tetrapods, the exonization of TE-derived transposases has been shown to constitute the unique gene isoform (Cosby et al. 2021). In HLAU genes, all chimeric transcripts represent TE-exonized transcripts. We suggest that TEs in the promoters of ORs might still recruit TFs at their terminal sequences, which would prevent their inclusion in the gene mRNA (chimera). In addition, the maintenance of TEs in the promoters of ORs might also be owing to epigenetic marks. TEs can have chromatin marks (Lippman et al. 2004; Pal et al. 2023), making them versatile regulatory motifs acting in the regulation of nearby genes (Guio et al. 2018; Coronado-Zamora and González 2023). Further experimental analysis, as ChIP-seq, may be performed to test the TEs’ function in OR's transcription. Furthermore, TE annotation remains challenging in nonmodel organisms. Although we performed several steps to remove potentially false TE copies from the genome, we can not rule out the possibility of remaining annotation errors in the exons of HLAU genes.
A comparative analysis between generalist and specialist Drosophila species revealed that niche amplitude is not likely to play a role in TE dynamics in the genomes (Fonseca et al. 2019). Nevertheless, several studies have proposed that the successful adaptation to new environments in invasive species might be associated with TE activity, despite reduced genetic diversity caused by founder effects (Marin et al. 2021; Mérel et al. 2021). Here, we demonstrate that TEs interact with genes associated with host shift, providing a transcriptomic variability in six cactophilic species with different host preferences. Our results show that ABC transporters produce chimeric transcripts in all cactophilic species, highlighting a compelling mechanism of structural innovation. In insects, MITEs (nonautonomous DNA transposons) have been repeatedly identified within defensome genes, including ABC transporters, such as in Helicoverpa spp., suggesting a potential causal link to insecticide resistance (Zidi et al. 2022). Functionally, exonized TEs are stably expressed and translated, often producing altered protein domains or localization signals, thereby expanding proteomic repertoires while providing raw material for adaptive selection (Arribas et al. 2024). Taken together, our findings suggest that TE exonization in ABC transporters may offer cactophilic Drosophila a versatile genomic strategy to fine-tune transporter function, potentially under the selective pressures of xenobiotics. Although we found a high contribution of the chimeric isoform to total gene expression, future work should be conducted to elucidate which exonized TEs are translated and whether they modulate substrate specificity, protein stability, or cellular localization, thereby affecting organismal fitness.
Our discovery of 13 GST genes in D. buzzatii harboring exonized Helitrons underscores an unprecedented finding of TE-driven functional diversification in detoxification enzymes. Helitrons have been shown to supply novel exons, splice sites, and promoters across eukaryotes (Thomas et al. 2014). This finding, unique to D. buzzatii, suggests a lineage-specific co-option of Helitrons to expand and diversify GST isoforms. GSTs are central to xenobiotic metabolism, and exonization of Helitron-derived sequences could introduce novel domains or alter enzymatic properties, potentially conferring adaptive advantages under environmental pressures such as exposure to cactus-derived toxins. Future work should be performed to determine the function of these Helitron-derived motifs in the host preference of D. buzzatii.
It is important to state that the identification of chimeric transcripts through transcriptome analysis is an important, but limited step in terms of function. These mRNA molecules might be degraded by surveillance pathways that control for aberrant mRNA production, such as no-go decay (Harigaya and Parker 2010), nonstop decay (Vasudevan et al. 2002), and nonsense-mediated RNA decay (Hug et al. 2016). Our study provides a set of HLAU genes producing chimeric transcripts, in which part of them might have a phenotypic impact and ultimately be associated with host preference. However, it is fundamental to perform comparative phenotypic studies of host adaptation cues with mutant strains for the TEs interacting with HLAU genes identified in this study. The application of techniques of RNAi aiming at chimeric transcripts, as well as the deletion of TE insertions related to chimeras with CRISPR-Cas9 (Merenciano et al. 2023), would be crucial to confirm the predictions of our results.
Potential role of TEs in host shift
Host specificity is a key mechanism of reproductive isolation in plant pathogens and is regulated by the repertoire of effector genes within each pathogen. In Phytophthora sp., the host specificity is partly regulated by RXLR class effectors that facilitate host exploitation. Notably, synthetic chimeras of a short interspersed element (SINE) linked to an effector gene in Phytophthora infestans induced their silencing (Whisson et al. 2012). This silencing likely occurs naturally, as transcriptional inactivation of effectors has been reported, and more than one-half of the RXLR effectors in the P. infestans genome are located in TE-rich regions (Raffaele et al. 2010). Consequently, TEs inserted near these genes may have influenced host shift in P. infestans. Our findings demonstrate multiple interactions between genes and TEs, highlighting the contribution of TEs to the genome and transcriptome evolution of cactophilic species. Although our data did not allow the quantification of the TE insertions frequency in natural populations, our results demonstrate the first transcriptome-wide evidence of TE co-option in cactophilic Drosophila species. Genes producing chimeras with TEs require further investigation, as gene–phenotype associations involving HLAU genes have not been fully characterized, preventing us from establishing a specific link between chimeras and potential host preference. In addition, our study focused exclusively on nine gene families that have been shown to evolve during host shift events (Markow 2019). However, host shift is undoubtedly a complex trait to study, and many other genes can be associated with the adaptation to new hosts. For instance, differential expression of genes associated with development and neurological processes has been identified in cactophilic Drosophila species reared in different cacti media (De Panis et al. 2016). Behavioral changes are also based on host shift evolution and have been reported in many systems (Knolhoff and Heckel 2014). Despite focusing on nine relevant gene families, we suggest further studies including other aspects of host shift than localization, acceptance, and host usage.
The existence of reproductive barriers between populations that undergone a host shift is the key process to ecological speciation. In our model, with species from the buzzatii and mojavensis clusters, incipient reproductive isolation has been reported between D. m. sonorensis and D. m. baja (Zouros and d'Entremont 1980; Markow 1991; Pfeiler et al. 2009). The premating isolation between them occurs owing to the difference in cuticular hydrocarbons, which participate in the signaling pathway of mate recognition (Howard and Blomquist 2005). Importantly, artificially shifting the cactus host was the main cause of changes in the hydrocarbon profiles. Thus, the source of reproductive barriers is dependent on the cacti species on which the flies feed and breed (Stennett and Etges 1997; Havens and Etges 2013). The close relationship between HLAU genes to the host shift process, and the observed contribution of TEs to their evolution, supports a possible role of TEs in the host preference of cactophilic species. However, it is important to highlight that HLAU gene families are not likely to represent the only genes involved in host shift. Other gene families can also contribute to this process, such as genes associated with development (Savković et al. 2023) or with decision making (Williams-Simon et al. 2019). In addition, we treated all genes from each gene family as having functions directly associated with location, acceptance, or detoxification. Nevertheless, some genes may have different functions than those, such as CYP genes in hormone metabolism (Sutherland et al. 1998). Because we do not have experimental data showing these functions in D. mojavensis, we maintained all genes. Further studies must be conducted to test the function of the genes reported in our work as HLAU-related.
Methods
Fly stocks and genome sequencing
Most of the strains were obtained from the UC San Diego Drosophila Stock Center (D. m. mojavensis: Anza [01], Anza Borrego Desert, California, Stock Center 15,081–1352.01; D. m. wrigleyi: CI [22], Catalina Island, California, Stock Center 15,081–1352.22; and D. m. sonorensis: AG [26], Agiabampo Bay, Sonora, Mexico, Stock Center 15,081–1352.26) and D. arizonae (HI [17], collected in Metztitlan, Hidalgo, Mexico, Stock Center 15,081–1271.17). The D. buzzatii (Bu28) and D. koepferae (Ko2) stocks correspond to two laboratory lines used in previous works (Romero-Soriano et al. 2016; Bodelón et al. 2022). Both stocks were maintained by brother–sister mating for more than a decade and then kept by mass culturing.
We used the same protocols of DNA extraction and genome sequencing for all samples. DNA was extracted from 10 males and 10 females from each species using the Qiagen DNeasy blood & tissue kit. Then, we evaluated the genomic DNA amount and quality with NanoDrop One UV-vis spectrophotometer (Thermo Fisher Scientific) and Qubit 1.0 fluorometer (Invitrogen). Three micrograms of DNA was repaired using the NEBNext FFPE DNA repair mix (NEB M6630). We performed end repair and dA-tailing using the NEBNext end repair/dA-tailing module (NEB E7546). Ligation was then assessed with the ligation sequencing kit 1D. MinION sequencing was performed according to the manufacturer's guidelines using R9.4.1 flow cells (ONT FLO-MIN106) and a Nanopore MinION Mk1b sequencer (ONT) controlled by ONT MinKNOW v.18.3.1. Base calling was performed after sequencing using Guppy v.4.0.5 in high accuracy mode for isogenic wild-type strains v.3.1.5.
Genome assemblies and gene annotation
The quality control for Nanopore reads was performed with NanoPlot v.1.10.2 (https://github.com/wdecoster/NanoPlot). Reads with quality lower than seven were removed from downstream analysis. To assemble contigs, Flye v.2.8 (Kolmogorov et al. 2019) was used with default parameters, except –plasmids. All contigs were aligned with minimap2 v2.16 (Li 2018), with the –x map-ont option. The alignment was used to perform the polishing of contigs with four rounds of Racon v1.3.2 (Vaser et al. 2017), with default parameters. The assembly quality metrics were assessed with Assembly Stats v1.0.1 (https://github.com/sanger-pathogens/assembly-stats). Assembly incongruences were manually visualized with D-GENIES v1.2.0 (Cabanettes and Klopp 2018) and corrected with SAMtools v1.9.0. (Li et al. 2009), function faidx, as well as Gepard v1.4.0 (Krumsiek et al. 2007) for the determination of breaking points. The superscaffolding of all the corrected assemblies was performed with RaGOO v.1.1 (Alonge et al. 2019), with –s and –t 4 parameters, using the respective reference genome assembly for each species. Subsequently, the chromosome-scale assemblies were submitted to a BUSCO v.5.4.3 analysis (Simão et al. 2015) with lineage diptera_odb10 (-l parameter). The gene annotations for D. mojavensis subspecies and D. arizonae were performed with the software Liftoff v.1.6.3 (Shumate and Salzberg 2021), with the reference genome of D. mojavensis (GCA_018153725.1) (Kim et al. 2021). We have used the parameters –exclude_partial; -a 0.5 and –s 0.75 to keep annotated genes with at least 75% of the reference gene length. We removed from our gene annotation HLAU genes flagged as “low quality protein” and “unestablished gene function” in the reference D. mojavensis genome.
D. buzzatii and D. koepferae genomes were annotated with a de novo strategy with BRAKER3 v.3.0.8 (Gabriel et al. 2024). To optimize the prediction of gene structures and repertoire of isoforms, we used a mix of RNA-seq data from different tissues publicly available and produced in this work (Supplemental Table S14), in addition to protein sequences from D. mojavensis as reference. Ortholog genes between D. buzzatii, D. koepferae, D. mojavensis, and D. arizonae were obtained with OrthoFinder v.2.5.4 (Emms and Kelly 2019) using DIAMOND v.0.9.14 (Buchfink et al. 2015) as search engine. One-to-one orthologs were obtained directly from OrthoFinder, and remaining proteins without an ortholog pair were analyzed with BLASTP v.2.5.0 (Altschul 1997), for which we considered as one-to-one proteins only those with a single homologous with the parameter -perc_identity 90 and with at least 95% of the reference protein length. Because OrthoFinder performs its search using protein sequences, the identification of orthologs from noncoding RNA genes was assessed with Liftoff (Shumate and Salzberg 2021) using all the noncoding RNA genes from D. mojavensis as a reference to maximize our homology-based gene annotation.
Molecular evolution analysis
To identify HLAU genes with signatures of positive selection in species that prefer columnar cacti compared with those that prefer Opuntia sp., we selected the three D. mojavensis subspecies, D. navojoa, D. koepferae, and D. buzzatii. We removed D. arizonae from this analysis owing to its generalist preference for both columnar and Opuntia cacti. The D. navojoa genome was retrieved from NCBI (GCF_001654015.2) (Vanderlinde et al. 2019). For the other Nanopore genomes sequenced in this work, we performed a polishing step with Illumina paired-end reads. We used the tool NextPolish (Hu et al. 2020) to fix base errors in the assembled genomes. The three D. mojavensis subspecies were polished with genomic Illumina reads sequenced previously (Banho et al. 2021), whereas for D. koepferae and D. buzzatii, we used publicly available genomic Illumina reads (Moreyra et al. 2023) and RNA-seq reads (Guillén et al. 2015), respectively. For RNA-seq data, to increase the read coverage and optimize the polishing to the highest number of genes and exons as possible, we merged RNA-seq reads from adult males and females (Guillén et al. 2015). All genomes were corrected using two rounds of polishing, as recommended (Hu et al. 2020). Then, we extracted the longest CDS sequences for all genes, combining AGAT (https://github.com/NBISweden/AGAT) agat_extract_sequences.pl parameters -t mrna, SAMtools faidx (Li et al. 2009), and seqtk (https://github.com/lh3/seqtk). Posteriorly, we intersected the occurrence of orthologous genes between the six genomes, recovering a list of genes that were present in all of them. The sequences were aligned using MAFFT v.7.487 (Katoh and Standley 2013), and the non-aligned codons were removed using PAL2NAL (Suyama et al. 2006). To obtain a strongly supported tree for this analysis, we inferred the species phylogeny tree with 2043 shared BUSCO genes. The phylogeny was estimated using the concatenated alignment (3,730,914 sites) with IQ-TREE v. 2.2.2.6 (Minh et al. 2020), using the best model for each gene, 10,000 replicates of ultrafast bootstrap, and 1000 replicates for an approximate likelihood-ratio test (ALRT) (parameters -m MFP -bb 10000 -alrt 1000). Finally, we carried out an analysis to detect signatures of positive selection for each gene individually with paPAML v.2.13 (Steffen et al. 2022), which uses CODEML from PAML v.4.10.7 (Yang 2007). We used the models branch-site, site, and branch. To find signatures of positive selection in species that use columnar cacti with branch and branch-site, we marked the respective branches of D. koepferae, D. m. mojavensis, and D. m. sonorensis with the same label (#1) to compare them with the background species that use Opuntia sp. (D. buzzatii, D. m. wrigleyi, and D. navojoa). Thus, we tested two hypotheses: (1) the null hypothesis (H1), in which all branches evolved without selection pressure (model = 2, Nssites = 2, fix_omega = 1, omega = 1) and (2) the alternative hypothesis (H2), in which selection pressure can vary between labeled branches (foreground) and background (model = 2, NSsites = 2, fix_omega = 0, omega = 1.5). The hypotheses were tested through a χ2 test, calculated by the log-likelihood (lnL) ratio between H1 and H0 (2ΔlnL) and degrees of freedom obtained from the difference between the number of estimated parameters for H1 and H0 (Δnp). Sites under positive selection were identified by a Bayes empirical Bayes and posterior probability, implemented in CODEML. The P-value was adjusted by Benjamini–Hochberg procedure to control the false-discovery rate (FDR) (Benjamini and Hochberg 1995). Only genes with FDR < 0.05 were considered significant.
RNA extraction and sequencing
We performed RNA-seq for larvae and adult heads from D. buzzatii, D. koepferae, D. arizonae, and the three D. mojavensis subspecies. The RNA extraction was assessed with the RNeasy plus kit for 10 female heads (10 days old) and 15 larvae, with three technical replicates. Female flies were selected because, unlike males, they seek out the cacti to oviposit. This additional behavior might require fine-tuning adaptations in the environment perception that could potentially be absent in males. The library preparation was done with stranded mRNA-seq/standard quantity (ligation), and 100 bp paired-end reads were produced in an Illumina HiSeq 4000. Illumina adaptors and low-quality reads were removed for downstream analysis with Trimommatic v.0.39 (Bolger et al. 2014), witt the following parameters: LEADING:3; TRAILING:3; SLIDINGWINDOW:4:15; HEADCROP:10; CROP:90.
TE annotation
We developed a novel pipeline combining automatic and manual approaches to build TE consensuses for each sequenced genome. First, we used Earl Grey v.2.2 (Baril et al. 2024) to build de novo TE libraries with RepeatModeler2 v.2.0.4 (Flynn et al. 2020), which uses RECON v.1.08 (Bao and Eddy 2002), and RepeatScout v.1.0.6 (Price et al. 2005). We used the parameters -r 32281 (NCBI taxon ID for Drosophila), -c yes (cluster redundant consensus), -m yes (remove consensus with <100 nt), and -e yes (enable HELIANO v1.2.1 to identify Helitrons) (Li et al. 2024). In short, Earl Grey automatically retrieves TE consensus and performs an extension of each sequence using a method named “BLAST, extract, extend” (BEE) (Platt et al. 2016). This method extracts the sequences of the 20 full-length (or longest) TE insertions for each consensus, and then it retrieves the 1 kb flanking regions from them. Posteriorly, insertions altogether with flanking regions are aligned with MAFFT v.7.487 (Katoh and Standley 2013), and the alignment is trimmed with trimAl v.1.4 (Capella-Gutiérrez et al. 2009), with the parameters –gt 0.6 and –cons 60. Subsequently, the alignment is analyzed to check whether the flanking regions from the full-length insertions have high quality, meaning that they are part of the TE rather than genomic regions. Finally, the consensus sequence for each TE family is updated with EMBOSS v.6.6.0.0 (Rice et al. 2000). The BEE method is repeated up to 10 times for each consensus.
Once the extended TE libraries were obtained for the six genomes with Earl Grey, we implemented our pipeline into eight steps. First, we removed all sequences other than TEs from Earl Grey's library: satellites, low complexity repeats, tRNA, and rRNA. At step 2, we checked the presence of redundant consensus respecting the 80–80 (Wicker et al. 2007) rule with all-versus-all BLASTN (-qcov_hsp_perc 80 and -perc_identity 80). We found that ∼45% of the consensuses were duplicated. Some of them were identical, or nearly identical, but in opposite strands. We selected the longest consensus from the ones considered redundant. At step 3, we used Tandem Repeats Finder (Benson 1999) to identify consensuses that had >50% annotated as tandem repeats. Consensus falling in this cutoff were removed as they were indistinguishable from tandem repeats. At step 4, we removed all consensus with high similarity with D. m. wrigleyi CDSs using BLASTN, with the parameters -qcov_hsp_perc 80 and -perc_identity 80. TE consensuses that had passed our filtering thresholds were then submitted to the classification analysis. At step 5 of the pipeline, TE consensus was classified at the family level based on similarity analysis of nonreference consensus with a database provided by the user. In our case, we used all consensuses from Drosophila species available on Dfam v3.7 (Storer et al. 2021). Because the “curated” Dfam library contains only D. melanogaster consensus, we used the “uncurated” library from Dfam. We extracted Drosophila TEs with famdb.py v.0.4.3, with the parameters -i Dfam.h5 families ‐‐include-class-in-name -f fasta_name -ad “Diptera”. Then, we filtered out non-Drosophila sequences and “unknown” TEs with the Unix command line grep -i “drosophila” file.fa | grep -v -i “unknown” and obtained 49,916 out of 344,562 consensus. The pipeline firstly classifies at the family level by doing a BLASTN (-qcov_hsp_perc 80 and -perc_identity 80) between the Drosophila Dfam consensus and the provided de novo consensus. Approximately 50% of the identified consensus were classified on the family level based on this BLASTN. The consensus without matches from this stringent BLASTN and <200 nt were filtered out. Because of the stringency of the matches with BLASTN, we also masked the remaining unclassified consensus with the Drosophila Dfam consensus with RepeatMasker v4.1.8 (Smit 2004). Based on RepeatMasker output, we computed the length of all matches from a given family in the unclassified consensus and how much it has been covered based on the unclassified length. If the coverage is >80% of the total length, we assume that the unclassified consensus has diverged from that of the database, but it is still classified as the same matched family. This step classified ∼25% of the consensus. Finally, the remaining unclassified sequences that could not be classified at the family level are classified at the class/order level. We used a cutoff of 50% of covered matches in the unknown consensus to classify their classes. As the family name, we substituted the pattern from RepeatModeler2 as (i.e., rnd-1_family-1) to a pattern representing “species prefix,” “author initials,” and “homology percentage” (i.e., Dari_DSO_86.0275p#DNA/TcMar-Tc1). In this example, “Dari” stands for D. arizonae, “DSO” is the author's initials, and “86.0275p” represents the percentage of the total length that this consensus has been matched with a DNA/TcMar-Tc1. The remaining putative TE consensuses with <50% of coverage with known Drosophila TEs were removed. At the end of this step, we obtained the polished libraries of TE consensus.
In step 6, we checked the strandness of TE consensus sequences based on stranded RNA-seq data. During the clustering of similar sequences and removal of redundancy, we noticed many consensuses with nearly identical sequences but in different senses. To correct TE strandness, we used our stranded RNA-seq data. We annotated TE insertions in the genome with RepeatMasker v.4.1.4 (122), with the parameters -cutoff 250, -s, and -norna. Then, we mapped the reads from a mixed library from head and larvae with STAR v2.7.11b (Dobin et al. 2013). To be certain about the strandness origin of the reads, we removed all insertions that have any overlap with other TEs and/or exons. Then, for each consensus, the pipeline identifies the three copies in the genome with higher expression. Based on these copies, the number of uniquely mapped reads to the same strand of the copy is quantified. If >50% of the reads align to the same strand of the copies, we assume the consensus strandness was right. Otherwise, the pipeline converts the consensus sequence to its reverse complement. This step will add a strandness tag to the consensus ID. For instance, if 75% of the reads support a forward strand, a tag “75st” will be added to the family name. This is useful to provide a metric of certainty about the strandness of each consensus. Such information can be valuable when working with piRNAs, in which alignment strandness is crucial to interpret the results. Then, we used RepeatCraft (Wong and Simakov 2019) with LTR_Finder v.1.2 (Xu and Wang 2007) results to merge LTRs and their respective internal regions. Subsequently, we removed all TE insertions <80 nucleotides, following the classification rule 80–80–80 (Wicker et al. 2007). Finally, we performed a last filtering step in the TE annotation to remove insertions composed of simple sequence repeats. We used Tandem Repeats Finder v.4.09 (Benson 1999) in all TE insertions from each genome, with the parameters 2, 5, 6, 75, 20, 50, 500, -m, -h, to remove TEs with masked repeats over >50% of their sequences. This method has been previously used to remove TE copies that are indistinguishable from simple repeats (Flutre et al. 2012; Oliveira et al. 2023).
TE enrichment at regulatory regions
To identify TE insertions within and nearby genes for each genome, we created BED files with the genomic positions of all insertions. Then, we created BED files for the gene regions corresponding to the 2 kb upstream of the TSS. To test whether the prevalence of TEs in each gene region was significantly higher than expected (enriched) compared with random genomic distributions of TEs in the same region of other genes, we performed permutation tests with the R package regioneR (Gel et al. 2016), with the parameter randomization = resampleRegions, with 2000 random samples. For each gene family with n genes, the number of genes with TEs was compared with other random n genes 2000 times. The n depends on the size of the HLAU gene family used in the input. For instance, the permutation test identifies how many ORs have TEs upstream out of 59 genes in total (family size). Then, another 59 genes are picked randomly, and the TE frequency is identified. This process creates a normal distribution with 2000 observations, allowing us to estimate if the number of OR genes with TEs is higher or lower than expected considering the genomic background. We also selected ZF proteins and SER as two non-HLAU gene families to compare our findings. Taking into account that TEs might harbor regulatory and/or coding motifs in both strands (Mateo et al. 2014), our analysis considered TEs within the investigated gene regions regardless of the strand.
Identification of TE-rich genomic regions
We split the genomes into bins of 200 kb, generating a BED file with such intervals across the genomes. Then, we used the function intersect from BEDtools v.2.30.0 (Quinlan and Hall 2010) to identify the number of TE insertions located in each genomic bin. Posteriorly, we merged all overlapped TE insertions into single ranges. These ranges were summed to obtain the total TE content in base pairs for each 200 kb bin. By plotting the TE content of each genome, we noticed that bins with >50 kb of TE content were outliers of the normal distribution. Therefore, we defined TE-rich regions as all bins with >50 kb of TE content, which represents 25% of the bin size. We used the same function from BEDtools to identify whether OR genes were present in the TE-rich regions or the TE-poor (bins with <50 kb of TE content).
TF binding sites on TE insertions
We assessed the identification of TFBSs with FIMO (Grant et al. 2011) from the MEME v. 5.0.5 suite tools (Bailey et al. 2015). We extracted the sequences of all TE insertions located 2 kb upstream of ORs with BEDtools v. 2.30.0, function getfasta, using the parameter -s (Quinlan and Hall 2010). We obtained the TFBS motifs described for D. melanogaster from JASPAR database (Fornes et al. 2019) for the TFs acj6, zf30c, fer1, onecut, and xbp1, which have been demonstrated to activate ORs (Jafari et al. 2012). To compare our findings with OR genes, we performed the same analysis with SER and ZF as non-HLAU gene families. Only TFBSs with P-value < 0.01 were considered. The enrichment of OR TFBSs in OR genes compared with non-HLAU gene families was assessed with the four frequencies: (1) ORs with TFBSs, (2) ORs without TFBSs, (3) non-HLAU with TFBSs, and (4) non-HLAU without TFBSs.
Differential expression of genes
We aligned the RNA-seq reads with STAR v.2.7.3 (Dobin et al. 2013), using the assembled genomes and annotations of their respective species. The alignments were used to create the count matrix reporting the expression of each gene, with HTSeq v.0.13.5 (Anders et al. 2015), with the parameters –order pos; -s reverse; –i gene; -t exon; the latter indicates that the count for each gene corresponds to the sum of all reads aligned into exons (CDSs and UTRs). We merged the counts from species of the buzzatii and mojavensis clusters separately, maintaining only ortholog genes that have at least 90% of the length of the annotated gene in the reference genome. This threshold allowed us to avoid misinterpretation of the expression level by comparing genes with different lengths. Then, we performed independent statistical analysis for species of the buzzatii and mojavensis clusters with DESeq2 v.1.28.1 (Love et al. 2014), using a single-factor experimental design, which considers only the factor that different species may have differentially expressed genes. Because of the phylogenetic distance between species of the buzzatii and mojavensis clusters, we performed the differential expression analysis separately for each group. We only considered genes with an adjusted P-value < 0.05 and |log2 fold-change| > 1 as differentially expressed. To test for association between TE enrichment and differential expression, we selected HLAU genes with the mean of normalized counts between replicates ≥100. Then, we built the contingency table to apply the X2 independence test, splitting them into four categories: differentially expressed, nondifferentially expressed, with TEs at the promoter region, and without TEs at the promoter region. We carried out the test for all pairwise analyses between cactophilic species with preference for Opuntia sp and columnar cacti. A X2 with P-value < 0.05 was considered significant. The proportional differences between localization, acceptance, and host use genes compared with non-HLAU genes (SER and ZF gene families) were assessed with a Fisher's exact test, with a contingency table containing the average number of genes per group: (1) non-HLAU differentially expressed genes, (2) non-HLAU nondifferentially expressed genes, (3) HLAU differentially expressed genes, and (4) HLAU nondifferentially expressed genes. A Fisher's exact test < 0.05 was considered significant.
Identification of gene–TE chimeric transcripts
We detected gene–TE chimeric transcripts with ChimeraTE v.2.0.0 mode 1 (Oliveira et al. 2023). Each species was analyzed using its respective genome, gene annotation, and TE annotation. Shortly, ChimeraTE identifies chimeras based on paired-end reads spanning from exons to TE sequences. Based on the TE position compared with the gene (upstream, exon, intron, downstream), chimeric transcripts are classified into categories. We have used default parameters, except –replicate 3, which considers true chimeras only those identified in the three RNA-seq replicates, and –coverage 10, used to obtain chimeras with at least 10 chimeric reads on average between replicates. To calculate the contribution of the chimeric transcript expression relative to total gene expression, we developed a new module for ChimeraTE. This module can be used downstream to ChimeraTE mode 1 analysis. In the first step, all RNA-seq replicates will be merged into a single FASTQ library. Then, the merged reads are aligned to the genome with STAR (Dobin et al. 2013). Next, StringTie2 (Kovaka et al. 2019) is used to assess transcript expression, including both reference and nonreference isoforms. All TEs generating chimeras are intersected with exons predicted by StringTie2 with PyRanges (Stovner and Sætrom 2020). Only overlaps with 80% of the TE within the exon are considered. Finally, the expression of the TE-containing isoforms is compared with the total gene expression. In our analysis, we removed all chimeric transcripts for which StringTie was not able to build the chimeric isoform. In addition, aiming to keep chimeras with putative function, we selected only the ones with a contribution ≥25%. This analysis can be reproduced with any output from ChimeraTE with the code “mode1_contrib_chimeras.py” (https://github.com/OliveiraDS-hub/ChimeraTE/blob/main/scripts/mode1_contrib_chimeras.py).
Data access
The RNA-seq data used in this work have been submitted to the NCBI BioProject database (https://www.ncbi.nlm.nih.gov/bioproject/) under accession number PRJNA1328366. The quality-control reports from ONT and RNA-seq data, the genome assemblies, and their respective gene and TE annotation (libraries and GTF files) are available at Zenodo (https://zenodo.org/records/16501018) and as Supplemental Data. The code to reproduce differential expression analysis, positive selection tests, gene annotation, permutation tests, TE annotation, and TFBS analysis are available at GitHub (https://github.com/OliveiraDS-hub/Pipelines-Cactophilic-Drosophila-Species) and as Supplemental Code.
Competing interest statement
The authors declare no competing interests.
Acknowledgments
We thank Séverine Chambeyron for useful discussions and advice. This work was performed using the computing facilities of the CC LBBE/PRABI. This study was funded by Brazilian agencies Fundação de Amparo à Pesquisa do Estado de São Paulo (FAPESP) (The São Paulo Research Foundation) (grant number 2020/06238-2) and from the National Council for Scientific and Technological Development (308020/2021-9) to C.M.A.C., by the Eiffel Fellowship Campus France (P769649C) and CAPES–PrInt (88887.716810/2022-00) to D.S.O., by Ministerio de Ciencia e Innovación (Spain; grant number PID2021-127107NB-I00) and Generalitat de Catalunya (Spain; grant number 2021 SGR 00526) to M.P.G.G., and by Udl-FAPESP ANR-IDEX-0005 to C.V. This study was financed in part by the Coordenação de Aperfeiçoamento de Pessoal de Nível Superior–Brasil (CAPES)–Finance Code 001 to D.S.O.
Author contributions: A.L., A.B., and M.P.G.G. performed experiments; F.S. performed genome assemblies; W.V.B.N. performed phylogenetic analysis; D.S.O. performed computational analysis related to genomics, transcriptomics, and statistical tests; D.S.O. wrote and edited the paper; and C.V. and C.M.A.C. designed the study, and reviewed the manuscript. All authors read, corrected, and approved the final manuscript.
Notes
[2] Supplementary material [Supplemental material is available for this article.]
[3] Article published online before print. Article, supplemental material, and publication date are at https://www.genome.org/cgi/doi/10.1101/gr.280463.125.
References
- ↵Allan CW, Matzkin LM. 2019. Genomic analysis of the four ecologically distinct cactus host populations of Drosophila mojavensis. BMC Genomics 20: 732. 10.1186/s12864-019-6097-z
- ↵Alonge M, Soyk S, Ramakrishnan S, Wang X, Goodwin S, Sedlazeck FJ, Lippman ZB, Schatz MC. 2019. RaGOO: fast and accurate reference-guided scaffolding of draft genomes. Genome Biol 20: 224. 10.1186/s13059-019-1829-6
- ↵Altschul S. 1997. Gapped BLAST and PSI-BLAST: a new generation of protein database search programs. Nucleic Acids Res 25: 3389–3402. 10.1093/nar/25.17.3389
- ↵Anders S, Pyl PT, Huber W. 2015. HTSeq—a python framework to work with high-throughput sequencing data. Bioinformatics 31: 166–169. 10.1093/bioinformatics/btu638
- ↵Aravin AA, Sachidanandam R, Girard A, Fejes-Toth K, Hannon GJ. 2007. Developmentally regulated piRNA clusters implicate MILI in transposon control. Science 316: 744–747. 10.1126/science.1142612
- ↵Arribas YA, Baudon B, Rotival M, Suárez G, Bonté P-E, Casas V, Roubert A, Klein P, Bonnin E, Mchich B, 2024. Transposable element exonization generates a reservoir of evolving and functional protein isoforms. Cell 187: 7603–7620.e22. 10.1016/j.cell.2024.11.011
- ↵Bailey TL, Johnson J, Grant CE, Noble WS. 2015. The MEME suite. Nucleic Acids Res 43: W39–W49. 10.1093/nar/gkv416
- ↵Banho CA, Mérel V, Oliveira TYK, Carareto CMA, Vieira C. 2021. Comparative transcriptomics between Drosophila mojavensis and D. arizonae reveals transgressive gene expression and underexpression of spermatogenesis-related genes in hybrid testes. Sci Rep 11: 9844. 10.1038/s41598-021-89366-2
- ↵Bao Z, Eddy SR. 2002. Automated de novo identification of repeat sequence families in sequenced genomes. Genome Res 12: 1269–1276. 10.1101/gr.88502
- ↵Baril T, Galbraith J, Hayward A. 2024. Earl Grey: a fully automated user-friendly transposable element annotation and analysis pipeline. Mol Biol Evol 41: msae068. 10.1093/molbev/msae068
- ↵Batista RA, Moreno-Romero J, Qiu Y, van Boven J, Santos-González J, Figueiredo DD, Köhler C. 2019. The MADS-box transcription factor PHERES1 controls imprinting in the endosperm by binding to domesticated transposons. eLife 8: e50541. 10.7554/eLife.50541
- ↵Benjamini Y, Hochberg Y. 1995. Controlling the false discovery rate: a practical and powerful approach to multiple testing. J R Stat Soc Ser B Methodol 57: 289–300. 10.1111/j.2517-6161.1995.tb02031.x
- ↵Benowitz KM, Coleman JM, Allan CW, Matzkin LM. 2020. Contributions of cis- and trans-regulatory evolution to transcriptomic divergence across populations in the Drosophila mojavensis larval brain. Genome Biol Evol 12: 1407–1418. 10.1093/gbe/evaa145
- ↵Benowitz KM, Allan CW, Jaworski CC, Sanderson MJ, Diaz F, Chen X, Matzkin LM. 2024. Fundamental patterns of structural evolution revealed by chromosome-length genomes of cactophilic Drosophila. Genome Biol Evol 16: evae191. 10.1093/gbe/evae191
- ↵Benson G. 1999. Tandem repeats finder: a program to analyze DNA sequences. Nucleic Acids Res 27: 573–580. 10.1093/nar/27.2.573
- ↵Bodelón A, Fablet M, Veber P, Vieira C, García Guerreiro MP. 2022. High stability of the epigenome in Drosophila interspecific hybrids. Genome Biol Evol 14: evac024. 10.1093/gbe/evac024
- ↵Bolger AM, Lohse M, Usadel B. 2014. Trimmomatic: a flexible trimmer for illumina sequence data. Bioinformatics 30: 2114–2120. 10.1093/bioinformatics/btu170
- ↵Buchfink B, Xie C, Huson DH. 2015. Fast and sensitive protein alignment using DIAMOND. Nat Methods 12: 59–60. 10.1038/nmeth.3176
- ↵Cabanettes F, Klopp C. 2018. D-GENIES: dot plot large genomes in an interactive, efficient and simple way. PeerJ 6: e4958. 10.7717/peerj.4958
- ↵Capella-Gutiérrez S, Silla-Martínez JM, Gabaldón T. 2009. trimAl: a tool for automated alignment trimming in large-scale phylogenetic analyses. Bioinformatics 25: 1972–1973. 10.1093/bioinformatics/btp348
- ↵Capy P. 2021. Taming, domestication and exaptation: trajectories of transposable elements in genomes. Cells 10: 3590. 10.3390/cells10123590
- ↵Carareto CMA, Hernandez EH, Vieira C. 2014. Genomic regions harboring insecticide resistance-associated Cyp genes are enriched by transposable element fragments carrying putative transcription factor binding sites in two sibling Drosophila species. Gene 537: 93–99. 10.1016/j.gene.2013.11.080
- ↵Chang N-C, Rovira Q, Wells J, Feschotte C, Vaquerizas JM. 2022. Zebrafish transposable elements show extensive diversification in age, genomic distribution, and developmental expression. Genome Res 32: 1408–1423. 10.1101/gr.275655.121
- ↵Chen Y, Amrein H. 2017. Ionotropic receptors mediate Drosophila oviposition preference through sour gustatory receptor neurons. Curr Biol 27: 2741–2750.e4. 10.1016/j.cub.2017.08.003
- ↵Chuong EB, Elde NC, Feschotte C. 2016. Regulatory evolution of innate immunity through co-option of endogenous retroviruses. Science 351: 1083–1087. 10.1126/science.aad5497
- ↵Cordaux R, Udit S, Batzer MA, Feschotte C. 2006. Birth of a chimeric primate gene by capture of the transposase gene from a mobile element. Proc Natl Acad Sci 103: 8101–8106. 10.1073/pnas.0601161103
- ↵Coronado-Zamora M, González J. 2023. Transposons contribute to the functional diversification of the head, gut, and ovary transcriptomes across Drosophila natural strains. Genome Res 33: 1541–1553. 10.1101/gr.277565.122
- ↵Cosby RL, Judd J, Zhang R, Zhong A, Garry N, Pritham EJ, Feschotte C. 2021. Recurrent evolution of vertebrate transcription factors by transposase capture. Science 371: eabc6405. 10.1126/science.abc6405
- ↵Crowley-Gall A, Date P, Han C, Rhodes N, Andolfatto P, Layne JE, Rollmann SM. 2016. Population differences in olfaction accompany host shift in Drosophila mojavensis. Proc Biol Sci 283: 20161562. 10.1098/rspb.2016.1562
- ↵Cultrone A, Domínguez YR, Drevet C, Scazzocchio C, Fernández-Martín R. 2007. The tightly regulated promoter of the xanA gene of Aspergillus nidulans is included in a helitron: a fungal helitron includes a regulated promoter. Mol Microbiol 63: 1577–1587. 10.1111/j.1365-2958.2007.05609.x
- ↵Daborn PJ, Yen JL, Bogwitz MR, Le Goff G, Feil E, Jeffers S, Tijet N, Perry T, Heckel D, Batterham P, 2002. A single P450 allele associated with insecticide resistance in Drosophila. Science 297: 2253–2256. 10.1126/science.1074170
- ↵Dekker T, Ibba I, Siju KP, Stensmyr MC, Hansson BS. 2006. Olfactory shifts parallel superspecialism for toxic fruit in Drosophila melanogaster sibling, D. sechellia. Curr Biol 16: 101–109. 10.1016/j.cub.2005.11.075
- ↵De Panis DN, Padró J, Furió-Tarí P, Tarazona S, Milla Carmona PS, Soto IM, Dopazo H, Conesa A, Hasson E. 2016. Transcriptome modulation during host shift is driven by secondary metabolites in desert Drosophila. Mol Ecol 25: 4534–4550. 10.1111/mec.13785
- ↵De Panis D, Dopazo H, Bongcam-Rudloff E, Conesa A, Hasson E. 2022. Transcriptional responses are oriented towards different components of the rearing environment in two Drosophila sibling species. BMC Genomics 23: 515. 10.1186/s12864-022-08745-9
- ↵Dobin A, Davis CA, Schlesinger F, Drenkow J, Zaleski C, Jha S, Batut P, Chaisson M, Gingeras TR. 2013. STAR: ultrafast universal RNA-seq aligner. Bioinformatics 29: 15–21. 10.1093/bioinformatics/bts635
- ↵Drongitis D, Aniello F, Fucci L, Donizetti A. 2019. Roles of transposable elements in the different layers of gene expression regulation. Int J Mol Sci 20: 5755. 10.3390/ijms20225755
- ↵Emera D, Casola C, Lynch VJ, Wildman DE, Agnew D, Wagner GP. 2012. Convergent evolution of endometrial prolactin expression in primates, mice, and elephants through the independent recruitment of transposable elements. Mol Biol Evol 29: 239–247. 10.1093/molbev/msr189
- ↵Emms DM, Kelly S. 2019. OrthoFinder: phylogenetic orthology inference for comparative genomics. Genome Biol 20: 238. 10.1186/s13059-019-1832-y
- ↵Etges WJ. 1993. Genetics of host-cactus response and life-history evolution among ancestral and derived populations of cactophilic Drosophila mojavensis. Evolution 47: 750–767. 10.1111/j.1558-5646.1993.tb01231.x
- ↵Faulkner GJ, Kimura Y, Daub CO, Wani S, Plessy C, Irvine KM, Schroder K, Cloonan N, Steptoe AL, Lassmann T, 2009. The regulated retrotransposon transcriptome of mammalian cells. Nat Genet 41: 563–571. 10.1038/ng.368
- ↵Fedoroff NV. 2012. Transposable elements, epigenetics, and genome evolution. Science 338: 758–767. 10.1126/science.338.6108.758
- ↵Feyereisen R. 2012. Insect CYP genes and P450 enzymes. In Insect molecular biology and biochemistry (ed. Gilbert LI), pp. 236–316. Elsevier, Amsterdam. https://linkinghub.elsevier.com/retrieve/pii/B978012384747810008X [accessed September 28, 2022].
- ↵Flutre T, Permal E, Quesneville H. 2012. Transposable element annotation in completely sequenced eukaryote genomes. In Plant transposable elements: topics in current genetics (ed. Grandbastien M-A, Casacuberta JM), Vol. 24, pp. 17–39. Springer, Berlin. https://link.springer.com/10.1007/978-3-642-31842-9_2 [accessed February 27, 2023].
- ↵Flynn JM, Hubley R, Goubert C, Rosen J, Clark AG, Feschotte C, Smit AF. 2020. RepeatModeler2 for automated genomic discovery of transposable element families. Proc Natl Acad Sci 117: 9451–9457. 10.1073/pnas.1921046117
- ↵Fogleman JC, Danielson PB. 2001. Chemical interactions in the cactus-microorganism-Drosophila model system of the sonoran Desert1. Am Zool 41: 877–889. 10.1668/0003-1569(2001)041[0877:CIITCM]2.0.CO;2
- ↵Fogleman JC, Heed WB, Kircher HW. 1982. Drosophila mettleri and senita cactus alkaloids: fitness measurements and their ecological significance. Comp Biochem Physiolt A: Physiol 71: 413–417. 10.1016/0300-9629(82)90427-3
- ↵Fonseca PM, Moura RD, Wallau GL, Loreto ELS. 2019. The mobilome of Drosophila incompta, a flower-breeding species: comparison of transposable element landscapes among generalist and specialist flies. Chromosome Res 27: 203–219. 10.1007/s10577-019-09609-x
- ↵Forbes AA, Devine SN, Hippee AC, Tvedte ES, Ward AKG, Widmayer HA, Wilson CJ. 2017. Revisiting the particular role of host shifts in initiating insect speciation. Evolution 71: 1126–1137. 10.1111/evo.13164
- ↵Fornes O, Castro-Mondragon JA, Khan A, van der Lee R, Zhang X, Richmond PA, Modi BP, Correard S, Gheorghe M, Baranašić D, 2019. JASPAR 2020: update of the open-access database of transcription factor binding profiles. Nucleic Acids Res 48: 87–92. 10.1093/nar/gkz1001
- ↵Gabriel L, Brůna T, Hoff KJ, Ebel M, Lomsadze A, Borodovsky M, Stanke M. 2024. BRAKER3: fully automated genome annotation using RNA-seq and protein evidence with GeneMark-ETP, AUGUSTUS, and TSEBRA. Genome Res 34: 769–777. 10.1101/gr.278090.123
- ↵Gel B, Díez-Villanueva A, Serra E, Buschbeck M, Peinado MA, Malinverni R. 2016. Regioner: an R/Bioconductor package for the association analysis of genomic regions based on permutation tests. Bioinformatics 32: 289–291. 10.1093/bioinformatics/btv562
- ↵Gill RA, Scossa F, King GJ, Golicz AA, Tong C, Snowdon RJ, Fernie AR, Liu S. 2021. On the role of transposable elements in the regulation of gene expression and subgenomic interactions in crop genomes. CRC Crit Rev Plant Sci 40: 157–189. 10.1080/07352689.2021.1920731
- ↵Goldman-Huertas B, Mitchell RF, Lapoint RT, Faucher CP, Hildebrand JG, Whiteman NK. 2015. Evolution of herbivory in Drosophilidae linked to loss of behaviors, antennal responses, odorant receptors, and ancestral diet. Proc Natl Acad Sci 112: 3026–3031. 10.1073/pnas.1424656112
- ↵Gomez GA. 2003. Transpecific polymorphisms in an inversion linked esterase locus in Drosophila buzzatii. Mol Biol Evol 20: 410–423. 10.1093/molbev/msg051
- ↵Gomez-Diaz C, Martin F, Garcia-Fernandez JM, Alcorta E. 2018. The two main olfactory receptor families in Drosophila, ORs and IRs: a comparative approach. Front Cell Neurosci 12: 253. 10.3389/fncel.2018.00253
- ↵Grant CE, Bailey TL, Noble WS. 2011. FIMO: scanning for occurrences of a given motif. Bioinformatics 27: 1017–1018. 10.1093/bioinformatics/btr064
- ↵Guillén Y, Rius N, Delprat A, Williford A, Muyas F, Puig M, Casillas S, Ràmia M, Egea R, Negre B, 2015. Genomics of ecological adaptation in cactophilic Drosophila. Genome Biol Evol 7: 349–366. 10.1093/gbe/evu291
- ↵Guio L, Vieira C, González J. 2018. Stress affects the epigenetic marks added by natural transposable element insertions in Drosophila melanogaster. Sci Rep 8: 12197. 10.1038/s41598-018-30491-w
- ↵Gupta S, Gallavotti A, Stryker GA, Schmidt RJ, Lal SK. 2005. A novel class of Helitron-related transposable elements in maize contain portions of multiple pseudogenes. Plant Mol Biol 57: 115–127. 10.1007/s11103-004-6636-z
- ↵Harigaya Y, Parker R. 2010. No-go decay: a quality control mechanism for RNA in translation. Wiley Interdiscip Rev RNA 1: 132–141. 10.1002/wrna.17
- ↵Hasson E, Naveira H, Fontdevila A. 1992. The breeding sites of the argentinian species of the Drosophila mulleri complex (subgenus Drosophila-repleta group). Rev Chil Hist Nat 65: 319–326.
- ↵Hasson E, De Panis D, Hurtado J, Mensch J. 2019. Host plant adaptation in cactophilic species of the Drosophila buzzatii cluster: fitness and transcriptomics. J Heredity 110: 46–57. 10.1093/jhered/esy043
- ↵Havens JA, Etges WJ. 2013. Premating isolation is determined by larval rearing substrates in cactophilic Drosophila mojavensis. IX. Host plant and population specific epicuticular hydrocarbon expression influences mate choice and sexual selection. J Evol Biol 26: 562–576. 10.1111/jeb.12073
- ↵Hickner PV, Rivaldi CL, Johnson CM, Siddappaji M, Raster GJ, Syed Z. 2016. The making of a pest: insights from the evolution of chemosensory receptor families in a pestiferous and invasive fly, Drosophila suzukii. BMC Genomics 17: 648. 10.1186/s12864-016-2983-9
- ↵Howard DJ, Berlocher SH. 1998. Endless forms: species and speciation (ed. Howard DJ, Berlocher SH). Oxford University Press, New York.
- ↵Howard RW, Blomquist GJ. 2005. Ecological, behavioral, and biochemical aspects of the insect hydrocarbons. Annu Rev Entomol 50: 371–393. 10.1146/annurev.ento.50.071803.130359
- ↵Hu J, Fan J, Sun Z, Liu S. 2020. NextPolish: a fast and efficient genome polishing tool for long-read assembly. Bioinformatics 36: 2253–2255. 10.1093/bioinformatics/btz891
- ↵Huang K, Li C-F, Wu J, Wei J-H, Zou Y, Han M-J, Zhou Z-Y. 2016. Enhancer activity of Helitron in sericin-1 gene promoter from Bombyx mori: enhancer activity of Helitrons in sericin-1. Insect Sci 23: 396–405. 10.1111/1744-7917.12347
- ↵Hug N, Longman D, Cáceres JF. 2016. Mechanism and regulation of the nonsense-mediated decay pathway. Nucleic Acids Res 44: 1483–1495. 10.1093/nar/gkw010
- ↵Jafari S, Alkhori L, Schleiffer A, Brochtrup A, Hummel T, Alenius M. 2012. Combinatorial activation and repression by seven transcription factors specify Drosophila odorant receptor expression. PLoS Biol 10: e1001280. 10.1371/journal.pbio.1001280
- ↵Kapusta A, Kronenberg Z, Lynch VJ, Zhuo X, Ramsay L, Bourque G, Yandell M, Feschotte C. 2013. Transposable elements are major contributors to the origin, diversification, and regulation of vertebrate long noncoding RNAs. PLoS Genet 9: e1003470. 10.1371/journal.pgen.1003470
- ↵Katoh K, Standley DM. 2013. MAFFT multiple sequence alignment software version 7: improvements in performance and usability. Mol Biol Evol 30: 772–780. 10.1093/molbev/mst010
- ↵Kim BY, Wang JR, Miller DE, Barmina O, Delaney E, Thompson A, Comeault AA, Peede D, D'Agostino ERR, Aguilar JM, 2021. Highly contiguous assemblies of 101 drosophilid genomes. eLife 10: 33. 10.7554/eLife.66405
- ↵Knolhoff LM, Heckel DG. 2014. Behavioral assays for studies of host plant choice and adaptation in herbivorous insects. Annu Rev Entomol 59: 263–278. 10.1146/annurev-ento-011613-161945
- ↵Kolmogorov M, Yuan J, Lin Y, Pevzner PA. 2019. Assembly of long, error-prone reads using repeat graphs. Nat Biotechnol 37: 540–546. 10.1038/s41587-019-0072-8
- ↵Kovaka S, Zimin AV, Pertea GM, Razaghi R, Salzberg SL, Pertea M. 2019. Transcriptome assembly from long-read RNA-seq alignments with StringTie2. Genome Biol 20: 278. 10.1186/s13059-019-1910-1
- ↵Kristensen DM, Wolf YI, Mushegian AR, Koonin EV. 2011. Computational methods for gene orthology inference. Brief Bioinformatics 12: 379–391. 10.1093/bib/bbr030
- ↵Krumsiek J, Arnold R, Rattei T. 2007. Gepard: a rapid and sensitive tool for creating dotplots on genome scale. Bioinformatics 23: 1026–1028. 10.1093/bioinformatics/btm039
- ↵Lang M, Murat S, Clark AG, Gouppil G, Blais C, Matzkin LM, Guittard É, Yoshiyama-Yanagawa T, Kataoka H, Niwa R, 2012. Mutations in the neverland gene turned Drosophila pachea into an obligate specialist species. Science 337: 1658–1661. 10.1126/science.1224829
- ↵Li H. 2018. Minimap2: pairwise alignment for nucleotide sequences. Bioinformatics 34: 3094–3100. 10.1093/bioinformatics/bty191
- ↵Li H, Handsaker B, Wysoker A, Fennell T, Ruan J, Homer N, Marth G, Abecasis G, Durbin R, 1000 Genome Project Data Processing Subgroup. 2009. The Sequence Alignment/Map format and SAMtools. Bioinformatics 25: 2078–2079. 10.1093/bioinformatics/btp352
- ↵Li Z, Gilbert C, Peng H, Pollet N. 2024. Discovery of numerous novel Helitron-like elements in eukaryote genomes using HELIANO. Nucleic Acids Res 52: e79. 10.1093/nar/gkae679
- ↵Lipatov M, Lenkov K, Petrov DA, Bergman CM. 2005. Paucity of chimeric gene-transposable element transcripts in the Drosophila melanogaster genome. BMC Biol 3: 24. 10.1186/1741-7007-3-24
- ↵Lippman Z, Gendrel A-V, Black M, Vaughn MW, Dedhia N, Richard McCombie W, Lavine K, Mittal V, May B, Kasschau KD, 2004. Role of transposable elements in heterochromatin and epigenetic control. Nature 430: 471–476. 10.1038/nature02651
- ↵Love MI, Huber W, Anders S. 2014. Moderated estimation of fold change and dispersion for RNA-seq data with DESeq2. Genome Biol 15: 550. 10.1186/s13059-014-0550-8
- ↵Mansourian S, Stensmyr MC. 2015. The chemical ecology of the fly. Curr Opin Neurobiol 34: 95–102. 10.1016/j.conb.2015.02.006
- ↵Marin P, Jaquet A, Picarle J, Fablet M, Merel V, Delignette-Muller M-L, Ferrarini MG, Gibert P, Vieira C. 2021. Phenotypic and transcriptomic responses to stress differ according to population geography in an invasive species. Genome Biol Evol 13: evab208. 10.1093/gbe/evab208
- ↵Markow TA. 1991. Sexual isolation among populations of Drosophila mojavensis. Evolution 45: 1525–1529. 10.1111/j.1558-5646.1991.tb02656.x
- ↵Markow TA. 2019. Host use and host shifts in Drosophila. Curr Opin Insect Sci 31: 139–145. 10.1016/j.cois.2019.01.006
- ↵Mateo L, Ullastres A, González J. 2014. A transposable element insertion confers xenobiotic resistance in Drosophila. PLoS Genet 10: e1004560. 10.1371/journal.pgen.1004560
- ↵Mateus RP, Nazario-Yepiz NO, Ibarra-Laclette E, Ramirez Loustalot-Laclette M, Markow TA. 2019. Developmental and transcriptomal responses to seasonal dietary shifts in the cactophilic Drosophila mojavensis of North America. J Heredity 110: 58–67. 10.1093/jhered/esy056
- ↵Matsuo T, Sugaya S, Yasukawa J, Aigaki T, Fuyama Y. 2007. Odorant-binding proteins OBP57d and OBP57e affect taste perception and host-plant preference in Drosophila sechellia. PLoS Biol 5: e118. 10.1371/journal.pbio.0050118
- ↵Matzkin LM. 2008. The molecular basis of host adaptation in cactophilic Drosophila: molecular evolution of a glutathione S-transferase gene (GstD1) in Drosophila mojavensis. Genetics 178: 1073–1083. 10.1534/genetics.107.083287
- ↵Matzkin LM. 2012. Population transcriptomics of cactus host shifts in Drosophila mojavensis. Mol Ecol 21: 2428–2439. 10.1111/j.1365-294X.2012.05549.x
- ↵Matzkin L, Markow TA. 2013. Transcriptional differentiation across the four subspecies of Drosophila mojavensis. In Speciation: natural processes, genetics and biodiversity (ed. Michalak P), pp. 119–135. Nova Scientific Publishers, New York.
- ↵McBride CS. 2007. Rapid evolution of smell and taste receptor genes during host specialization in Drosophila sechellia. Proc Natl Acad Sci 104: 4996–5001. 10.1073/pnas.0608424104
- ↵McBride CS, Arguello JR. 2007. Five Drosophila genomes reveal nonneutral evolution and the signature of host specialization in the chemoreceptor superfamily. Genetics 177: 1395–1416. 10.1534/genetics.107.078683
- ↵McKenzie SK, Kronauer DJC. 2018. The genomic architecture and molecular evolution of ant odorant receptors. Genome Res 28: 1757–1765. 10.1101/gr.237123.118
- ↵Mérel V, Gibert P, Buch I, Rodriguez Rada V, Estoup A, Gautier M, Fablet M, Boulesteix M, Vieira C. 2021. The worldwide invasion of Drosophila suzukii is accompanied by a large increase of transposable element load and a small number of putatively adaptive insertions. Mol Biol Evol 38: 4252–4267. 10.1093/molbev/msab155
- ↵Merenciano M, Aguilera L, González J. 2023. Two-step CRISPR-Cas9 protocol for transposable element deletion in D. melanogaster natural populations. STAR Protoc 4: 102501. 10.1016/j.xpro.2023.102501
- ↵Minh BQ, Schmidt HA, Chernomor O, Schrempf D, Woodhams MD, von Haeseler A, Lanfear R. 2020. IQ-TREE 2: new models and efficient methods for phylogenetic inference in the genomic era. Mol Biol Evol 37: 1530–1534. 10.1093/molbev/msaa015
- ↵Montell C. 2009. A taste of the Drosophila gustatory receptors. Curr Opin Neurobiol 19: 345–353. 10.1016/j.conb.2009.07.001
- ↵Moreyra NN, Almeida FC, Allan C, Frankel N, Matzkin LM, Hasson E. 2023. Phylogenomics provides insights into the evolution of cactophily and host plant shifts in Drosophila. Mol Phylogenet Evol 178: 107653. 10.1016/j.ympev.2022.107653
- ↵Newby BD, Etges WJ. 1998. Host preference among populations of Drosophila mojavensis (Diptera: Drosophilidae) that use different host cacti. J Insect Behav 11: 691–712. 10.1023/A:1022398809881
- ↵Ni L. 2021. The structure and function of ionotropic receptors in Drosophila. Front Mol Neurosci 13: 638839. 10.3389/fnmol.2020.638839
- ↵O'Grady PM, Markow TA. 2012. Rapid morphological, behavioral, and ecological evolution in Drosophila: comparisons between the endemic Hawaiian Drosophila and the cactophilic repleta species group. In Rapidly evolving genes and genetic systems (ed. Singh RS, .), pp. 176–186. Oxford University Press, New York.
- ↵Oliveira DCSG, Almeida FC, O'Grady PM, Armella MA, DeSalle R, Etges WJ. 2012. Monophyly, divergence times, and evolution of host plant use inferred from a revised phylogeny of the Drosophila repleta species group. Mol Phylogenet Evol 64: 533–544. 10.1016/j.ympev.2012.05.012
- ↵Oliveira DS, Fablet M, Larue A, Vallier A, Carareto CMA, Rebollo R, Vieira C. 2023. ChimeraTE: a pipeline to detect chimeric transcripts derived from genes and transposable elements. Nucleic Acids Res 51: 9764–9784. 10.1093/nar/gkad671
- ↵Pal D, Patel M, Boulet F, Sundarraj J, Grant OA, Branco MR, Basu S, Santos SDM, Zabet NR, Scaffidi P, 2023. H4k16ac activates the transcription of transposable elements and contributes to their cis-regulatory function. Nat Struct Mol Biol 30: 935–947. 10.1038/s41594-023-01016-5
- ↵Pfeiler E, Castrezana S, Reed LK, Markow TA. 2009. Genetic, ecological and morphological differences among populations of the cactophilic Drosophila mojavensis from southwestern USA and northwestern Mexico, with descriptions of two new subspecies. J Nat Hist 43: 923–938. 10.1080/00222930802610535
- ↵Platt RN, Blanco-Berdugo L, Ray DA. 2016. Accurate transposable element annotation is vital when analyzing new genome assemblies. Genome Biol Evol 8: 403–410. 10.1093/gbe/evw009
- ↵Price AL, Jones NC, Pevzner PA. 2005. De novo identification of repeat families in large genomes. Bioinformatics 21: i351–i358. 10.1093/bioinformatics/bti1018
- ↵Pritham EJ, Feschotte C. 2007. Massive amplification of rolling-circle transposons in the lineage of the bat Myotis lucifugus. Proc Natl Acad Sci 104: 1895–1900. 10.1073/pnas.0609601104
- ↵Quinlan AR, Hall IM. 2010. BEDTools: a flexible suite of utilities for comparing genomic features. Bioinformatics 26: 841–842. 10.1093/bioinformatics/btq033
- ↵Raffaele S, Farrer RA, Cano LM, Studholme DJ, MacLean D, Thines M, Jiang RHY, Zody MC, Kunjeti SG, Donofrio NM, 2010. Genome evolution following host jumps in the Irish potato famine pathogen lineage. Science 330: 1540–1543. 10.1126/science.1193070
- ↵Rajpurohit S, Oliveira CC, Etges WJ, Gibbs AG. 2013. Functional genomic and phenotypic responses to desiccation in natural populations of a desert drosophilid. Mol Ecol 22: 2698–2715. 10.1111/mec.12289
- ↵Rane RV, Clarke DF, Pearce SL, Zhang G, Hoffmann AA, Oakeshott JG. 2019. Detoxification genes differ between cactus-, fruit-, and flower-feeding Drosophila. J Heredity 110: 80–91. 10.1093/jhered/esy058
- ↵Rice P, Longden I, Bleasby A. 2000. EMBOSS: the European molecular biology open software suite. Trends Genet 16: 276–277. 10.1016/S0168-9525(00)02024-2
- ↵Romero-Soriano V, Burlet N, Vela D, Fontdevila A, Vieira C, García Guerreiro MP. 2016. Drosophila females undergo genome expansion after interspecific hybridization. Genome Biol Evol 8: 556–561. 10.1093/gbe/evw024
- ↵Ruiz A, Heed WB. 1988. Host-plant specificity in the cactophilic Drosophila mulleri species complex. J Anim Ecol 57: 237. 10.2307/4775
- ↵Rundle HD, Nosil P. 2005. Ecological speciation. Ecol Lett 8: 336–352. 10.1111/j.1461-0248.2004.00715.x
- ↵Sanchez-Flores A, Peñaloza F, Carpinteyro-Ponce J, Nazario-Yepiz N, Abreu-Goodger C, Machado CA, Markow TA. 2016. Genome evolution in three species of cactophilic Drosophila. G3 (Bethesda) 6: 3097–3105. 10.1534/g3.116.033779
- ↵Savković U, Đorđević M, Vlajnić L, Budečević S, Stojković B. 2023. Evolution of developmental plasticity and the potential of host shift in the seed beetle: insights from laboratory evolution experiments. Ecol Entomol 48: 307–316. 10.1111/een.13222
- ↵Schmidt D, Schwalie PC, Wilson MD, Ballester B, Gonçalves Â, Kutter C, Brown GD, Marshall A, Flicek P, Odom DT. 2012. Waves of retrotransposon expansion remodel genome organization and CTCF binding in multiple mammalian lineages. Cell 148: 335–348. 10.1016/j.cell.2011.11.058
- ↵Shumate A, Salzberg SL. 2021. Liftoff: accurate mapping of gene annotations. Bioinformatics 37: 1639–1643. 10.1093/bioinformatics/btaa1016
- ↵Simão FA, Waterhouse RM, Ioannidis P, Kriventseva EV, Zdobnov EM. 2015. BUSCO: assessing genome assembly and annotation completeness with single-copy orthologs. Bioinformatics 31: 3210–3212. 10.1093/bioinformatics/btv351
- ↵Smit AFA. 2004. RepeatMasker Open 3.0. http://www.repeatmasker.org.
- ↵Steffen R, Ogoniak L, Grundmann N, Pawluchin A, Soehnlein O, Schmitz J. 2022. paPAML: an improved computational tool to explore selection pressure on protein-coding sequences. Genes (Basel) 13: 1090. 10.3390/genes13061090
- ↵Stennett MD, Etges WJ. 1997. Premating isolation is determined by larval rearing substrates in cactophilic Drosophila mojavensis. III. Epicuticular hydrocarbon variation is determined by use of different host plants in Drosophila mojavensis and Drosophila arizonae. J Chem Ecol 23: 2803–2824. 10.1023/A:1022519228346
- ↵Stintzing FC, Carle R. 2005. Cactus stems (Opuntia spp.): a review on their chemistry, technology, and uses. Mol Nutr Food Res 49: 175–194. 10.1002/mnfr.200400071
- ↵Storer J, Hubley R, Rosen J, Wheeler TJ, Smit AF. 2021. The Dfam community resource of transposable element families, sequence models, and genome annotations. Mob DNA 12: 2. 10.1186/s13100-020-00230-y
- ↵Stovner EB, Sætrom P. 2020. PyRanges: efficient comparison of genomic intervals in Python. Bioinformatics 36: 918–919. 10.1093/bioinformatics/btz615
- ↵Sundaram V, Cheng Y, Ma Z, Li D, Xing X, Edge P, Snyder MP, Wang T. 2014. Widespread contribution of transposable elements to the innovation of gene regulatory networks. Genome Res 24: 1963–1976. 10.1101/gr.168872.113
- ↵Sutherland TD, Unnithan GC, Andersen JF, Evans PH, Murataliev MB, Szabo LZ, Mash EA, Bowers WS, Feyereisen R. 1998. A cytochrome P450 terpenoid hydroxylase linked to the suppression of insect juvenile hormone synthesis. Proc Natl Acad Sci 95: 12884–12889. 10.1073/pnas.95.22.12884
- ↵Suyama M, Torrents D, Bork P. 2006. PAL2NAL: robust conversion of protein sequence alignments into the corresponding codon alignments. Nucleic Acids Res 34: W609–W612. 10.1093/nar/gkl315
- ↵Thomas J, Phillips CD, Baker RJ, Pritham EJ. 2014. Rolling-circle transposons catalyze genomic innovation in a mammalian lineage. Genome Biol Evol 6: 2595–2610. 10.1093/gbe/evu204
- ↵Tijet N, Helvig C, Feyereisen R. 2001. The cytochrome P450 gene superfamily in Drosophila melanogaster: annotation, intron-exon organization and phylogeny. Gene 262: 189–198. 10.1016/S0378-1119(00)00533-3
- ↵Vanderlinde T, Dupim EG, Nazario-Yepiz NO, Carvalho AB. 2019. An improved genome assembly for Drosophila navojoa, the basal species in the mojavensis cluster. J Heredity 110: 118–123. 10.1093/jhered/esy059
- ↵van't Hof AE, Campagne P, Rigden DJ, Yung CJ, Lingley J, Quail MA, Hall N, Darby AC, Saccheri IJ. 2016. The industrial melanism mutation in British peppered moths is a transposable element. Nature 534: 102–105. 10.1038/nature17951
- ↵Vaser R, Sović I, Nagarajan N, Šikić M. 2017. Fast and accurate de novo genome assembly from long uncorrected reads. Genome Res 27: 737–746. 10.1101/gr.214270.116
- ↵Vasudevan S, Peltz SW, Wilusz CJ. 2002. Non-stop decay—a new mRNA surveillance pathway. Bioessays 24: 785–788. 10.1002/bies.10153
- ↵Wang J, Lunyak VV, Jordan IK. 2012. Genome-wide prediction and analysis of human chromatin boundary elements. Nucleic Acids Res 40: 511–529. 10.1093/nar/gkr750
- ↵Whisson SC, Vetukuri RR, Avrova AO, Dixelius C. 2012. Can silencing of transposons contribute to variation in effector gene expression in Phytophthora infestans? Mob Genet Elements 2: 110–114. 10.4161/mge.20265
- ↵Whiteman NK, Pierce NE. 2008. Delicious poison: genetics of Drosophila host plant preference. Trends Ecol Evol (Amst) 23: 473–478. 10.1016/j.tree.2008.05.010
- ↵Wicker T, Sabot F, Hua-Van A, Bennetzen JL, Capy P, Chalhoub B, Flavell A, Leroy P, Morgante M, Panaud O, 2007. A unified classification system for eukaryotic transposable elements. Nat Rev Genet 8: 973–982. 10.1038/nrg2165
- ↵Williams-Simon PA, Posey C, Mitchell S, Ng'oma E, Mrkvicka JA, Zars T, King EG. 2019. Multiple genetic loci affect place learning and memory performance in Drosophila melanogaster. Genes Brain Behav 18: e12581. 10.1111/gbb.12581
- ↵Wong WY, Simakov O. 2019. RepeatCraft: a meta-pipeline for repetitive element de-fragmentation and annotation. Bioinformatics 35: 1051–1052. 10.1093/bioinformatics/bty745
- ↵Wright CR, William S. 2014. Characterization of volatiles of necrotic Stenocereus thurberi and Opuntia littoralis and toxicity and olfactory preference of Drosophila melanogster, D. mojavensis wrigleyi, and D. mojavensis sonorensis to necrotic cactus volatiles. Nat Prod Commun 9: 1185–1192.
- ↵Wu K, Zhang J, Zhang Q, Zhu S, Shao Q, Clark KD, Liu Y, Ling E. 2015. Plant phenolics are detoxified by prophenoloxidase in the insect gut. Sci Rep 5: 16823. 10.1038/srep16823
- ↵Xie M, Hong C, Zhang B, Lowdon RF, Xing X, Li D, Zhou X, Lee HJ, Maire CL, Ligon KL, 2013. DNA hypomethylation within specific transposable element families associates with tissue-specific enhancer landscape. Nat Genet 45: 836–841. 10.1038/ng.2649
- ↵Xu Z, Wang H. 2007. LTR_FINDER: an efficient tool for the prediction of full-length LTR retrotransposons. Nucleic Acids Res 35: W265–W268. 10.1093/nar/gkm286
- ↵Yang Z. 2007. PAML 4: phylogenetic analysis by maximum likelihood. Mol Biol Evol 24: 1586–1591. 10.1093/molbev/msm088
- ↵Ye M, Goudot C, Hoyler T, Lemoine B, Amigorena S, Zueva E. 2020. Specific subfamilies of transposable elements contribute to different domains of T lymphocyte enhancers. Proc Natl Acad Sci 117: 7905–7916. 10.1073/pnas.1912008117
- ↵Zidi M, Klai K, Confais J, Chénais B, Caruso A, Denis F, Khemakhem MM, Casse N. 2022. Genome-wide screening of transposable elements in the Whitefly, Bemisia tabaci (Hemiptera: Aleyrodidae), revealed insertions with potential insecticide resistance implications. Insects 13: 396. 10.3390/insects13050396
- ↵Zouros E, d'Entremont CJ. 1980. Sexual isolation among populations of Drosophila mojavensis: response to pressure from a related species. Evolution 34: 421–430. 10.1111/j.1558-5646.1980.tb04830.x