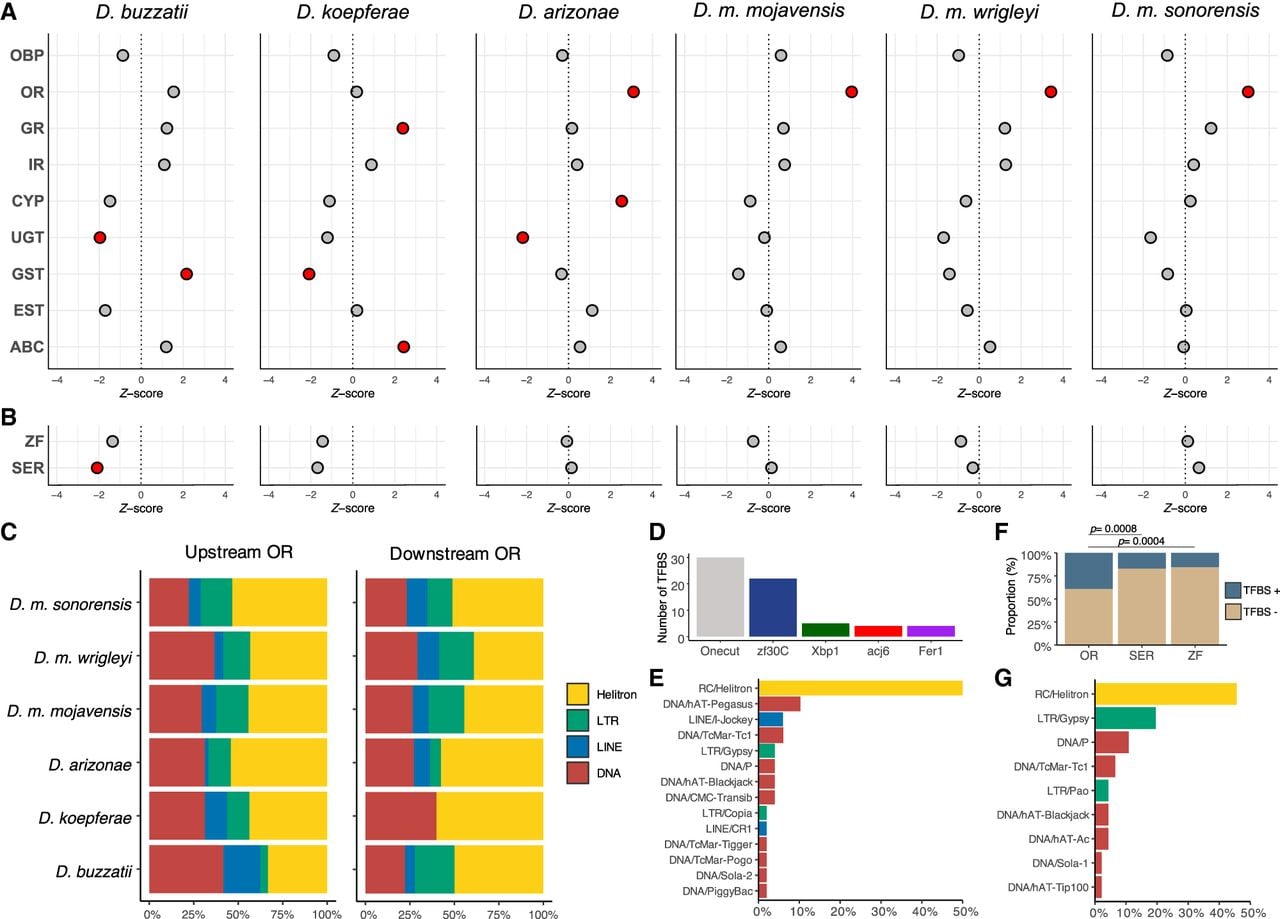
Enrichment of TEs in HLAU genes. (A) Enrichment of TEs in the promoter region (2 kb upstream) of the HLAU gene families. Z-score > 0 indicates enrichment, and Z-score < 0 indicates depletion. Red dots indicate P-value < 0.05; gray dots, P-value > 0.05. (B) The same enrichment analysis as depicted in A, but for non-HLAU gene families, represented by zinc-finger proteins (ZF) and serine/threonine kinases (SER). (C) Proportion of TE orders located upstream and downstream ORs. (D) Transcription factor binding site (TFBS) frequency on TEs located upstream of OR genes in all species under study. (E) Proportional frequency of TE families with TFBSs embedded in their sequences from TE copies located upstream of OR genes. (F) Significant Fisher's exact test between OR genes with OR-related TFBSs from TE insertions compared with the frequency observed in the non-HLAU gene families SER and ZF. (G) Proportion of TE orders carrying OR-related TFBSs in non-HLAU gene families.