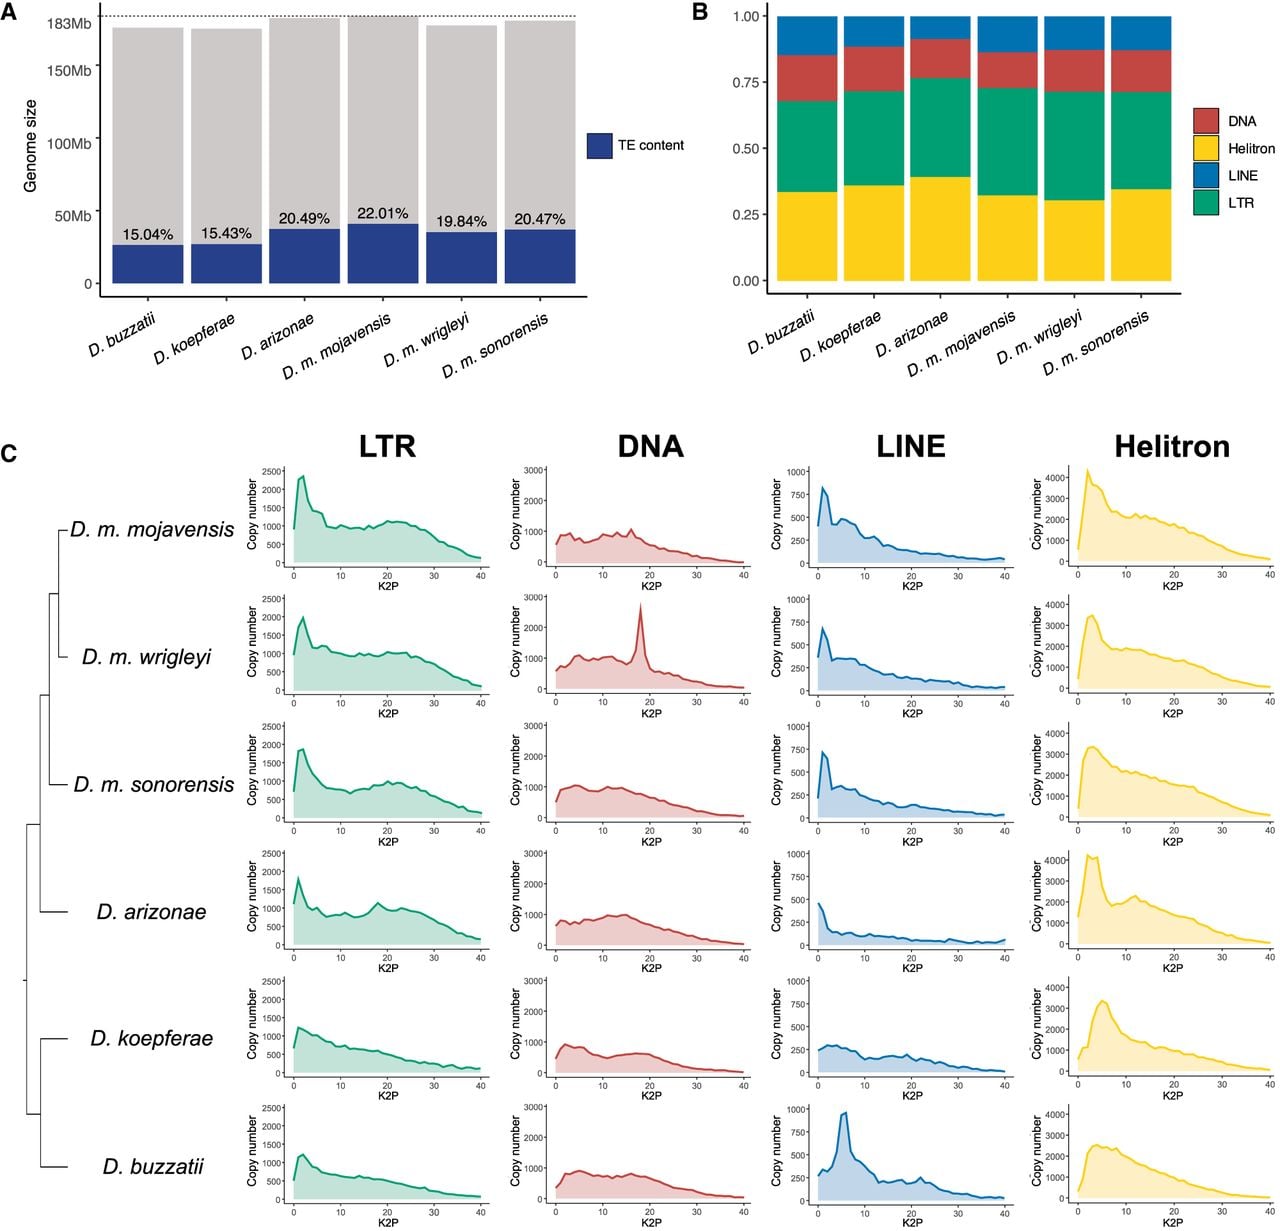
TE annotation in the six genomes of the cactophilic Drosophila species. (A) Genome size of the six cactophilic Drosophila species sequenced in this work, and their respective TE content (blue). (B) Proportional distribution of the total TE content in the genomes. (C) Phylogenetic relationship among species (adapted from Matzkin 2008; Oliveira et al. 2012), alongside TE order landscapes representing total copy number (y-axis) and the divergence of TE insertions compared with the consensuses (x-axis), based on the Kimura two-parameter (K2P) model corrected with CpG. The copies located on the left of the graph have low divergence with their respective consensus, hence inferring that they might be conserved/recent/active, whereas copies on the right side represent copies with high divergence owing to the accumulation of mutations, corresponding to old/inactive copies.