
The oligogenic inheritance test GCOD detects risk genes and their interactions in congenital heart defects
- Maureen Pittman1,2,6,
- Kihyun Lee1,3,6,
- Franco Felix1,
- Yu Huang1,
- Adrienne Lam1,
- Mauro W. Costa1,
- Deepak Srivastava1,4 and
- Katherine S. Pollard1,2,5
- 1Gladstone Institutes, San Francisco, California 94158, USA;
- 2Department of Epidemiology and Biostatistics, University of California, San Francisco, California 94158, USA;
- 3College of Pharmacy, Ewha Womans University, Seoul 03760, Republic of Korea;
- 4Department of Pediatrics, University of California, San Francisco, California 94158, USA;
- 5Chan Zuckerberg Biohub, San Francisco, California 94158, USA
-
↵6 These authors contributed equally to this work.
Abstract
Exome sequencing of thousands of families has revealed many risk genes for congenital heart defects (CHDs), yet most cases cannot be explained by a single causal mutation. Even within the same family, individuals carrying a particular mutation in a known risk gene often demonstrate variable phenotypes, suggesting the presence of genetic modifiers. To explore oligogenic causes of CHD without assessing billions of variant combinations, we develop an efficient, simulation-based method to detect gene sets that carry co-occurring damaging variants in probands at a higher rate than expected given parental genotypes. We implement this approach in software called Gene Combinations in Oligogenic Disease (GCOD) and apply it to a cohort of 3377 CHD trios with exome sequencing. This analysis detects 160 gene pairs in which damaging variants are transmitted with higher-than-expected frequency to CHD probands but rarely or never appear in combination in their unaffected parents. Stratifying by specific phenotypes and considering gene combinations of higher orders yields an additional 6026 gene sets. Genes found in oligogenic sets are overrepresented in pathways related to heart development and often co-occur in sets of cell type marker genes from single-cell expression data. Compound heterozygosity of the newly identified digenic pair Gata6–Por leads to higher CHD incidence in mice compared with single hemizygotes, validating predicted genetic interactions. As genome sequencing is applied to more families and other disorders, GCOD will enable detection of increasingly large, novel gene combinations, shedding light on combinatorial causes of genetic diseases.
Many diseases are genetically heterogeneous such that damaging variants at different genetic loci can lead to a common phenotype (Veenstra-Vanderweele et al. 2004; Akhirome et al. 2017). Complex genetic architecture has impeded our ability to identify causal variants and genes, despite increasingly large cohorts with exome or whole-genome sequencing. For instance, multigenerational family studies have found that some types of congenital heart defects (CHDs) have heritability estimates of 70%–90% (Cripe et al. 2004; McBride et al. 2005; Hinton et al. 2007; Pierpont et al. 2018), but just 9% of probands have a damaging variant in a monogenic CHD gene that is not shared by an unaffected family member (Sierant et al. 2025). This indicates that although most defects can be explained in large part by patient genetics, our current knowledge is insufficient to pinpoint the full genetic origin of most individual cases. In addition to environmental factors, unexplained cases presumably involve damaging variants in splice sites or regulatory regions, as well as cryptic risk genes that lack statistical evidence of association. The latter can occur owing to incomplete penetrance and variable expressivity of gene lesions, in which carriers differ in the presence and severity of disease symptoms (Janku et al. 1980; Parker and Landstrom 2021; Kingdom and Wright 2022). A potential explanation for these phenomena is oligogenic inheritance, or a type of inheritance in which a few variants are required in combination to cause a particular phenotype (Kousi and Katsanis 2015).
Previous work has validated an instance of oligogenic inheritance in CHD (Gifford et al. 2019), as well as speculated a role for oligogenic inheritance in other developmental disorders like autism spectrum disorder (Schaaf et al. 2011; Wenger et al. 2016). Although these studies discovered specific disease-causing gene and variant combinations, they relied on known risk genes and existing functional information to propose testable hypotheses. Alternatively, one could enumerate and prioritize all damaging variant combinations in an automated and statistically rigorous manner. But this strategy is complicated by combinatorial explosion: Given that each human genome typically contains 40,000 to 200,000 variants at <0.5% minor allele frequency (MAF) (The 1000 Genomes Project Consortium 2015), an analysis of all possible rare variant pairs yields between 8 billion to nearly 20 trillion combinations per individual, necessitating a priori identification of a limited set of test loci at the variant level (Cordell 2009). Even aggregating variants in order to test pairwise gene-by-gene combinations necessitates very large sample sizes, although this can be mitigated by the use of parental controls in trio studies (Gauderman 2002).
Despite these difficulties, there are existing methods that scan the genome for possible oligogenic disease combinations. ORVAL accepts a small list of variants as input and provides gene and variant annotations to a predictor that assesses potential oligogenic combinations (Renaux et al. 2019; Versbraegen et al. 2023). Similarly, the high-throughput oligogenic prioritizer (Hop) identifies potential oligogenic combinations from more extensive whole-exome sequencing (WES) variant data and incorporates phenotype ontology information (Gravel et al. 2024). However, these tools only offer oligogenic hypotheses for individuals without leveraging information from other sequenced patients. In contrast, the Digenic method aggregates rare variants at the gene level across a disease cohort and assesses the statistical significance of each gene pair based on its prevalence (Kerner et al. 2020), although this method is limited to oligogenic combinations of only two genes. RareComb is another software that tests at the cohort level, identifying gene combinations found at greater frequency in cases compared with controls (Pounraja and Girirajan 2022). Neither of these cohort methods incorporates parental sequencing data, which are especially useful in reducing false positives found as a result of population stratification (Schaid and Sommer 1994; Ewens 1999). It logically follows that the highest-effect causal variants are likely transmitted separately from each unaffected parent or include at least one de novo mutation; thus, incorporating parental transmission data is potentially a powerful tool to reduce false positives, increase confidence in the phenotypic relevance of variants, and correct for population structure.
To address this gap, we developed the tool Gene Combinations in Oligogenic Disease (GCOD), an algorithmic framework that uses simulation experiments to identify disease gene sets that carry rare damaging variants significantly more often than expected given parental genotypes. In this study, we demonstrate the robustness and efficiency of GCOD, applying it to whole exomes to identify and assess sets of genes with co-occurring rare variants in CHD.
Results
Computational identification of pathogenic gene sets
We developed an algorithm to predict pathogenic gene sets using exome or whole-genome sequencing data and implemented it in software entitled GCOD. The method involves four main steps (Fig. 1): select variants of interest based on predicted pathogenicity or other criteria, enumerate sets of genes with co-occurring variants, count the number of proband carriers of each gene set, and evaluate the statistical significance of gene set co-occurrence counts given the parental genotypes. An optional fifth step repeats the process for healthy siblings or pseudosiblings (Yu and Deng 2011) as a control. GCOD can be viewed as an extension of the transmission disequilibrium test (TDT), in which the unit being tested is an observed co-occurrence of variants in a group of genes, rather than observed transmissions at a single genomic location (Spielman et al. 1993) or within a single gene (He et al. 2017). Details and options for each step of GCOD follow.
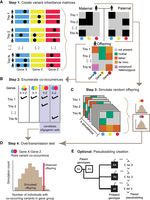
The GCOD approach identifies sets of genes that interact in oligogenic disease. (A) Step 1. Users submit a list of variants of interest or define criteria for some level of “rare” or “predicted damaging.” These variants are summarized in two binary gene-by-trio matrices that denote whether at least one damaging allele was present in each of the maternal and paternal genomes, as well as an offspring matrix that encodes damaging variant presence and provenance. The variant(s) in each gene can be only maternally derived, only paternally derived, compound heterozygous, or de novo. (B) Step 2. From the offspring matrix, GCOD enumerates the candidate sets of genes for which variants occur in multiple probands, including only combinations not transmitted from a single parent. (C) Step 3. An offspring is created from the genotypes of each pair of parents over a minimum of 10,000 simulated cohorts, yielding a distribution of simulated co-occurrence counts for each candidate set. (D) Step 4. For a given candidate set, the simulated distribution is compared to the observed number in cohort probands to compute a P-value. (E) Optionally, GCOD derives pseudosibling genotypes from the parental alleles not transmitted to the proband for comparative analysis.
First, users provide a list of damaging variants meeting some criteria of interest from each individual in the data set (Fig. 1A). GCOD then enumerates all combinations of genes that contain co-occurring damaging variants in each proband (Fig. 1B), retaining only those combinations observed in multiple families (referred to as “candidate sets”). By changing the definition of damaging, different scenarios can be explored, from small gene sets with very rare co-occurring variants of high impact to larger gene sets that include small-effect, possibly damaging variants that could modify the effects of other primary disease-causing variant(s) or otherwise contribute to a polygenic signal.
Here we use the terms “oligogenic transmission” and “oligogenic inheritance” to describe an event in which qualifying variants were inherited separately from both parents or include a de novo mutation, such that an unaffected parent did not also carry that same combination of variants. The count of observed oligogenic transmissions of the gene set to probands is the test statistic. GCOD provides two options for gene set testing, assessing either all digenic pairs observed in multiple probands (“pairs” mode) or including larger gene sets (“highest-order” mode). To reduce the number of tested hypotheses when possible, the “highest-order” algorithm first considers all digenic pairs and merges these up to the largest gene candidate set observed among a unique group of probands. For example, two probands carrying damaging variants in seven genes share 21 unique gene pairs, 35 unique gene trios, and so on (Supplemental Fig. 1). If no other probands carry co-occurring variants in two or more genes of the set, GCOD's highest-order mode tests only the seven-gene set, while considering none of the 119 other lower-order combinations. But if a third proband carries qualifying variants in four of those seven genes, that gene quartet (with a count of three carriers) is also considered a “highest-order” candidate and is tested along with the seven-gene set (with a count of two carriers). The algorithm efficiently checks for additional transmissions of gene subsets, identifying and producing a co-occurrence count for all highest-order candidate sets.
In the third step, GCOD performs simulations based on parental genotypes under the assumption that joint variant inheritance has no relationship to disease phenotype (Fig. 1C). In each iteration, one hypothetical offspring is simulated for each parental pair as follows. We assume that damaging parental variants have a 50% chance of being passed to the simulated offspring and model different genes independently (for caveats, see Discussion). After simulating inherited variants, GCOD simulates de novo variants using previous estimates of per-gene de novo mutation probabilities (Samocha et al. 2014). Using one simulated child from each family in the cohort, we tally the number of times a given gene set was transmitted with oligogenic inheritance.
In the fourth step, the offspring simulation is repeated over many iterations to generate a null distribution of expected transmission counts, which is compared with that observed among probands. We calculate the probability of no overtransmission for each candidate gene set as the proportion of iterations with a simulated count equal to or greater than the number of probands (Fig. 1D). GCOD returns the full list of candidate sets along with the P-values associated with their transmission to probands. Multiple testing corrections are then applied (for details, see Methods; for caveats, see Discussion). We refer to the resulting statistically significant gene sets as “oligogenic sets.”
In an optional fifth step, GCOD repeats this entire procedure for sibling controls. If healthy siblings have been sequenced, these may be used. Otherwise, GCOD generates a genotype for a pseudosibling of each proband, a hypothetical sibling who has inherited the parental alleles that were not transmitted to the affected individual (Fig. 1E; Yu and Deng 2011). Siblings, unlike pseudosiblings, carry some variants inherited by the proband. They also can be assessed for the phenotype, whereas pseudosiblings cannot. Siblings without a diagnosis and pseudosiblings are typically presumed to be unaffected, although this is not always true; siblings must be deeply phenotyped past the typical age of onset to rule out disease, and pseudosiblings have unknown phenotypes. With these caveats in mind, it can be helpful to consider both types of controls when available. Users can exclude any significant candidate sets that also appear in (pseudo-)siblings. To assess overall evidence that a phenotype is likely oligogenic, users can explore whether probands carry more overtransmitted gene sets compared with (pseudo-)siblings.
Comparison of resource use and type-I error rate
We first compared GCOD to a multilocus generalization of the TDT (mTDT), which ran efficiently but yielded no significantly overtransmitted gene sets, despite only testing pairs observed at least twice as in GCOD (Supplemental Table S1). We therefore focused on two other software tools that use variant data from multi-individual data sets to find gene combinations statistically associated with a given phenotype. Digenic is a two-locus variant aggregation test that identifies gene or variant combinations using WES data and can be run using case-only data (Kerner et al. 2020). RareComb identifies pairs and higher-order combinations of genes enriched for co-occurring variants in cases but not controls (Pounraja and Girirajan 2022). To benchmark these three approaches, we leveraged WES of 3377 trios composed of a CHD proband and their unaffected parents, which were previously sequenced by the Pediatric Cardiac Genomics Consortium (PCGC) (Pediatric Cardiac Genomics Consortium 2013; Hoang et al. 2018; Morton et al. 2021) (obtained from the NCBI database of Genotypes and Phenotypes [dbGaP; https://dbgap.ncbi.nlm.nih.gov/home/] under accession number phs000571.v7.p3). To evaluate the type-I error for each method, we estimated the false-positive rate (FPR) using gene combinations based on three expected-null variant sets: rare proband synonymous variants, rare damaging proband nonsynonymous variants in which the identities of the carriers are randomly shuffled, and rare damaging pseudosibling variants with CADD scores in the top 0.5% exome-wide. In addition to FPR, we also assessed runtime and peak memory usage for each method (Fig. 2).
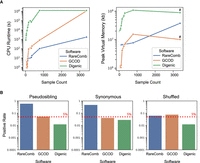
GCOD efficiently evaluates oligogenic gene sets while limiting type-I errors. (A) CPU runtime (left) and peak RAM usage (right) of GCOD and two other cohort-based oligogenic discovery software tools. Analyses were completed for the full PCGC cohort as well as smaller subdiagnoses of CHD, providing a range of sample sizes (x-axes). Across a range of sample sizes, GCOD's runtime is slower than RareComb's but faster than Digenic's, becoming equivalent to Digenic for the full cohort of 3377 trios (left). Peak memory usage is lower for GCOD compared with the other methods at most sample sizes (right). We note that peak memory, unlike CPU time, does not sum across multiple parallel threads; this explains the drop for peak memory in GCOD and digenic at higher cohort sizes, which were parallelized (indicated by # for parallelized runs). (B) Type-I error rate of the three methods, using pseudosibling variants with CADD scores in the top 0.5% exome-wide (left), proband synonymous variants (center), and variants with shuffled family IDs (right) as controls. GCOD controls the false-positive rate at ∼5% (dashed line), whereas Digenic is relatively conservative and RareComb is anticonservative.
We found that GCOD runs notably faster than Digenic at cohort sizes up to 1000 but takes the same amount of time on the full cohort of 3377 trios (Fig. 2A). RareComb runs the fastest at cohort sizes greater than about 100 individuals. GCOD's peak memory usage is lower than the other methods at most cohort sizes, with Digenic requiring the most RAM. These results establish that GCOD has intermediate computational performance.
In terms of statistical performance, GCOD performed the best. It controls the FPR very close to the targeted 5% level, with only 5.5% of pseudosibling, 4.2% of synonymous, and 7.9% of shuffled candidate groups found to be overtransmitted (Fig. 2B). This indicates an excellent balance of power and type-I error control. Digenic also controls the FPR but is more conservative (FPR: 1.3% pseudosibling, 2.8% synonymous, 1.3% shuffled). As a consequence, when run on nonsynonymous proband variants, GCOD identifies functionally validated gene pairs (see below), whereas Digenic does not. In contrast, RareComb is anticonservative and does not reliably control type-I error (FPR: 62% pseudosibling, 48% synonymous, 6.5% shuffled). Because RareComb relies on control genotypes, our findings indicate that using parents as controls with this method could lead to false discoveries.
CHD probands carry more oligogenic sets than familial controls
When we examined exonic variants in PCGC trios, we found that among the 227 probands with predicted-damaging de novo variants in a gene known to cause CHD in humans or mice (Richter et al. 2020), a majority (88%) inherited a predicted-damaging variant in at least one other known CHD gene (Supplemental Table S2). Given the high heritability estimates of CHD and the fact that even the relatively small number of patients with known, highly penetrant variants carry additional mutations likely to contribute to the phenotype, we hypothesized that we would find evidence of oligogenic inheritance in CHD. We applied GCOD to the rare variants (MAF < 0.05) from PCGC trio exomes and used parental data to compute pseudosibling genotypes for each trio (Fig. 1E; Supplemental Methods; Yu and Deng 2011).
We ran GCOD at three tiers of variant severity (Supplemental Table S3), defined by nucleotide-level characteristics such as MAF and CADD score (Rentzsch et al. 2019), as well as gene-level constraint metrics like gnomAD observed-expected z-score (Karczewski et al. 2020) and shet score (Cassa et al. 2017), and minimum expression level in relevant cell types (Cao et al. 2020). The strict tier includes only very rare mutations with a high probability of impairing protein function, whereas the base tier uses a more lenient cutoff scheme of the same metrics to include more candidate variants of potential interest. The CADD-based tier considers any variant predicted to be in the top 0.5% most damaging single-nucleotide variants in the genome (Rentzsch et al. 2019). Only oligogenic transmissions of a variant set were considered. To reduce false positives caused by a single driver gene with spurious cotransmitted partners, we additionally filtered oligogenic sets to those with a logistic regression interaction coefficient greater than 1.0 (Supplemental Methods).
The GCOD approach revealed 160 oligogenic gene pairs comprising 270 putative CHD risk genes at Benjamini–Hochberg FDR ≤ 0.01 (Supplemental Table S4). At each variant tier, we identified more oligogenic gene pairs in CHD probands compared with their pseudosiblings (Fig. 3A) and synonymous variants (Supplemental Fig. 2). These differences were all statistically significant (FDR-corrected binomial P ≤ 0.0001). At the strict tier, for example, we found 71 gene pairs overtransmitted to probands, a nearly fourfold excess compared with 19 gene pairs overtransmitted to their pseudosiblings (Table 1). Oligogenic pairs are present in a substantial number of probands, with 4% of PCGC probands carrying at least one pair at the strict tier and ∼8% with more lenient tiers included.
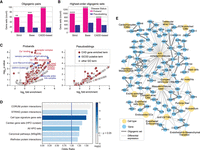
Greater number and phenotypic relevance of co-occurring gene sets in CHD probands. (A) Counts of gene pairs that were transmitted to offspring more often than expected by chance. Oligogenic pairs were found among probands at a greater rate than their pseudosibling controls for all three variant severity cutoffs, with asterisks indicating significance level: FDR-corrected P-value, (****) P ≤ 1 × 10⁻¹⁰, (***) P ≤ 1 × 10⁻⁵, (**) P ≤ 1 × 10⁻³). (B) Counts of highest-order oligogenic sets transmitted more often than expected by chance to probands and pseudosiblings. Highest-order gene sets were found among probands at a greater rate than their pseudosibling controls, with asterisks indicating significance as in A. (C) GO term enrichment of genes in CHD oligogenic pairs found in probands (left) and pseudosibling controls (right). GO terms are plotted based on fold enrichment and the inverse log of Fisher's exact test P-value. Point color indicates whether a GO term was enriched for known CHD genes or was enriched at or above marginal significance for genes in proband oligogenic pairs (indicated by the dotted line at FDR < 0.1), but not enriched for known CHD genes. Pseudosibling set genes were not enriched for any GO terms at or above marginal significance (FDR = 0.1). (D) Odds that at least two genes in an oligogenic set (pairs and highest-order) occurred in CHD probands and co-occur in a canonical gene set, pathway, or protein–protein interaction. Color indicates the inverse log P-value of the odds ratio (Fisher's exact test). (HPO) Human Phenotype Ontology. (E) Network visualization of oligogenic sets containing two or more differentially expressed genes (circular nodes) identified together in at least one cardiac cell type (octagonal nodes), sourced from six studies. Thin edges indicate differential expression of a gene within the cell type compared with other study cell populations; bold edges between gene nodes indicate genes that were discovered together in a GCOD oligogenic set. (CMs) Cardiomyocytes, (ECs) endothelial cells; (A/V) atrial/ventricular, (AHF) anterior heart field, (OFT) outflow tract, (RV) right ventricle.
GCOD counts of significantly overtransmitted oligogenic pairs and genes, categorized by membership to the list of 744 curated human and mouse CHD genes (Richter et al. 2020)
We also computed the highest-order gene sets shared among PCGC probands at each examined tier of variant severity. Highest-order sets ranged from groups of two genes to groups of 12 genes for both probands and pseudosiblings. As with gene pairs, we find a significantly greater count of overtransmitted sets in probands compared to pseudosiblings (all Bonferroni-corrected binomial P < 1 × 10⁻¹⁰) (Fig. 3B; Supplemental Table S5). In addition to the hypothesis-free approach described above, GCOD includes the option to analyze only gene combinations containing one or more user-defined candidate genes. We tested combinations of genes in the Wnt signaling pathway and the TGF-beta signaling pathway, finding seven additional oligogenic pairs composed solely of genes in these signaling pathways (Supplemental Table S6).
We next investigated whether the oligogenic pairs identified in PCGC probands include any novel CHD genes previously unidentified in smaller data sets and single-gene tests. First, we annotated which oligogenic sets contained one or more of the 744 curated human or mouse CHD genes (Richter et al. 2020). Although more than one-third (38.8%) of proband oligogenic pairs contain at least one of these CHD genes, the vast majority of risk genes captured by GCOD were not previously known (229 of 270 genes) (Table 1). In other words, GCOD identifies sets comprising a mix of previously known and unknown genes, in which many novel potential modifier genes were overtransmitted in combination with a smaller subset of known CHD genes. We compared these findings with the results of a traditional single-gene rare variant TDT (Supplemental Methods; Supplemental Table S7). Because of a lack of significant results after multiple testing correction, we examined genes reaching significance at unadjusted P-values, nevertheless yielding threefold fewer risk genes compared with GCOD. Furthermore, GCOD's results include over fourfold more known CHD genes (41 compared to nine) (Table 1).
The genes in GCOD-identified oligogenic pairs, including the majority not previously associated with heart defects, showed significantly higher expression in the developing heart (as determined in embryonic mouse hearts at E14.5) (Zaidi et al. 2013) compared with all expressed genes, on average at the 60th percentile (Supplemental Fig. 3A). However, similar to known CHD genes, our new GCOD candidates are not restricted to being active in heart development and show broad expression across cell types and tissues. Based on data from the Protein Atlas (Uhlén et al. 2015; Karlsson et al. 2021), both known CHD genes and GCOD oligogenic genes demonstrate lower tissue specificity (Supplemental Fig. 3B) and are detected more often in many or all cell types (Supplemental Fig. 3C) compared with all gene products. Consistent with this broad activity, many GCOD known and novel candidate CHD genes are developmental transcription factors (22 in oligogenic pairs, 269 in highest order sets), which are less likely to be expressed in a tissue-specific manner compared with their targets (Sonawane et al. 2017).
In summary, GCOD identifies gene combinations transmitted more often than expected to probands, many of which include known disease genes as well as novel genes with similar patterns of expression. These findings underscore the additional signal GCOD is able to capture by collectively considering genes that tend to have rare variation together in probands, inherited separately from healthy parents.
Genes within proband oligogenic sets are found together in canonical cardiac gene sets
To further test whether the CHD oligogenic pairs identified by GCOD comprise phenotype-relevant genes, we performed a Gene Ontology (GO) analysis. Oligogenic genes were marginally overrepresented in cellular processes related to heart development, such as atrioventricular node development (GO:0003162) and heart trabecula morphogenesis (GO:0061384; FDR < 0.1) (Fig. 3C), as well as components generally related to cell signaling and differentiation, like receptor complex (GO:0043235) (Basson 2012) and extracellular matrix (GO:0031012) (Walma and Yamada 2020). In contrast, no GO terms were overrepresented by pseudosibling genes, supporting their utility as controls.
To provide further context for the cellular mechanisms and components implicated by GCOD, the curated set of genes previously identified as CHD-causal (Richter et al. 2020) was analyzed for enrichment of GO terms, finding a total of 1019 enriched terms at FDR ≤ 0.05 (Fig. 3C; Supplemental Table S8). These terms include those directly relevant to cardiogenesis and cellular differentiation, as well as terms with distinct functions but overlapping genes. We additionally noted terms that were not enriched for known CHD genes but were marginally enriched for oligogenic pair genes as discovered by GCOD (Fig. 3C). This includes actin filament binding (GO:0051015), important in cellular motility and therefore embryonic development (Pollard and Borisy 2003), and clathrin-coated pits (GO:0005905), which are a key avenue for endocytosis and were previously linked to developmental signaling (Seto et al. 2002; Robinson 2015) and heart defects (Arrigo and Lin 2021). Although few of these genes were discovered in screens of highly penetrant monogenic perturbations, our results suggest that genes related to clathrin-coated pit formation can contribute to CHD phenotypes in combination with each other or with other CHD-causing genes. The remaining novel terms, stereocilia ankle-link complex (GO:0002142) and sensory perception of light stimulus (GO:0050953), contain genes associated with cell adhesion, a process with broad importance across organogenesis (Baldwin and Buck 1994).
The GO analysis above combines oligogenic sets to find common functions among all putative risk genes. We further hypothesized that genes within the same oligogenic set are more likely to be physically and/or functionally associated. To test this, we calculated the odds of an oligogenic combination being found in probands (as opposed to pseudosiblings) and co-occurring in canonical pathways, canonical gene sets, and protein–protein interactions (Fig. 3D).
GCOD-identified oligogenic sets (including pairs and highest-order gene sets) were found to comprise proteins with evidence of physical interactions more than expected, based on data from the STRING (Szklarczyk et al. 2021) and iRefIndex (Razick et al. 2008) databases (Fisher's exact test P-value < 0.05 for both sets). In contrast, co-occurrences in the CORUM database of protein complexes (Steinkamp et al. 2025) were not significant; however, a relatively high odds ratio (OR) of 1.6 suggests a potential association that we are underpowered to detect owing to the smaller number of confirmed protein complexes (Fig. 3D). In total, there are 676 unique physical protein interactions in the CORUM, STRING, and iRefIndex databases (Razick et al. 2008; Szklarczyk et al. 2021; Steinkamp et al. 2025) that contain at least two genes in a GCOD set (Supplemental Table S9).
To test whether genes within an oligogenic group tend to appear together in canonical pathways, regulatory gene–target interactions, and ontology terms, we downloaded several subcollections of gene sets from the Molecular Signatures Database (MSigDB) (Subramanian et al. 2005). For each collection tested, up to several hundred gene sets are included; if at least two genes within an oligogenic set (“partners”) appear together in one or more of these canonical gene sets (e.g., a single pathway or ontology term), this is considered a co-occurrence (Fig. 3D). We found significant co-occurrence of GCOD oligogenic gene partners in cell type signature gene sets (OR = 1.5, Fisher's exact test P = 0.00004), canonical pathways (OR = 1.3, Fisher's exact test P = 0.039), and the Human Phenotype Ontology (HPO) as a whole (OR = 1.3, Fisher's exact test P = 0.003), as well as HPO gene sets related to heart phenotypes (OR = 1.4, Fisher's exact test P = 0.036). In contrast, we did not find significant enrichment for MSigDB transcription factor target sets, hallmark gene sets, or GO sets (Supplemental Fig. 4).
Significant co-occurrence within protein–protein interactions and canonical pathways indicates that the interaction (direct or indirect) of oligogenic set gene products could be relevant to disease pathogenesis. We noted a particularly strong pattern of co-occurrence among cell type signature gene sets, such that genes within CHD oligogenic groups tended to appear together as markers of particular cell clusters in single-cell expression data (Fig. 3D).
We sought to further explore this signal of cell type relevance specifically in the heart. We downloaded lists of differentially expressed genes (DEGs) of cell clusters from single-cell RNA-seq data collected during and after heart development from six sources, including adult human hearts with no cardiac disease (Tucker et al. 2020), mice hearts collected at various time points ranging from embryonic day E7.75 to E16.5 (Li et al. 2016a; Xiao et al. 2018; de Soysa et al. 2019; Goodyer et al. 2019), and hearts from human embryos ranging from 5 to 25 weeks of gestation (Cui et al. 2019). We included a total of 140 wild-type DEG sets, defined across contexts ranging from all the major cell populations of the heart, to more specific subclusters like those distinguishing atrial compact cells from atrial trabecular cells. As expected, genes in CHD oligogenic sets were more likely to be differentially expressed in at least one cardiac cell type compared to the full set of human protein-coding genes (two-sample z-proportion test, z = 2.28, P = 0.01). The network of GCOD oligogenic sets in which multiple genes appeared together in a DEG set are shown in Figure 3E, with blue nodes connected by bold edges indicating genes together in a CHD oligogenic set, and thin edges connecting genes to yellow nodes of cell type clusters in which they were differentially expressed. The specific experimental context of each of the depicted cell type clusters is summarized in Supplemental Table S10.
Diagnosis-specific risk gene interactions
Although up to this point we have analyzed oligogenic transmission frequency across the entirety of the exomes of 3377 trios in the PCGC, these probands were assessed to have myriad distinct diagnoses. To explore the possibility that similar phenotypes are caused by more similar genetic etiology, we selected several categories of CHD diagnoses to analyze separately with GCOD (Table 2). We chose six diagnoses with relatively consistent phenotypic criteria and a sample size of at least 50 probands: pulmonary atresia with intact ventricular septum (PA-IVS), truncus arteriosus (TA), tetralogy of Fallot (TOF), heterotaxy, and hypoplastic left heart syndrome (HLHS), as well as the subset of HLHS patients with both mitral atresia and aortic atresia (HLHS-MA-AA). We also curated five broader categories of CHD presentation, for example, septation defects and valvulopathies. A breakdown of which Fyler diagnoses (Béland et al. 2002) were included in each CHD category is found in Supplemental Table S11.
List of CHD subdiagnoses and categories with respective sample size of trios analyzed in this study
Several probands are included in multiple diagnostic categories. For example, a proband with a semilunar valvular defect is necessarily also included within the valvulopathy analysis, the latter category of which also includes PA-IVS. Furthermore, an individual might present with multiple distinct phenotypes like TA in combination with heterotaxy. Even so, we hypothesized that analyses at varying scales of phenotypic homogeneity might better detect oligogenic sets that are specific to one or a few diagnoses but do not replicate in the entire cohort and might furthermore implicate specific genes and pathways in particular stages of heart development and the formation of specific physiological structures.
Counts of oligogenic sets in phenotypically similar subgroups corroborated our finding from the full cohort that probands harbor significantly more oligogenic sets compared to pseudosiblings (Fig. 4A). Many of these sets were found in the full PCGC data set analysis, but we find 4022 additional unique diagnosis-specific oligogenic sets among the 11 diagnoses in the strict, base, and CADD-based variant severity analyses (Supplemental Table S12). Many of these were found in the largest diagnostic categories, like valvulopathies and septation defects. However, even at the strict level, we detect the oligogenic pair CAPN9-MGA transmitted to just two of 52 individuals with PA-IVS (FDR = 0.0004). The gene CAPN9 has been associated previously with Noonan syndrome, which often presents with pulmonary valve stenosis and occasionally PA-IVS (Digilio and Marino 2001; Linglart and Gelb 2020). Our findings suggest the possibility of CAPN9 involvement in the formation of the pulmonary valve along with the transcription factor MGA (Qin et al. 2021).
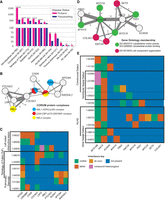
Oligogenic sets in CHDs. (A) Counts of oligogenic pairs by CHD diagnosis. (B) Network visualization of genes in oligogenic sets containing one or more of the genes coding for members of AML1-HIPK2-p300 complex, p300-CBP-p270-SWI/SNF complex, or RBL2 complex. Node color indicates a gene product's inclusion within a protein complex, and edge width and labels indicate the number of probands with co-occurring mutations in each gene pair. Nonannotated edges represent a co-occurrence count of two probands. (C) Variant inheritance matrix for genes in B. Columns indicate genes, and rows indicate probands that harbor damaging mutations in each gene. Cell color represents the parental or de novo provenance of a proband's variant(s) in the specified gene column. Multiple probands sharing a diagnosis are indicated by black boxes. (D) Network visualization of interconnected oligogenic sets, centered on the MYO18B-SACS digenic pair. Node color indicates a gene's association with a GO term. (E) Variant inheritance matrix for genes in D among carriers of the MYO18B-SACS combination.
Previous research has shown a relationship between heterotaxy (left-right patterning defects that often affect the heart) and digenic combinations of variants in DNAH6 with primary ciliary dyskinesia (PCD) genes. From sequencing data, Li et al. (2016b) found that five of six individuals with heterotaxy and carrying a DNAH6 mutation also carried a heterozygous mutation in another PCD gene. Using a list of 51 PCD genes as curated previously (Zariwala et al. 2007; Li et al. 2016b), GCOD did not find significant overtransmission of these combinations in our broad CHD-wide analysis of the 3377 PCGC trios. However, in a diagnosis-specific analysis of 266 patients with heterotaxy, and including rare variants previously filtered by pathogenicity prediction-based cutoffs, GCOD identified several combinations of PCD genes (Supplemental Table S13): DNAH6–DNAH11 (three probands, Benjamini–Hochberg FDR = 0.006), DNAH5–DNAH6 (two probands, Benjamini–Hochberg FDR = 0.046), and CCDC40–DNAH8 (two probands, Benjamini–Hochberg FDR = 0.049). The DNAH5–DNAH6 digenic pair was previously assayed in zebrafish, wherein the combination of two heterozygous mutations led to heterotaxy (Li et al. 2016b).
Similarly, a recent study among CHD patients with laterality defects predicted the contribution of 22 digenic pairs using a predetermined set of genes with known disease variants (Rai et al. 2025). Using more lenient variant pathogenicity criteria among specific diagnosis subgroups as above, GCOD replicated four of these gene pairs with additional modifier genes (Supplemental Table S14). For example, the predicted digenic pair CFAP46–DNAH11 was found by GCOD in higher-order interactions among probands with septation defects, in one case a gene quad including cilia gene CROCC2 and regulator of DNA demethylation PROSER1 (FDR = 0.01), and a quintet with cell adhesion gene DCC, cytoskeletal matrix gene NEB, and known CHD gene RYR2 (FDR = 0.004). In a broader analysis of 3910 PCGC patients, a study using case-control burden testing predicted an additional 29 digenic pairs in CHD (Kars et al. 2025). GCOD identified two of these predicted digenic pairs and found higher-order gene sets containing an additional 11 predicted digenic pairs (Supplemental Table S14).
These findings demonstrate GCOD's ability to replicate functionally validated gene combinations as well as predictions from complementary methods. It also underscores the utility of analyzing homogenous phenotypes and sets of genes larger than pairs.
Overlap of oligogenic sets with known protein complexes
We cross-referenced canonical protein complexes sourced from the CORUM database (Steinkamp et al. 2025) with our oligogenic sets from the combined PCGC cohort (Supplemental Tables S4, S5) and from separate diagnoses (Supplemental Table S12), finding 11 unique proband oligogenic sets in which two or more genes are known to physically interact in a protein complex. For example, the products of the CREBBP and EP300 genes participate in the p300-CBP-p270-SWI/SNF complex (protein subunit symbols: EP300, CREBBP, ARID1A, SMARCA4, SMARCB1, SMARCC1, SMARCC2) and regulate histone acetyltransferase activity during development (Dallas et al. 1998; Chan and La Thangue 2001). Variants in these genes were transmitted oligogenically to two individuals in combination with the COL6A3 gene (COL6A3–CREBBP–EP300, two probands with valvulopathies, FDR = 0.007). Variants in these three genes were also overtransmitted independently with other genes, which led to the discovery of a network of interconnected oligogenic sets that collectively harbor multiple hits to three protein complexes: AML1-HIPK2-p300 (protein subunit symbols: RUNX1, HIPK2, EP300), RBL2 complex (protein subunit symbols: E2F4, E2F5, EP300, HDAC1, RBL2, SUV39H1), and p300-CBP-p270-SWI/SNF (Fig. 4B; Supplemental Methods).
EP300 co-occurs with RUNX1 in the AML1-HIPK2-p300 complex, and although the digenic pair is observed in one unaffected parent, the highest-order oligogenic set including MYO9A from an alternate source is only observed in CHD probands, both diagnosed with pulmonary stenosis (EP300-MYO9A-RAD54L2-RUNX1, two probands with valvar pulmonary stenosis, FDR = 0.0002) (Fig. 4C). The protein product of RUNX1 (previously known as AML1) forms a complex with the products of EP300 and CREBBP to activate transcription and cell differentiation (Kitabayashi et al. 1998; Aikawa et al. 2006). The co-occurrence of oligogenically transmitted variants in multiple combinations of transcriptional regulators and chromatin modifiers suggests that they interact (either directly or indirectly) in gene regulatory networks that are necessary for normal heart development. Genes not annotated with these functions, such as COL6A3 and MYO9A, could be target genes or have upstream or downstream regulatory functions. For example, the fibrillar collagen gene COL6A3 has a role in TGF-beta signaling as previously characterized in cancers (Huang et al. 2018; Dankel et al. 2020). Given the involvement of TGF-beta signaling in epithelial–mesenchymal transformations in cardiovascular development (Azhar et al. 2003) and its coactivation by the CBP/p300 complex (Janknecht et al. 1998), co-occurring mutations in COL6A3, CREBBP, and EP300 could be pathogenic owing to perturbation of this pathway.
Notably, 12 probands carried predicted-damaging variants in both the MYO18B gene and the SACS gene, which encode for the myosin-18B and sacsin proteins, respectively (FDR = 0.002) (Fig. 4D). Ten of these observations were oligogenic transmissions in which the variants did not co-occur in an unaffected parent (Fig. 4E). The other two probands inherited MYO18B-SACS from their respective mothers but additionally inherited mutations in KCNH6 from the fathers, therefore comprising an oligogenic set of three genes (Fig. 4E). Other genes found to be significantly overtransmitted with MYO18B and SACS are shown, including several involved in cytoskeletal motor activity and protein binding, as well as organization of cellular components generally (Fig. 4D). We additionally identified three oligogenic sets containing the SACS gene with a dynein axonemal heavy-chain gene: DNAH2–SACS, DNAH7–FBN2–SACS, and DNAH9–SACS. We conclude that there is an underappreciated role for the SACS gene in heart development, likely related to the organization and activity of structural proteins. Specifically, as MYO18B is known to organize thick and thin filaments in the sarcomere (Berger et al. 2017), SACS could play a similar or upstream/downstream role of filament organization in the heart, such that reduced function in both proteins leads to CHD. This is consistent with previous research indicating that sacsin regulates filament assembly, although this was determined in neurofilaments (Gentil et al. 2019).
Interaction of GATA6 and POR in humans and mice during cardiac development
Among the hundreds of putative oligogenic gene sets prioritized by GCOD, we were particularly interested in those involving known CHD genes with prior evidence of being influenced by genetic modifiers. One such example comes from a family study in which a mutation in the known CHD gene GATA6 was transmitted from a father to two daughters. One daughter presented with TA, whereas the father and the other daughter exhibited only milder phenotypes, such as pulmonary stenosis and atrial septal defects (ASDs) (Kodo et al. 2009). TA pathology is consistent with malfunction of normal neural crest cell migration during formation of the outflow tract (Neeb et al. 2013). When Gata6 deletion was tested in mice in neural crest cell–specific manner, TA was only observed when both alleles of Gata6 were deleted, which further indicates that its haploinsufficiency is an incomplete explanation for TA (Lepore et al. 2006). Moreover, GATA6 mutations have been shown to be associated with diverse types of cardiac and pancreatic defects in human populations (Maitra et al. 2010; Allen et al. 2012; Wang et al. 2012), suggesting that mutations in additional genes could cause variable expressivity of phenotypes in patients.
We were therefore particularly interested in the GATA6–POR oligogenic pair identified by GCOD, which was found in three PCGC probands with TA. POR encodes P450 oxidoreductase, an enzyme that transfers electrons from NADPH to cytochrome P450 enzymes (Miller 2005). Por-null mice exhibit embryonic lethality (Shen et al. 2002; Otto et al. 2003), and severe missense mutations to POR (p.A287P in European ancestry and p.R457H in Japanese ancestry) cause Antley–Bixler syndrome (ABS), a skeletal malformation disorder inherited in an autosomal recessive manner (Miller et al. 2011). Notably, one study found that CHD occurred in 21% of ABS cases (Oh et al. 2017), suggesting a previously underrecognized role for POR in heart development. Given the involvement of POR in retinoic acid (RA) metabolism through CYP26 (Zlotnik et al. 2022) and given the importance of RA signaling in outflow tract and neural crest formation (Li et al. 2010; Keyte and Hutson 2012), we hypothesize that the products of GATA6 and POR functionally interact during outflow tract morphogenesis and that compound damaging mutations found in these genes may have caused or contributed to TA in these patients.
The three TA patients carrying the GATA6–POR oligogenic pair each harbor a de novo variant in GATA6 and an inherited predicted-damaging variant in POR (Fig. 5A). Interestingly, another proband in the PCGC carries a de novo GATA6 mutation without a damaging POR variant and presented only with ASDs, corroborating previous findings that GATA6 haploinsufficiency alone is not a fully penetrant cause of TA (Kodo et al. 2009). All identified variants were predicted as damaging, occur in highly conserved regions (phyloP scores > 3) near known functional domains (Fig. 5B; Supplemental Table S15), and in some cases potentially disrupt protein–DNA interaction (Supplemental Fig. 5), supporting their potential biological relevance.
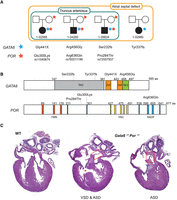
Evidence of a genetic interaction between GATA6 and POR in CHD. (A) Trio pedigrees for probands with de novo GATA6 mutation. All four probands had atrial septal defects (ASDs; larger box), whereas only three patients also had the more severe truncus arteriosus (TA) phenotype (smaller box), all of whom carry a predicted-damaging inherited mutation in POR. Amino acid changes to GATA6 and POR are shown for each proband below. (B) Expected consequence of damaging variants in GATA6 and POR protein structures. Functional domains of proteins are annotated and color-coded. (TAD) Transactivation domain, (ZnF) zinc finger domain, (NLS) nuclear localization signal, (FMN) flavin mononucleotide (FMN) binding domain, (FAD) flavin adenine dinucleotide (FAD) binding domain, (NADP) nicotinamide adenine dinucleotide phosphate (NADP) binding domain. (C) Representative histological images are shown. Gata6−/+; Por−/+ compound heterozygous mice exhibit ventricular septal defects (VSDs) and/or ASDs.
To evaluate the in vivo functional consequence of the individual and combined heterozygotic loss of Gata6 and Por, we crossed heterozygous knockout mice of each gene. Compound heterozygous Gata6−/+ Por−/+ mice were born below Mendelian ratios (five observed, eight expected), although this is not a statistically significant finding (Supplemental Table S16). Notably, Gata6−/+ Por−/+ fetus or P0 mice exhibited ASDs or ventricular septal defects (VSDs) at a rate of 53% (nine out of 17) (Fig. 5C; Table 3), compared with littermate control WT, Gata6−/+, and Por−/+ mice that experienced no clear cardiac defects by histological analyses (n = 6, 11, and 9, respectively). Echocardiography performed at the adult stage demonstrated that cardiac function was affected by deficiency of GATA6, but not POR, suggesting that POR influences aspects of cardiac development that may be dependent on neural crest cells (Supplemental Fig. 6B).
Histological analysis of cardiac development in Gata6 and Por mutant mice
Discussion
Developmental phenotypes affecting the heart have profound impacts on the lives of patients and their families, and understanding the underlying cause in each case can reveal additional disease risks to monitor as the patient ages to adulthood. Evidence of oligogenic transmission of developmental disease has increased in recent years (Priest et al. 2016; Alsemari et al. 2018; Gifford et al. 2019; Mkaouar et al. 2021), necessitating a fast and accurate method to determine gene combinations of interest from patient data. We provide a computational framework called GCOD to test for the significance of oligogenic gene set transmission and report its findings from a cohort of 3377 individuals with CHD. These findings collectively contribute 229 novel potential risk genes and modifiers from 160 unique predicted-damaging gene pairs from the full cohort, as well as 2005 higher-order gene sets and 2577 gene sets found in more specific diagnostic subsets.
This software is unique compared with other recent developments in the field of oligogenic combination detection (Kerner et al. 2020; Pounraja and Girirajan 2022; Versbraegen et al. 2023) because it uses family genotypes to limit statistical inference to gene sets with oligogenic transmission and eliminates effects of population stratification, thereby reducing computation and increasing our power to detect true phenotype associations while controlling false positives. We have also established the concept of the “highest-order” gene set, which restricts tested candidates to only the longest set of genes unique to a group of probands and can be calculated across the cohort in a single pass rather than by specifying a gene count as in other methods (Pounraja and Girirajan 2022). We note that users should be cautious when interpreting the disease contribution of large sets of genes as they are more likely to yield false positives, owing to increasingly unlikely transmission in simulations as the number of genes increases.
Our simulation method to assess significance of oligogenic sets relies on having sequencing data from enough families to observe multiple occurrences of rare gene combinations. Even so, clinicians working with one or just a few family pedigrees could make use of the first two steps of GCOD to enumerate variant and gene combinations segregating with disease to develop hypotheses for etiology in which no clear Mendelian inheritance pattern exists. The two-family filter was implemented to improve computational performance by avoiding running expensive simulations for gene pairs with insufficient statistical power. However, although our marginal P-values are accurate and valid for prioritizing gene sets, this prefiltering does affect the interpretation of multiple testing corrected P-values (FDR or Bonferroni), which are the error rates conditional on only testing pairs observed at least twice (for recommendations to obtain unconditional P-values, see Supplemental Methods). Developing filtering criteria that reduce computation without altering the meaning of adjusted P-values is an important area for future work.
GCOD is not an exhaustive search for oligogenic sets in any individual, as it does not take into account common variants (which are expected to confer less risk but undoubtedly play a role in some cases). We also do not account for the presence of noncoding variants, which can contribute to CHD and may interact with exonic variants (Richter et al. 2020; Yu et al. 2023). Including information from noncoding variants is critical to a complete understanding of the underpinnings of disease, and so, an important future direction will be to incorporate tools that predict the gene expression consequences of noncoding variants (Zhou and Troyanskaya 2015; Avsec et al. 2021; Moyon et al. 2022). Because GCOD only tests gene sets observed in at least two families, we recommend that users hoping to characterize individual cases of potentially oligogenic pathogenesis use a complementary tool such as ORVAL or Hop (Renaux et al. 2019; Gravel et al. 2024) to identify other contributing risk genes and variants in the particular case(s) of interest.
The method is more sensitive to de novo variation because an inherited event has a 50% probability of occurring, whereas most de novo events are exceedingly rare; results are therefore biased toward discovering oligogenic sets in which a nonsynonymous de novo variant was observed. In contrast, although it is useful in an individual case to particularly investigate homozygous and compound heterozygous variants that could have high impact in recessive disease, GCOD does not give additional weight to these events. Although these variants are more likely to be represented in candidate sets because they include alleles from both parents and any transmission including them is by definition oligogenic, we recommend that carrier-level post hoc investigation includes consideration of the number and zygosity of variants within genes of interest.
GCOD's estimates of variant co-occurrence will be most accurate when the tool is run with phased parental genotypes. Incorporating phasing data is particularly useful in cases in which individual genes have multiple damaging variants in the parents. This is more likely in long genes or when using lenient cutoffs for defining damaging variants. When provided, phased genotypes can be leveraged to account for nonindependence of variants from the same haplotype. This alters GCOD's computation of the expected co-occurrence of damaging variants in a set of genes. However, GCOD analysis can proceed without phased data, as we demonstrated in our analysis of CHD in which the parental genomes were not phased.
Despite these caveats, GCOD helped expand our understanding of the genetic underpinnings of a substantial minority of CHD cases with previously cryptic causal variants (Table 1). Nearly 10% of CHD probands carry predicted-damaging variants in an oligogenic set, and many of the genes and variants GCOD prioritized are novel candidate risk factors. Experimental validation is required to determine how many of these candidate variant sets are indeed sufficient to cause a heart defect or whether some level of additional background genetic risk is necessary. These future experiments would also help to address the challenge of assessing the sensitivity and specificity of tools like GCOD, which is currently infeasible given the small number of well-characterized positive controls in the literature. A polygenic risk score approach (Wendt et al. 2020; Isgut et al. 2021) could be used to prioritize oligogenic sets that lead to disease even in otherwise relatively low-risk genomes.
Our method identified several protein complexes and functions associated with heart development and further expanded these canonical sets to include potentially interacting genes and risk modifiers. There were 568 GCOD sets for which two or more genes encode for physically interacting proteins, but we note that a solved structure for the protein interaction does not exist in most cases. It is unclear whether the variants are directly disrupting the protein interaction interface to cause disease or whether the variants separately contribute to the disruption of a related process. To determine this, future work could include a pipeline for protein folding predictions and interaction predictions using tools like AlphaFold (Evans et al. 2021; Yang et al. 2023).
The molecular mechanisms of GATA6 and POR interaction during outflow tract development are not fully elucidated in this study. The PCGC proband harboring a de novo GATA6 mutation without a POR variant presented only with ASD, implying that POR plays critical roles in aortopulmonary septation via neural crest cell migration in humans. Our mouse model clearly demonstrates that concurrent deficiency of both genes can increase severity compared with disruption of GATA6 alone. Given that RA signaling is disrupted in Por knockout mice (Ribes et al. 2007; Zlotnik et al. 2022) and that GATA6 expression can be regulated by RA signaling (Okabe and Medzhitov 2014; Zito et al. 2017), our results support a model in which POR modulates the phenotypic consequence of GATA6 haploinsufficiency through the RA pathway. This interaction may contribute to the more severe cardiac defects observed in POR-deficient individuals and mice compared with those carrying only a single functional copy of GATA6.
However, we note that the penetrance of CHDs in mice is incomplete, with only half of the compound heterozygotes exhibiting defects such as muscular VSD and secundum ASDs. Furthermore, the mouse model demonstrates a different phenotypic outcome compared with what was observed in humans. Gata6 heterozygous mice showed no morphological defects, whereas human carriers of heterozygous damaging variants in GATA6 have ASDs. Notably, Gata6–Por compound heterozygous mice developed ASD without TA, in contrast to human carriers of the GATA6–POR oligogenic combination, who were diagnosed with both ASD and TA. These interspecies differences could be owing to evolutionary divergence in cellular contributions, lineage dynamics, or the spatiotemporal regulation of the outflow tract development. The majority of Gata6–Por double-mutant mice exhibited secundum ASD without TA, suggesting that Gata6–Por compound heterozygosity was not sufficient to affect neural crest cell population in mice, resulting in normal outflow tract septation. This compensation could rise from greater functional redundancy among CYP26 genes involved in RA metabolism in mice compared with humans (Uehara et al. 2007).
Overall, we have established a framework to identify combinations of genes that are transmitted in excess to trio probands. We have provided researchers with lists of prioritized, high-confidence gene and variant combinations in CHD for high-throughput screens or more precise mechanistic experiments. GCOD is freely available for applications to other diseases and species, in hopes of moving the field toward a more complete understanding of gene interactions during development, and how genetic variants combine in disease.
Methods
Variant calling and filtering
WES data from the 3377 CHD trios were sequenced using the Illumina HiSeq 2000 and mapped to the GRCh37 reference genome as described previously (Zaidi et al. 2013; Jin et al. 2017; Morton et al. 2021). Uniparental disomy and structural deletions were determined using UPDio software (King et al. 2014) with default parameters. De novo variants were called using the TrioDeNovo program (Wei et al. 2015) and accepted if previously described quality conditions were met (Homsy et al. 2015). Full criteria for variant inclusion can be found in the Supplemental Methods. All variants were called and are reported in GRCh37 coordinates for compatibility with Iossifov et al. (2014). These exonic variant calls would not be affected by using GRCh38, because we focus on protein-coding exons in noncentromeric regions.
Digenic pair enumeration
GCOD creates three gene-by-family matrices, one each for the mother, father, and offspring. These three matrices store information regarding variant provenance and allele counts that is used during enumeration of gene combinations and in offspring simulations.
Let I be the number of genes and J be the number of families. The I-by-J offspring matrix O contains information about damaging variants in gene i = 1, 2, … ,I for the offspring in family j = 1, 2, … ,J. The entries in O indicate the presence and provenance of the offspring variants using the following mutually exclusive labels:
-
0 = no variants;
-
1 = at least one variant transmitted from the mother, none transmitted from the father, no de novo variants;
-
2 = at least one variant transmitted from the father, none transmitted from the mother, no de novo variants;
-
3 = at least one variant transmitted from each parent, no de novo variants; and
-
4 = at least one de novo variant.
The I-by-J maternal matrix M contains information about variants in gene i for the mother in family j. Similarly, the I-by-J paternal matrix P contains information about variants in gene i for the father in family j. In both parental matrices, the entry in the ith row and jth column indicates the number of damaging alleles parent j has in gene i. For more efficient computation and storage, all three matrices are stored in compressed sparse row format.
To identify oligogenic gene pairs, the entries in O are compared for the genes in each candidate pair to determine if the damaging variant combination was present in either
parent or not. For a gene pair (i,i’) and family j in which neither Oi,j nor Oi’,j is zero, the pair is recorded as oligogenic if there are variants in the two genes that come from different parents or if
at least one of the genes has a de novo variant: (1)
In the GCOD implementation, we do not store the matrices Gj and instead only retain the identity of gene pairs (i,i’) and families j in which Gi,i’,j = 1, which avoids storing large numbers of zero entries. For gene sets larger than pairs (see section Highest-Order Gene
Set Enumeration), Equation 1 is extended so that G{i},j = 1 if and only if neither parent contributed all the damaging variants in the genes in the set {i}; that is, at least one variant was de novo or transmitted from the alternate parent. After identifying all combinations
({i}, j) with oligogenic transmission, any set {i} that reaches a user-specified minimum of observations in the cohort (default = 2 families: Σj G{i},j > 2) is retained as a candidate gene set for statistical testing.
(1)
In the GCOD implementation, we do not store the matrices Gj and instead only retain the identity of gene pairs (i,i’) and families j in which Gi,i’,j = 1, which avoids storing large numbers of zero entries. For gene sets larger than pairs (see section Highest-Order Gene
Set Enumeration), Equation 1 is extended so that G{i},j = 1 if and only if neither parent contributed all the damaging variants in the genes in the set {i}; that is, at least one variant was de novo or transmitted from the alternate parent. After identifying all combinations
({i}, j) with oligogenic transmission, any set {i} that reaches a user-specified minimum of observations in the cohort (default = 2 families: Σj G{i},j > 2) is retained as a candidate gene set for statistical testing.
Highest-order gene set enumeration
We defined the concept of a “highest-order” gene set, which comprises the largest unique candidate set observed in two or more probands (Supplemental Fig. 1). For every pair of individuals sharing a digenic candidate, all additional damaging variant-harboring genes in common between the two individuals comprise a maximum common gene set among that pair of individuals. GCOD then checks whether any lower-order sets for a given maximum common gene set are found in additional individuals and should therefore be included as an additional highest-order candidate with a distinct transmission count. The pairwise maximum common gene sets are sorted by the number of participating genes, beginning with the largest gene set and sequentially checking against smaller gene sets common between other proband pairs. If the union of genes is greater than one, and if the variants comprising that smaller set were transmitted oligogenically in each case, then the subset becomes an additional highest-order candidate entry.
Oligogenic transmission simulation test
For each candidate gene set {i}, the test statistic t{i} is the count of the number of families in which damaging variants in the set {i} are inherited oligogenically: (2)
As described above, sets with t{i} < 2 are by default not subjected to statistical testing as a means to reduce computation, although users can change this
setting. Excluding sets with low counts does not alter the raw (marginal) P-values of other sets, because our simulation-based null distribution (described below) is estimated independently for each
gene combination. But procedures for adjusting P-values for multiple testing are affected by the number of sets and their P-values. To include all sets for appropriate multiple testing correction, users may change the filtering threshold to zero,
although this will greatly increase the computational burden of running GCOD. A more efficient option is to set the marginal
P-value for all excluded sets to be equal to one (i.e., do not run the simulation) and then use all sets in the multiple testing
procedure. Alternatively, one may ignore the excluded sets and then interpret the resulting adjusted P-values as conditional probabilities (i.e., the probability of the observed test statistic under the null hypothesis of random
transmission and conditional on at least two oligogenic transmissions).
(2)
As described above, sets with t{i} < 2 are by default not subjected to statistical testing as a means to reduce computation, although users can change this
setting. Excluding sets with low counts does not alter the raw (marginal) P-values of other sets, because our simulation-based null distribution (described below) is estimated independently for each
gene combination. But procedures for adjusting P-values for multiple testing are affected by the number of sets and their P-values. To include all sets for appropriate multiple testing correction, users may change the filtering threshold to zero,
although this will greatly increase the computational burden of running GCOD. A more efficient option is to set the marginal
P-value for all excluded sets to be equal to one (i.e., do not run the simulation) and then use all sets in the multiple testing
procedure. Alternatively, one may ignore the excluded sets and then interpret the resulting adjusted P-values as conditional probabilities (i.e., the probability of the observed test statistic under the null hypothesis of random
transmission and conditional on at least two oligogenic transmissions).
To compute P-values for the count-based test statistics t{i}, we use a simulation approach. For each family, parental genotypes at loci participating in candidate sets are used to simulate K random offspring. The value K is user-defined and can be determined based on the number of candidate sets to be tested such that an alpha level of 0.05 is achievable after Bonferroni correction. The default is K = 10,000 simulations with a maximum of 10,000,000 simulations to cap computational burden; this limit can be overridden, but users with large variant data sets requiring more simulations are encouraged to filter further by relevant criteria to limit compute, disk, and memory requirements. In each simulation k = 1, 2, …, K, for each gene i and family j, an offspring genotype is simulated by randomly selecting one allele from the father and one from the mother at each variant using the allele counts Mi,j and Pi,j. The probability of a maternally transmitted damaging variant in gene i and family j is 1 − (0.5)Mi,j, and the probability of a paternally transmitted damaging variant in gene i and family j is 1 − (0.5)Pi,j. Then, additional de novo mutations are simulated based on previously derived mutability constants (Samocha et al. 2014). If the mutability rate per chromosome for gene i is di, then the probability of a de novo variant in the simulated offspring is 2 * di.
Using the resulting transmitted and de novo alleles, GCOD computes an I-by-J offspring matrix Ok for simulation k using the same definitions as used above for recording the provenance of proband damaging variants, with Oki,j being equal to zero, one, two, three, or four (see section Digenic Pairs Enumeration). Repeating the simulation K times generates a distribution of K observations of O under the null hypothesis of random transmission. For each oligogenic candidate gene set {i}, GCOD indexes the constituent genes and uses the matrices {O1, O2, …, OK} to record which simulated offspring across the K simulations carry that combination with oligogenic transmission, as described above for probands. By summing over families
as in Equation 2, this generates a test statistic tk{i} for each iteration k and gene set {i}. For any gene set {i}, this provides an empirical null distribution of the number of families with oligogenic transmission (i.e., K null values of the count statistic for that set) given the parental genotypes. The raw P-value is the proportion of iterations with a simulated test statistic as large or larger than the observed proband statistic: (3)
GCOD returns the test statistics (number of probands observed with the oligogenic combination) and P-values (raw, Benjamini–Hochberg FDR-corrected, and Bonferroni-corrected) for each candidate gene set. In this study, we use
a significance threshold of Benjamini–Hochberg FDR ≤ 0.01 unless otherwise indicated.
(3)
GCOD returns the test statistics (number of probands observed with the oligogenic combination) and P-values (raw, Benjamini–Hochberg FDR-corrected, and Bonferroni-corrected) for each candidate gene set. In this study, we use
a significance threshold of Benjamini–Hochberg FDR ≤ 0.01 unless otherwise indicated.
Comparison of computational resources and type-I error rate
All comparison tests were run on an Intel Xeon gold 6148 CPU @ 2.40 GHz with 40 cores (two sockets, one thread per core). CPU runtime was calculated by running all jobs with the time command, and summing the user and system (Sys) time spent on all parent and child processes (therefore accounting for time spent in parallel threads). Peak memory was calculated using the memusg package (https://github.com/jhclark/memusg) to report the maximum memory usage in kilobytes for the process over the course of its run, although this does not sum across parallel threads. To compare the three methods’ performance for the same research question, we restricted the benchmarking analysis to digenic pairs (as this is the only possible runmode for Digenic). To estimate FPR, we ran each software on all synonymous variants in the data set, on pseudosibling variants using the CADD-based variant filtering method, and on the nonsynonymous variant set in which family IDs were randomly shuffled. FPR was calculated based on the percentage of candidates that were found significant from these data; that is, if 5% of synonymous candidates were found significant by a given method, this corresponds to synonymous FPR = 0.05.
The RareComb package was run using default parameters for the compare_enrichment() function, using parents as controls, with a gene combination combo_length of two genes and max_freq_threshold = 0.25. To compare with GCOD, which requires at least two probands to carry an oligogenic combination, RareComb was run with min_indv_threshold = 2. Except when specified here, RareComb ran with default parameters.
Digenic was run in genexgene analysis mode. By default, digenic accepts as input two files of common and rare variants, but for our purposes, we used only rare variants (with the “common” file restricted to Gnomad_AF1 = 0.05 and the “rare” file at Gnomad_AF2 = 0.01). We used PLINK version 1.9 to calculate the first three principal components of genotypes in the data set, providing input for the feno option. Additionally, we removed the filtering step that only considers genes in which 5% of samples were carriers, instead removing pairs only observed once in the data set. Except when specified here, digenic ran with default parameters.
We also compared GCOD's performance to that of a multilocus rare-variant generalization of the TDT (mTDT). Because of the nature of our variant data set (i.e., rare variants with MAF < 0.05), we aggregated variants across the coding region of a gene using the burden of rare variants (BRV) method as done previously (Li and Leal 2008; He et al. 2014) and used a χ2-test with 1° of freedom to determine whether the minor alleles were transmitted together more often than expected. For a more detailed description of this method, see the Supplemental Methods.
GO analysis and volcano plot
We performed GO analyses using the GOATOOLS package in Python3 (version 1.1.6) (Klopfenstein et al. 2018), using the GOEnrichmentStudyNS() function with default settings. The background gene list was genes meeting “strict” criteria and/or with DNVs in the cohort (i.e., all genes it was possible to observe in a strict oligogenic set). “CHD gene enriched terms” were found using the same analysis as described above on the set of CHD genes from Richter et al. (2020), at a cutoff of FDR < 0.05. “GCOD putative terms” were defined as any terms enriched for the list of genes in GCOD pairs (strict variant criteria) at a cutoff of FDR < 0.1 that were not also enriched for the list of known CHD genes. When reporting top enriched terms, we only include GO categories with at least five gene members for relevance and legibility.
Canonical pathway and interaction analysis
Canonical pathways, curated signature gene sets, and ontology gene sets were sourced from MSigDB (Liberzon et al. 2015), and these were filtered to only those sets containing fewer than 500 genes. The list of cardiac gene sets curated from the HPO was created by filtering the complete HPO gene set list to those matching the name of a CHD diagnosis, as well as those containing the strings “cardiac” or “heart” (then reviewed for relevance to heart development). Protein interactions were sourced from the CORUM protein complex database (Steinkamp et al. 2025), human physical interactions in the STRING v12.0 database (Szklarczyk et al. 2021), and human, mouse, and rat protein–protein interactions in iRefIndex v15.0 (Razick et al. 2008).
Cell type–specific network discovery and depiction
Oligogenic sets were compared to cell type–specific DEGs sourced from previous human and mouse studies (Supplemental Table S10). Cell types containing at least two genes found in an oligogenic set together are shown in Figure 3E. We note that edges have been filtered for clarity: There are instances in which some genes depicted in Figure 3E were found together in an oligogenic set but the edge is not shown; this is the case when those oligogenic genes were not both found together in a particular cell type–specific gene set. There are likewise many instances in which genes depicted were found to be differentially expressed in more than just the cell type(s) indicated by thin edges, but we have only shown edges to cell types in which an oligogenic partner gene was also differentially expressed.
Mouse models
Gata6 VenusKI/+ mice (stock 028096) and Gata6 floxed/floxed mice (stock 008196) were purchased from The Jackson Laboratory and backcrossed to C57BL/6J mice for more than five generations prior to experiments. Por floxed/floxed mice were generously provided by Dr. Xinxin Ding (Wu et al. 2003). Genotyping was performed according to protocols of providers. To generate whole-body knockout mice, both floxed lines were crossed with B-actin-Cre mice (Jackson Laboratory 033984), resulting in Gata6−/+ and Por−/+ heterozygous knockout mice, respectively. Gata6 VenusKI/+ or Gata6−/+ mice were crossed with Por−/+ mice in order to examine potential cardiac phenotypes in embryos at embryonic day (E18.5) and in newborn pups at postnatal day 0 (P0). All mice were maintained under standard conditions in accordance with institutional animal care guidelines, and all procedures were conducted under protocols approved by the relevant animal ethics committee.
Histological analysis
To examine morphological anomalies of the heart, hearts were collected and fixed in 4% paraformaldehyde in 1× PBS overnight at 4°C. The following day, samples were washed, embedded in a paraffin, and sectioned to obtain the four-chamber view of the heart. Sections were stained by hematoxylin and eosin. Each sample was evaluated by two blinded reviewers for cardiac abnormalities.
Echocardiography
Echocardiography was performed blindly with the Vevo3100 high-resolution micro-imaging system (VisualSonics) with MX550S and MX700 ultrasound transducers. The left ventricle was assessed in both parasternal long-axis and short-axis views. To calculate the shortening fraction, left ventricular end-systolic and end-diastolic diameters were measured from the left ventricular M-mode tracing at the papillary muscle.
Code availability
GCOD scripts are available at GitHub (https://github.com/mepittman/gcod) and as Supplemental Code.
Competing interest statement
The authors declare no competing interests.
Acknowledgments
We thank the participants and research clinicians of the Pediatric Cardiac Genomics Consortium (PCGC) and Simons Foundation Autism Research Initiative. We thank Dr. Sarah Morton of the Harvard Medical School Division of Newborn Medicine for providing data and processing pipelines from the PCGC. CHD genomic data were generated by the PCGC, under the auspices of the National Heart, Lung, and Blood Institute (NHLBI) Bench to Bassinet Program (https://benchtobassinet.com). This study was funded by NHLBI (grants P01 HL098707, P01 HL146366, and UM1 HL098179), Additional Ventures, and the L.K. Whittier Foundation. M.P. was supported by an NHLBI fellowship (F31HL156439). K.L. was supported by NHLBI under award number T32HL007544-32 and F32HL158263-01. K.L. was also supported by grants from the National Research Foundation of Korea (NRF; RS-2023-00261247, RS-2023-00223069) and the Korean Fund for Regenerative Medicine (KFRM; RS-2024-00332601), funded by the Korea government (Ministry of Science and ICT).
Author contributions: M.P., K.L., K.S.P., and D.S. conceived and designed the study. M.P. and K.L. performed experiments. M.P. and K.L. contributed equally to this work. M.P. implemented GCOD and led the computational and statistical analyses. K.L. performed mouse experiments with the assistance of A.L. F.F. generated structural representations of GATA6 genetic variants. Y.H. performed echocardiology. M.W.C. helped K.L. with the histological analysis. M.P., K.S.P., and K.L. analyzed and interpreted data and prepared the manuscript and figures. D.S. provided critical conceptual input and oversight. K.S.P. led the study team. K.S.P., D.S., and K.L. provided funding. All authors reviewed and approved the final version.
Footnotes
-
[Supplemental material is available for this article.]
-
Article published online before print. Article, supplemental material, and publication date are at https://www.genome.org/cgi/doi/10.1101/gr.281141.125.
-
Freely available online through the Genome Research Open Access option.
- Received July 1, 2025.
- Accepted November 26, 2025.
This article, published in Genome Research, is available under a Creative Commons License (Attribution-NonCommercial 4.0 International), as described at http://creativecommons.org/licenses/by-nc/4.0/.


