
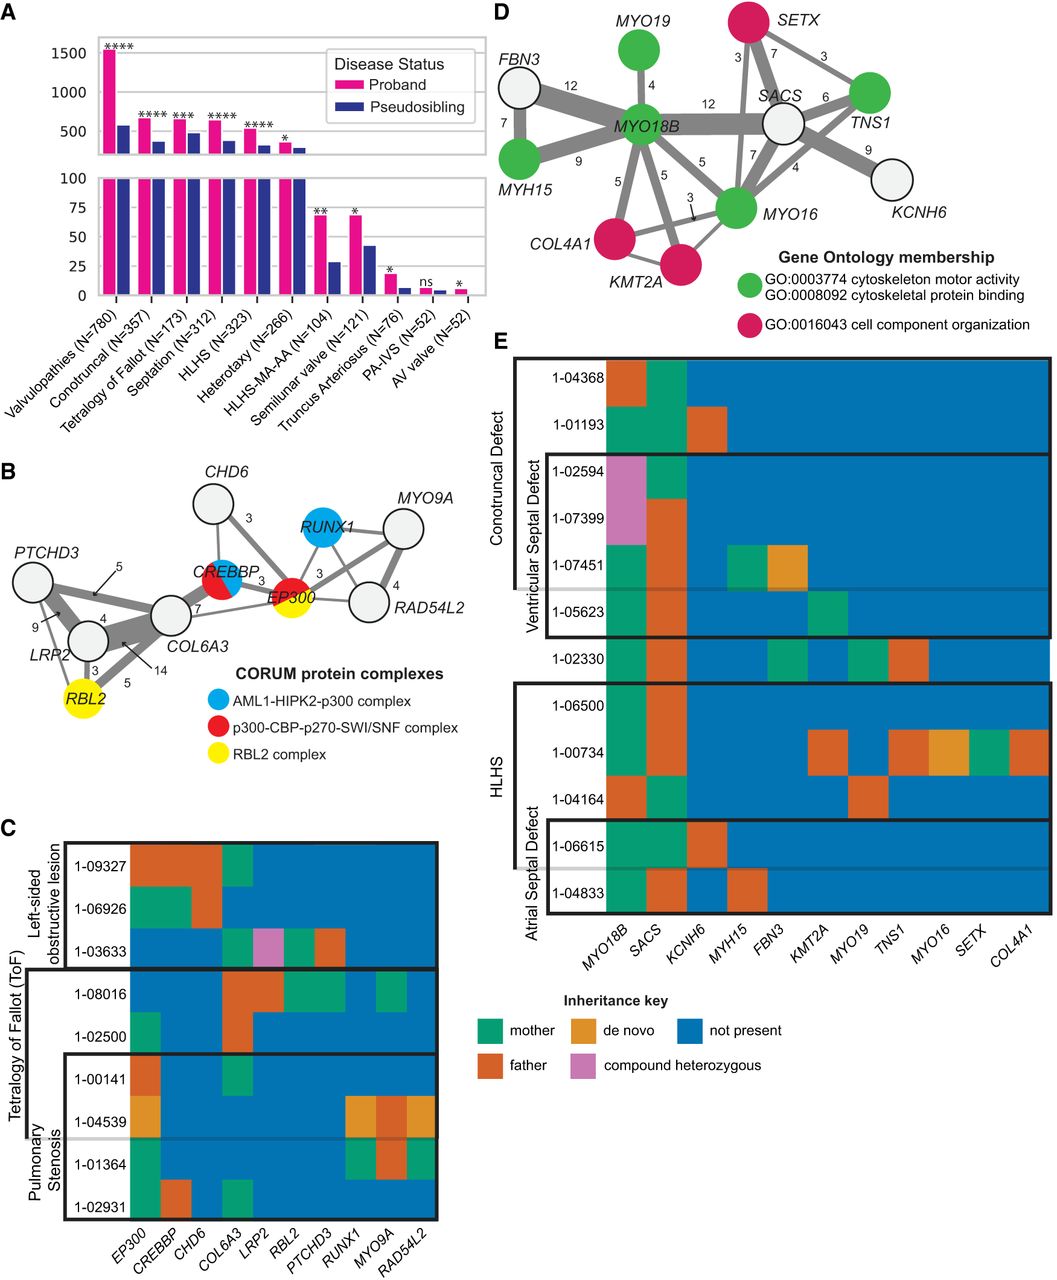
Oligogenic sets in CHDs. (A) Counts of oligogenic pairs by CHD diagnosis. (B) Network visualization of genes in oligogenic sets containing one or more of the genes coding for members of AML1-HIPK2-p300 complex, p300-CBP-p270-SWI/SNF complex, or RBL2 complex. Node color indicates a gene product's inclusion within a protein complex, and edge width and labels indicate the number of probands with co-occurring mutations in each gene pair. Nonannotated edges represent a co-occurrence count of two probands. (C) Variant inheritance matrix for genes in B. Columns indicate genes, and rows indicate probands that harbor damaging mutations in each gene. Cell color represents the parental or de novo provenance of a proband's variant(s) in the specified gene column. Multiple probands sharing a diagnosis are indicated by black boxes. (D) Network visualization of interconnected oligogenic sets, centered on the MYO18B-SACS digenic pair. Node color indicates a gene's association with a GO term. (E) Variant inheritance matrix for genes in D among carriers of the MYO18B-SACS combination.


