

Abstract
Topologically associating domains (TADs) are fundamental units of 3D genome architecture that shape gene regulation. Comparative analyses of TADs across biological conditions have revealed their involvement in development and disease. However, accurately identifying differential TADs from low sequencing depth and pseudobulk chromatin contact maps remains challenging. Here, we present HiDT, a graph neural network-based algorithm with an attention-based, edge-enhanced layer to capture structural differences between TADs. HiDT integrates a depth-specific normalization module and is trained across a wide range of sequencing depths, enabling robust detection of differential TADs under low sequencing depth conditions. Comprehensive benchmarking demonstrates that HiDT consistently outperforms existing methods at both the TAD and subTAD levels, maintaining accuracy even in data sets with only a few million contacts. We further apply it to multiple low sequencing depth and pseudobulk data sets that are challenging for existing methods, revealing TAD reorganization linked to oncogene dysregulation during tumor progression, capturing differential TADs associated with underlying transcriptional heterogeneity in single-cell Hi-C data, and identifying haplotype-specific TADs associated with allele-specific structural variations. Overall, HiDT provides a robust tool for differential TAD analysis and facilitates insights into chromatin structure-function relationships.
Topologically associating domains (TADs), identified through Hi-C (Lieberman-Aiden et al. 2009) and related chromatin conformation capture technologies (Hua et al. 2021; Deshpande et al. 2022), are fundamental structural and functional units of the 3D genome organization (Dixon et al. 2012; Nora et al. 2012). These are self-interacting genomic regions, characterized by high intradomain interactions and reduced interdomain interactions at their boundaries (Yu et al. 2017; An et al. 2019). TADs constrain regulatory interactions by limiting enhancer–promoter contacts and preventing interference between chromosomal regions (Symmons et al. 2014; Zhan et al. 2017). Changes in TAD structures have been associated with diverse biological processes and conditions, including cell reprogramming, species divergence, disease, and cell-type-specific regulation (Dixon et al. 2015; Krijger et al. 2016; Chen et al. 2020; Winick-Ng et al. 2021; Álvarez-González et al. 2022b). For example, the low conservation of TAD structures between humans and chimpanzees suggests their potential role in species-specific gene regulation (Eres et al. 2019). Reorganization of TADs in cancer can lead to enhancer hijacking, resulting in the ectopic activation of oncogenes (Akdemir et al. 2020). In addition, TAD boundaries derived from single-cell Hi-C data can capture intrinsic cell-type variability (Li et al. 2023). Therefore, identifying differential TADs through comparative analysis is essential for elucidating the roles of 3D genome architecture in evolution, disease, and cellular heterogeneity (Bonev and Cavalli 2016).
Several studies have analyzed differential TADs using pipeline-based strategies, in which TADs are independently called in each condition using existing tools, such as directionality index (DI) (Dixon et al. 2012), insulation score (IS) (Crane et al. 2015), or TopDom (Shin et al. 2016), followed by direct comparison of boundary positions to detect differences (Álvarez-González et al. 2022a; Xu et al. 2022). However, these approaches rely heavily on the reproducibility of individual TAD callers and often fail to detect differential TADs with unchanged boundaries but altered internal chromatin interactions (Hua et al. 2024).
Therefore, there is a critical need for computational methods capable of accurately identifying differential TADs (Gjoni et al. 2025). In response, specialized computational tools have been developed to directly detect differential TADs from Hi-C contact matrices. Representative methods currently available for this task are primarily statistically driven approaches. For example, DiffGR (Liu and Ma 2024) detects differential TADs using stratum-adjusted correlation coefficient (SCC) values (Yang et al. 2017) and nonparametric permutation tests to assess statistical significance. DiffDomain (Hua et al. 2024) identifies differential TADs by testing whether the normalized Hi-C difference matrix follows the generalized Wigner matrix distribution under the null hypothesis.
A major challenge for differential TAD identification is that Hi-C data are often sparse and noisy. Limitations in Hi-C sequencing efficiency and variability in sample quality often lead to low sequencing depth, resulting in contact matrices with many missing interactions (Dang et al. 2025). This problem is further amplified at higher resolutions, in which increased sparsity makes it increasingly difficult to accurately delineate both TADs and subTADs (Zhang et al. 2022). In single-cell Hi-C studies, the sparsity challenge is even more pronounced, with limited interaction counts per cell that make it difficult to reliably detect differential TADs (Li et al. 2021). As a result, comparative analyses are often restricted to the compartment scale rather than fine-scale comparisons at the TAD scale (Liu et al. 2025). Moreover, these statistically driven approaches often underperform when applied to low sequencing depth Hi-C data (Yardımcı et al. 2019). These challenges highlight the need for robust computational methods capable of identifying differential TADs across varying sequencing depths, particularly from low sequencing depth bulk and pseudobulk chromatin contact maps.
Therefore, we present HiDT, an algorithm specifically designed to identify differential TADs from Hi-C data. For each candidate TAD region, we construct graphs G1 and G2 from local Hi-C contact maps corresponding to the reference and comparison samples. This graph-based formulation allows the problem to be reframed as a graph similarity problem. We then employ a graph neural network (GNN) to learn graph-level representations of each candidate TAD region in the reference and comparison samples and to quantify their differences to determine whether the TAD is differential. By training the model on data sets with varying sequencing depths and incorporating a depth-specific normalization layer, HiDT achieves robust performance in identifying differential TADs across Hi-C contact maps with different sequencing depths, particularly in low sequencing depth contact maps.
Results
Overview of HiDT
HiDT is a GNN-based algorithm designed to identify differential TADs between two biological samples. Given a set of TAD boundaries identified from the reference sample and the Hi-C contact matrices from both the reference and comparison samples as input, HiDT evaluates each corresponding region to determine whether it exhibits significant structural differences. Here, the reference sample refers to the sample from which the TAD boundaries are identified, whereas the comparison sample refers to the sample used to determine whether the corresponding TAD regions are different from those in the reference sample.
In the training stage, GM12878 and K562 were selected for training, representing a lymphoblastoid cell line and a chronic myelogenous leukemia cell line, respectively. These two cell lines have high-quality Hi-C data, substantial differences in chromatin organization, and multiple replicate samples, making them suitable for constructing training data for differential TAD identification. Based on these data, the model was trained at 25 kb resolution using 16,280 positive and 17,290 negative TAD pairs. All labels were generated programmatically from consensus TAD boundary calls and high-confidence differential or nondifferential TAD annotations. Positive pairs comprise (1) TAD pairs with distinct boundaries between GM12878 and K562 and (2) high-confidence differential TAD pairs with the same TAD boundaries between GM12878 and K562. Negative pairs include (1) TAD pairs from replicate samples of GM12878 and (2) high-confidence nondifferential TAD pairs with the same TAD boundaries between GM12878 and K562 (Fig. 1A).
Schematic diagram of the HiDT algorithm. (A) Construction of positive and negative TAD pairs for model training. Positive pairs included differential TAD pairs between GM12878 and K562, whereas negative pairs included GM12878 replicate pairs and nondifferential TAD pairs between GM12878 and K562. The training set comprised 16,280 positive pairs and 17,290 negative pairs. (B) Conversion of paired Hi-C contact matrices into graph representations, with nodes representing genomic bins and edge weights representing interaction frequencies. The resulting graph is not necessarily fully connected, and nodes retain self-interactions. (C) Learning of graph-level embeddings using an edge-enhanced graph neural network with depth-specific normalization and gated MLP aggregation, where G1 and G2 denote the two graphs in a TAD pair, denotes the node embedding vector, denotes the normalized node vector, and and denote the graph representation vectors. (D) Model training with a pairwise loss to separate differential and nondifferential TAD pairs in the embedding space, where d(G1 − G2) denotes the Euclidean distance between graph embeddings, γ denotes the margin, and t ∈ {− 1, 1} indicates whether a pair is negative or positive. (E) TAD pairs with Euclidean distances above the cutoff are classified as differential, where d denotes the Euclidean distance between graph embeddings.
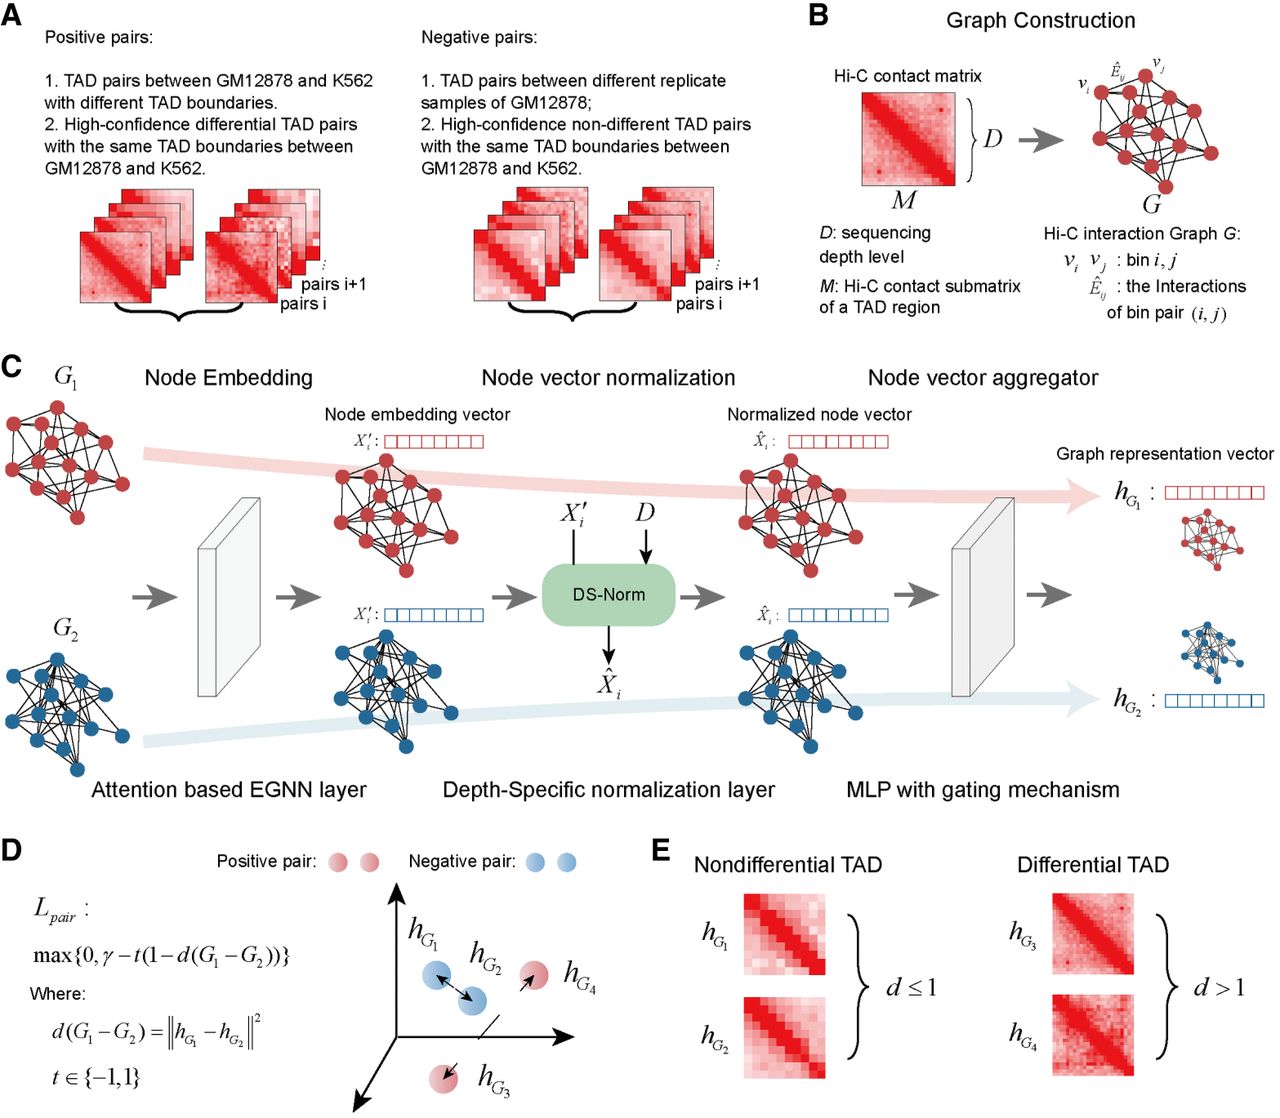
For each TAD pair, HiDT converts each contact matrix into a graph, in which nodes represent genomic loci (vi and vj) and edge weights represent normalized interaction frequencies between pairs of loci (Fig. 1B). During graph construction, self-loops are retained. In addition, because some locus pairs may have zero interaction frequency, the resulting graph is not necessarily complete. These graphs are then used as the input to an attention-based edge-enhanced graph neural network (EGNN), which embeds the nodes into a latent space. A depth-specific normalization layer is incorporated to account for differences in sequencing depth, ensuring consistency in feature scaling. The node embeddings are subsequently aggregated into a single graph-level embedding using a gated multilayer perceptron (MLP) (Fig. 1C). Finally, a pairwise loss function is used to train the model, encouraging larger distances between embeddings of positive pairs and smaller distances for negative pairs (Fig. 1D).
In the prediction stage, the trained HiDT model is directly applied to new sample pairs without retraining. For each candidate TAD pair, the Hi-C contact matrices from the reference and comparison samples are converted into graphs, and graph-level embeddings are generated through the trained model. The distance between the two graph embeddings is then calculated, and TAD pairs with distances above a predefined cutoff are classified as differential (Fig. 1E).
Benchmarking HiDT performance in GM12878 and K562 cell lines
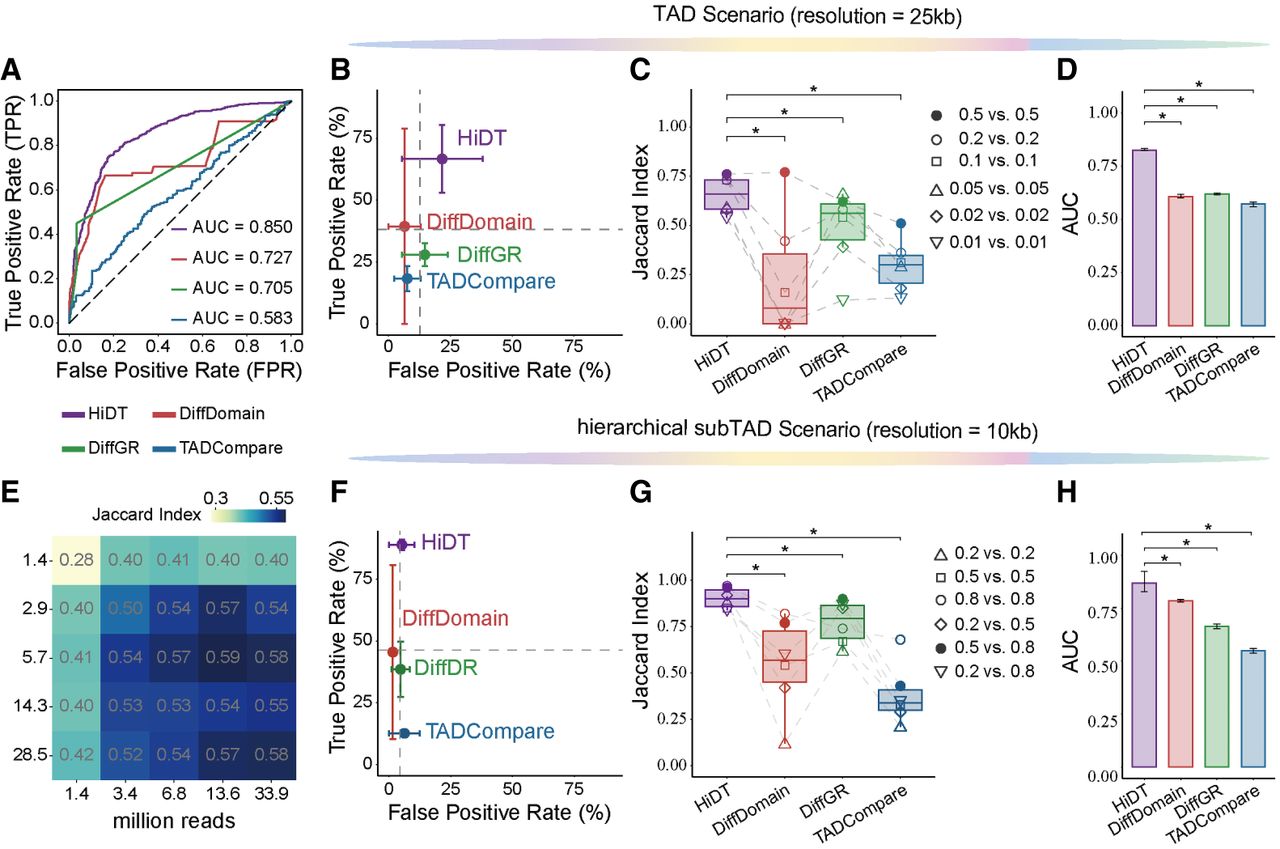
To comprehensively evaluate the performance of HiDT, we conducted a series of in silico experiments using GM12878 and K562 cell lines. Although these cell lines were used to construct the training data set, Chromosomes 1–17 were used for training, Chromosome 18 for validation, and Chromosomes 19–X exclusively for benchmarking. We compared HiDT against three representative methods, including DiffDomain (Hua et al. 2024), DiffGR (Liu and Ma 2024), and TADCompare (Cresswell and Dozmorov 2020), which are among the most directly comparable methods currently available for this task (Supplemental Notes). On the test set, HiDT achieved an area under the ROC curve (AUC) of 0.85, outperforming the other methods in distinguishing differential from nondifferential TADs (Fig. 2A).
Performance evaluation of HiDT for differential TAD and hierarchical subTAD identification using GM12878 and K562 data. (A) Receiver operating characteristic (ROC) curves and area under the curve (AUC) values for differential TAD identification at 25 kb resolution. (B) False-positive rate (FPR) and true-positive rate (TPR) for differential TAD identification from downsampled contact maps using high-confidence reference sets. Each circle shows the mean across sample pairs, and gray dashed lines show the overall means across methods. (C) Jaccard indices were calculated between differential TADs identified from downsampled data and those identified by the same method from the corresponding full-depth data. Symbols indicate downsampling pairs, with paired results connected by gray dashed lines. (D) AUC values across five downsampling replicates. Error bars indicate standard deviations. (E) Jaccard indices of HiDT across sequencing depths, expressed as millions of intrachromosomal contacts. (F–H) Corresponding FPR and TPR, Jaccard indices, and AUC values for differential hierarchical subTAD identification. Statistical significance was assessed using a Wilcoxon signed-rank test. Significance labels are defined as follows: (*) P < 0.05.
To validate performance across different TAD callers, we used TADs identified by the DI and IS as input and assessed differential TADs between GM12878 biological replicates (considered false positives, following the DiffDomain evaluation strategy) and between GM12878 and K562. All methods showed low false-positive rates (FPRs) between GM12878 replicates. HiDT and DiffGR were notably more robust to the choice of TAD detection algorithm, with only a 0.1% difference in FPR between DI and IS input (Supplemental Fig. S1A). In the GM12878 and K562 comparison, HiDT and DiffDomain identified >40% of TADs as differential, whereas DiffGR and TADCompare were more conservative (Supplemental Fig. S1B). Most differential TADs identified by each method overlapped those detected by at least one other method. HiDT showed the highest overlap at 90.6%, compared with 70.8%, 85.9%, and 77.7% for DiffDomain, DiffGR, and TADCompare, respectively (Supplemental Fig. S1C).
To further evaluate the robustness of each method under varying sequencing depths, we downsampled the GM12878 and K562 Hi-C data sets to 1%, 2%, 5%, 10%, 20%, and 50% of their original coverage and performed differential TAD detection at both 25 kb and 50 kb resolutions. To enable performance evaluation across different sequencing depths, we constructed high-confidence TAD sets from full-depth data as reference sets (Methods). HiDT maintained stable performance across all depths and achieved the highest TPR, although its FPR was also higher than those of the other methods. This higher FPR partly reflects its greater sensitivity, because additional differential TADs identified only by HiDT were absent from the consensus reference set and were therefore counted as false positives. DiffDomain effectively controlled FPR at higher sequencing depths, but its sensitivity decreased as sequencing depth was reduced. DiffGR and TADCompare exhibited consistently elevated FPRs in all samples (Fig. 2B; Supplemental Fig. S1D). HiDT also achieved the highest Jaccard indices across downsampling ratios (P < 0.05). For each method, the Jaccard index was calculated between its downsampled and corresponding full-depth predictions (Fig. 2C; Supplemental Fig. S1E). To reduce stochastic variation, each downsampling experiment was repeated five times, and an overall AUC was calculated by combining results across downsampling ratios. HiDT achieved the highest AUC at both the 25 kb and 50 kb resolutions (P < 0.05) (Fig. 2D; Supplemental Fig. S1F). To determine the minimum sequencing depth required for reliable detection, we evaluated the reproducibility of HiDT results at lower sequencing depths. At 25 kb resolution, data sets with more than 5 million intrachromosomal contacts (across Chromosomes 1 to X) yielded reproducible results (Jaccard index > 0.5) (Fig. 2E). At 50 kb resolution, 1 million contacts were sufficient to achieve similar reproducibility (Supplemental Fig. S1G).
We further evaluated differential hierarchical domains at a finer resolution of 10 kb. Hierarchical subTADs were more numerous and smaller than hierarchical TADs (Supplemental Fig. S2A). HiDT identified 66.2% of hierarchical TADs and 50.9% of hierarchical subTADs as differential compared with 60.5% and 31.5% for DiffDomain. DiffGR and TADCompare were more conservative (Supplemental Fig. S2B). The proportions of differential hierarchical subTADs located within differential hierarchical TADs were 99.2% for DiffDomain, 89.8% for HiDT, 67.1% for DiffGR, and 39.2% for TADCompare (Supplemental Fig. S2C).
Because HiDT identified more differential subTADs than the other methods, we examined the biological relevance of the 145 subTADs uniquely identified by HiDT. Of these, 65.5% overlapped differential expression genes (DEGs), whereas 69.0%, 68.3%, and 77.2% overlapped differential H3K27ac, H3K4me3, and H3K4me1 signals, respectively (Supplemental Fig. S2D). We also provided two representative examples of differential subTADs identified only by HiDT and missed by the other methods (Supplemental Fig. S2E). Both were associated with K562-related DEGs (Jing et al. 2016; Hong et al. 2024) and differential H3K4me1 and H3K4me3 signals, which are linked to enhancer and promoter activity, respectively.
We further assessed the robustness of differential hierarchical TAD and subTAD detection under downsampling factors of 0.2, 0.5, and 0.8. HiDT consistently showed higher TPRs compared with the other methods for both hierarchical TADs (Supplemental Fig. S2F) and hierarchical subTADs (Fig. 2F). Although DiffDomain retained better FPR control, its sensitivity and overlap declined as data sparsity increased. HiDT also achieved the highest Jaccard indices across sequencing depths, indicating stronger consistency with full-depth results for both hierarchical TADs (Supplemental Fig. S2G) and hierarchical subTADs (Fig. 2G). Consistently, HiDT achieved significantly higher AUC values than the other methods for both hierarchical TADs (Supplemental Fig. S2H) and hierarchical subTADs (P < 0.05) (Fig. 2H).
To further support the robustness and biological relevance of HiDT, we performed a series of additional analyses covering potential bias in high-confidence TAD set construction; the functional relevance of differential TADs, hierarchical TADs, and hierarchical subTADs; additional model validation; and benchmarking of runtime and memory usage. These results are provided in the Supplemental Notes and Supplemental Figures S3–S9.
In summary, HiDT enables robust and accurate identification of differential chromatin domains across a wide range of sequencing depths. It maintains strong performance under low-depth conditions and effectively detects differential TADs and finer-scale subTADs. In addition, the differential TADs and subTADs identified by HiDT are more strongly associated with transcriptional and epigenetic changes, supporting their biological relevance and highlighting the utility of HiDT for reliable 3D genome comparison.
Benchmarking HiDT performance across other cell lines and species
To further evaluate the generalizability of HiDT, we applied it to additional biological contexts, including the IMR-90 and KBM7 cell lines. We first assessed the differential TADs identified between IMR-90 replicates, in which HiDT achieved the lowest FPR, followed by DiffDomain, TADCompare, and DiffGR (Supplemental Fig. S10A). The proportions of IMR-90 TADs identified as differential in KBM7 were 54.7% for HiDT, 59.1% for DiffDomain, 23.1% for DiffGR, and 5.8% for TADCompare (Supplemental Fig. S10B).
We further examined the method's robustness across varying sequencing depths. To ensure consistency, we applied the same downsampling factors and performance metrics as in the above analysis. Compared with the other methods, HiDT consistently maintained superior performance across varying sequencing depths, achieving significantly higher TPR (Fig. 3A; Supplemental Fig. S10C). HiDT also demonstrated a higher overall Jaccard index across downsampling factors, indicating strong consistency with full-depth predictions (Fig. 3B; Supplemental Fig. S10D). Consistent with these results, HiDT also achieved significantly higher AUC values than the other methods under downsampling conditions at both the 25 kb (Fig. 3C) and 50 kb (Supplemental Fig. S10E) resolutions (P < 0.05). Notably, although three methods identified differential TADs in the full-depth sample pair, only HiDT could still identify these differential TADs in the lower-depth contact maps (Fig. 3D,E). Importantly, even after downsampling to 0.01, the high initial sequencing depth left millions to tens of millions of intrachromosomal contacts, preserving enough TAD structure and between-sample differences for differential TAD detection (Supplemental Table S1; Supplemental Fig. S11).
Performance evaluation of HiDT on IMR-90 versus KBM7 and zebrafish developmental Hi-C data. (A) FPR and TPR of differential TADs identified from downsampled 25 kb contact maps using high-confidence reference sets. (B) Jaccard indices of differential TADs identified from downsampled and full-depth data. Each point represents one downsampling pair, with paired results connected by gray dashed lines. (C) AUC values for differential TAD identification between IMR-90 and KBM7 at 25 kb resolution. Bars and error bars indicate the mean and standard deviation across five downsampling replicates. (D,E) Representative differential TADs between IMR-90 and KBM7 at different downsampling ratios. Upper and lower triangles show KBM7 and IMR-90 contact maps, respectively. Check and cross marks indicate whether each method classified the TAD pair as differential. (F) Hi-C contact maps of a region on Chromosome 18 across zebrafish developmental stages. Black lines indicate DI-defined TAD boundaries. Heatmaps were generated using Plotgardener (Kramer et al. 2022). (G) Proportions of differential TADs identified by each method when comparing the 24 hpf sample with its replicate and with earlier developmental stages.
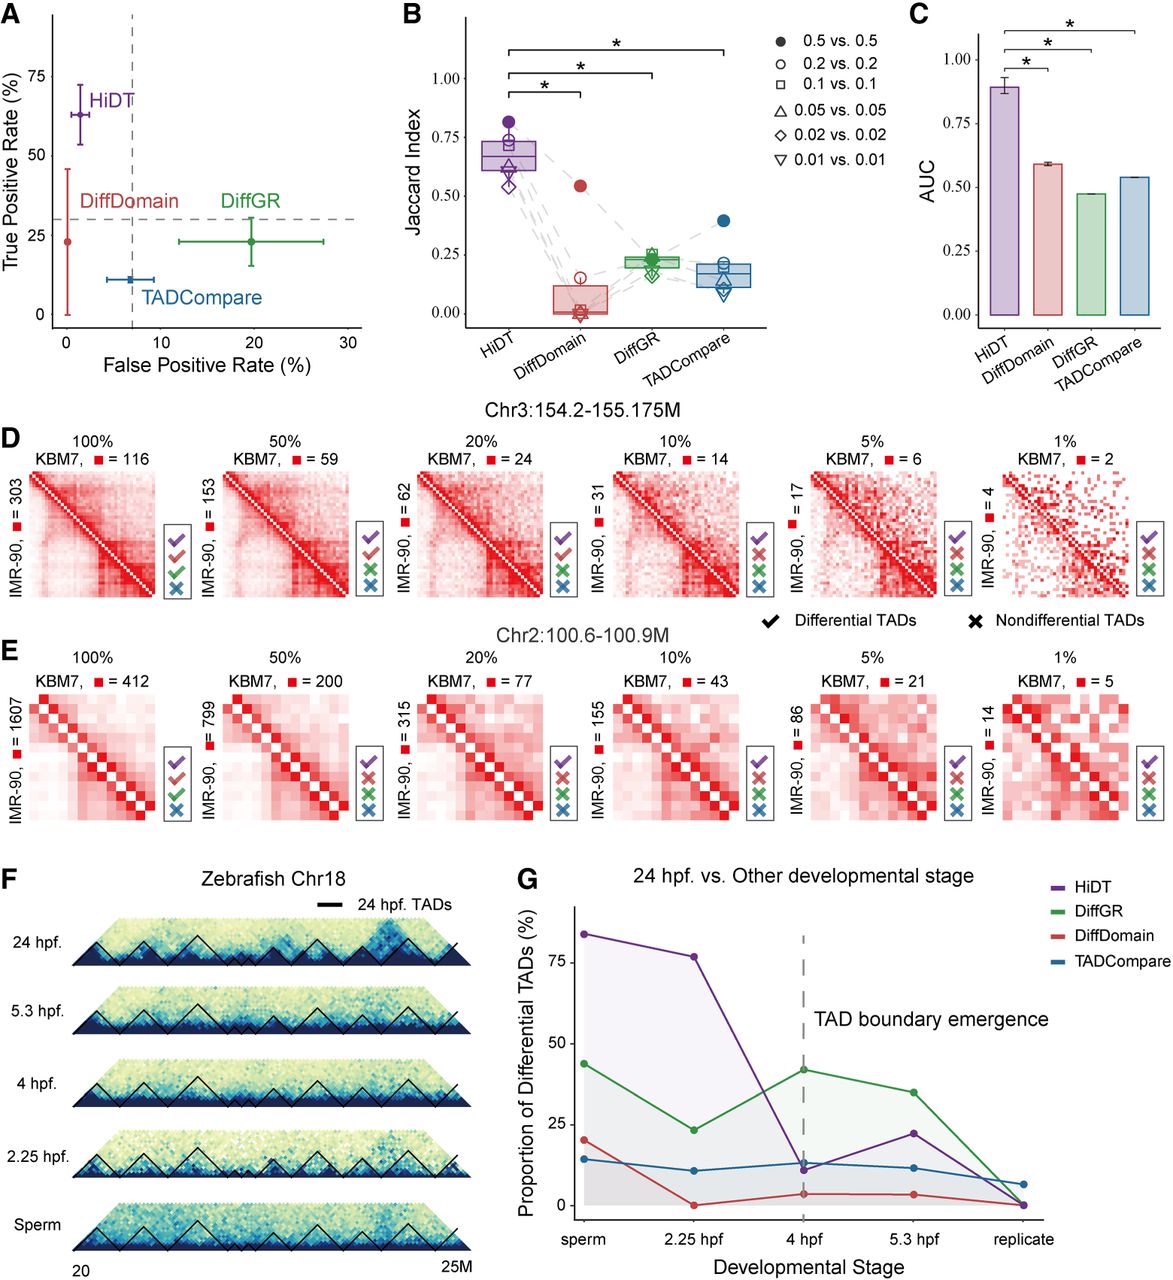
In addition, we evaluated the performance of each method in a different species using zebrafish data across five developmental stages: sperm, 2.25 h postfertilization (hpf), 4 hpf, 5.3 hpf, and 24 hpf (Wike et al. 2021). This data set provides a biologically informative test case because previous studies have shown that TAD boundaries begin to emerge around 4 hpf and become well established by 24 hpf (Fig. 3F; Wike et al. 2021). The Hi-C contact maps from these samples are relatively sparse, with each sample containing about 50 million intrachromosomal contacts and the proportion of zero interactions within TAD regions ranging from 3.85% to 25.96% (Supplemental Table S2). To assess biological relevance, we used the 24 hpf sample as condition 1 and each of the earlier-stage samples as condition 2, while using the comparisons between 24 hpf replicates to estimate the FPR. HiDT, DiffGR, and DiffDomain all showed good control of FPR, with rates <1%. Notably, HiDT identified a high proportion of differential TADs in the early stages before the formation of TADs (e.g., 80.6% at 2.25 hpf) and a markedly lower proportion after TADs start to form (e.g., 23.3% at 5.3 hpf), consistent with expected developmental dynamics. In contrast, the other methods reported relatively uniform proportions of differential TADs across all stages, including those in which TAD boundaries had not yet formed (Fig. 3G).
Together, these results demonstrate that HiDT generalizes well across diverse cellular contexts and species, maintaining robust performance on low-depth contact maps. Notably, HiDT effectively captures biologically meaningful 3D genome changes from low-depth Hi-C contact maps, enabling the detection of dynamic TAD reorganization across developmental stages.
Identification of differential TADs between normal, primary tumor, and metastatic tissues
To demonstrate the utility of HiDT in identifying differential TADs from low sequencing depth contact maps, we applied it to a low-depth Hi-C data set derived from eight colorectal cancer (CRC) patients. The data set included paired normal colon and primary tumor tissues from all patients, metastatic liver tissues from five patients, and one matched normal liver tissue (Supplemental Fig. S12A; Xu et al. 2025).
We compared normal with primary tumor tissues and, when data were available, normal with metastatic tumor tissues. DiffDomain detected no differential TADs, whereas DiffGR and TADCompare identified similar proportions across samples. HiDT detected differential TADs in all comparisons, with proportions varying across patients and tissue comparisons (Fig. 4A).
Identification of differential TADs between normal, primary, and metastatic colorectal cancer (CRC) tissues. (A) Proportions of differential TADs identified in normal versus primary tumor and normal versus metastatic tumor comparisons. (B) Proportions of differential and nondifferential TADs containing no DEGs or at least one DEG. Each point represents one patient pair. Statistical significance was assessed using a Wilcoxon signed-rank test: (**) P < 0.01, (NS) nonsignificant. (C) Overlap between differential TADs and CRC metastasis-associated genes in patients with and without metastasis. (D) A differential TAD in patient P05 overlapping a deletion and containing FHIT. (E) Proportions of SVs that overlapped differential TADs across eight normal versus primary tumor comparisons. Error bars indicate standard deviations. (F) Differential TADs and SVs in normal versus primary tumor and normal liver versus metastatic liver comparisons. (G,H) Differential TADs associated with DEGs in patient P02 for normal versus primary tumor and normal liver versus metastasis, respectively. (RPM) Reads per million. (I) GO enrichment of genes within comparison-specific differential TADs in patient P02.
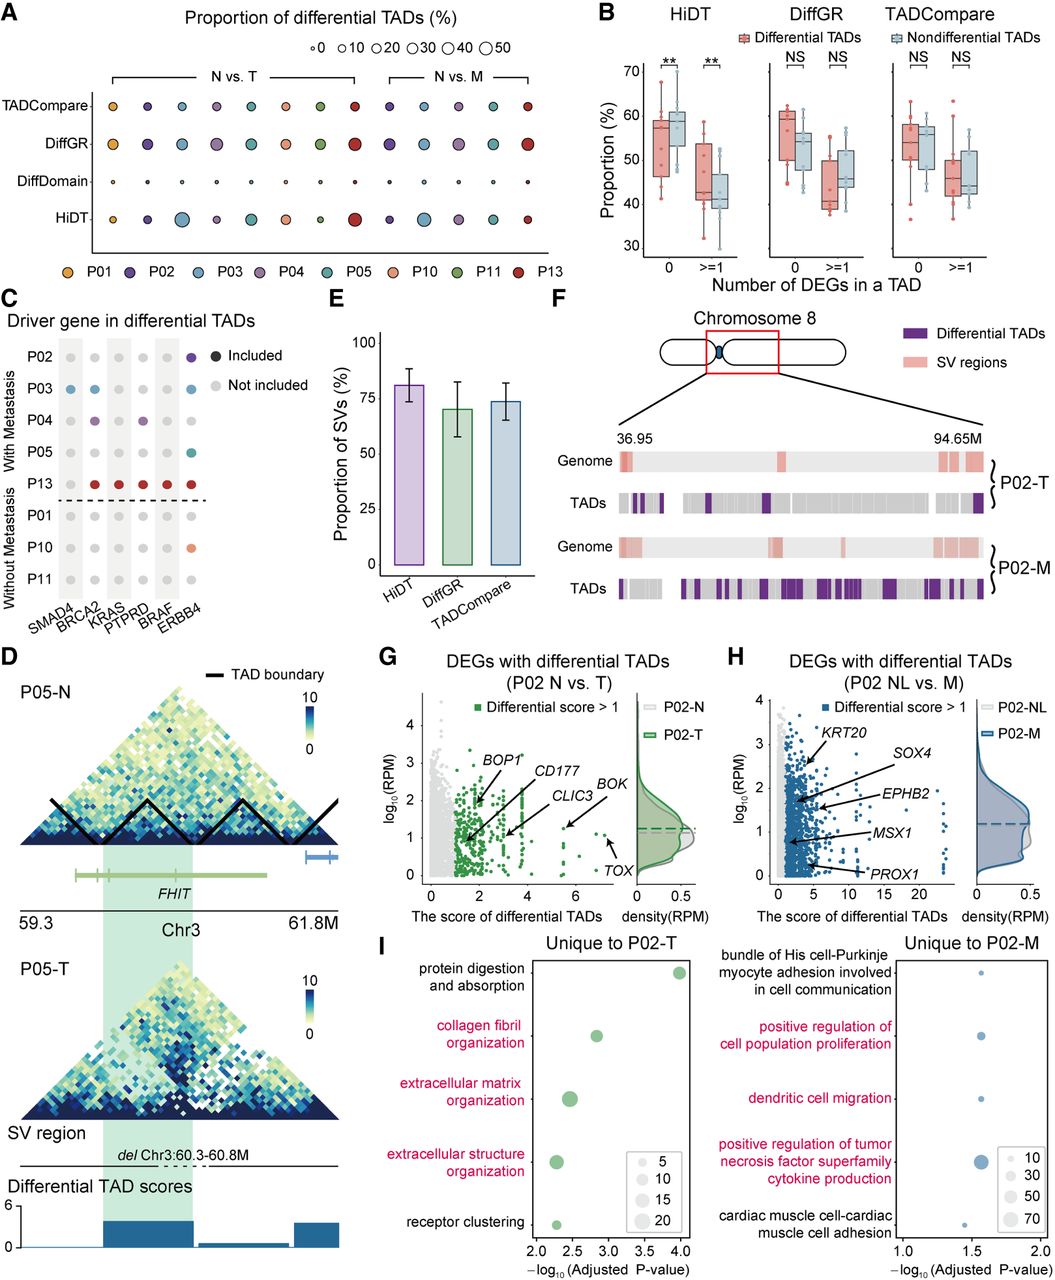
To evaluate the biological relevance of the detected differential TADs, we next examined their association with DEGs. Differential TADs identified by HiDT showed significantly greater DEG overlap compared with nondifferential TADs. In contrast, this enrichment pattern was not observed for DiffGR or TADCompare (Fig. 4B). These results suggest that differential TADs detected by HiDT are more closely associated with transcriptional alterations. Representative differential TADs in patients P02 and P03 contained multiple CRC-related genes, including IFITM1, IFITM3 (Kelemen et al. 2021), CXCL2, and CXCL3 (Supplemental Fig. S12B; Zhou et al. 2023).
To further assess potential clinical relevance, we grouped samples by metastatic status and examined whether differential TADs between normal and tumor tissues were enriched for genes previously implicated in CRC liver metastasis (Chu et al. 2017; Huang et al. 2018). Notably, differential TADs from metastatic patients consistently contained more of these known metastasis-associated genes compared with those from nonmetastatic patients (Fig. 4C; Supplemental Fig. S12C).
Furthermore, we investigated the impact of structural variations (SVs) on differential TADs. Most SV regions identified in primary tumors overlapped differential TADs from normal versus tumor comparisons (Supplemental Fig. S12D). In patient P05, a deletion at Chr 3:60.3–60.8 Mb overlapped a differential TAD containing the oncogene FHIT (Fig. 4D; Wierzbicki et al. 2009). Among the three methods, HiDT showed the highest proportion of SV regions overlapping differential TADs (Fig. 4E).
To gain further insight into tumor progression, we performed a more detailed comparative analysis of differential TADs between primary and metastatic tissues. For patient P02, we identified 409 differential TADs between normal and primary tumor tissues and 779 between normal liver and metastatic tissues, with 114 shared between the two comparisons (Supplemental Fig. S12E). Many shared differential TADs occurred in regions affected by the same SVs. The metastatic tissue contained more SVs compared with the primary tumor, which may contribute to the greater number of differential TADs in the metastatic comparison (Fig. 4F; Supplemental Fig. S12F). Differential TADs in the primary tumor comparison contained oncogenes such as CD177 and TOX (Fig. 4G), whereas those in the metastatic comparison also contained metastasis-associated genes, including SOX4 and MSX1 (Fig. 4H; Supplemental Fig. S12G; Moorman et al. 2025). We further performed gene set enrichment analysis on DEGs located within unique differential TADs from each comparison. DEGs within primary tumor–specific differential TADs were enriched in extracellular matrix organization, whereas those within metastasis-specific differential TADs were enriched in cell migration, proliferation, and immune regulation (Fig. 4I).
Overall, these results indicate that HiDT can robustly identify differential TADs from low sequencing depth Hi-C data and capture biologically and clinically relevant 3D genome reorganization events, including those associated with oncogenes, SVs, and cancer progression.
Identification of haplotype-specific differential TADs
To further demonstrate the utility of HiDT in detecting differential TADs from low sequencing depth contact maps, we applied it to haplotype-specific Hi-C data from GM12878. Although the combined maternal and paternal data are deeply sequenced, haplotype-resolved maps are sparse because only reads overlapping informative SNPs can be assigned to each haplotype (Zhang et al. 2022). The paternal and maternal maps contained 142.2 million and 141.2 million intrachromosomal contacts across Chromosomes 1 through X, respectively.
HiDT identified 75 haplotype-specific differential TADs, accounting for 4.7% of all TAD pairs, whereas DiffDomain, DiffGR, and TADCompare identified, respectively, 1.7%, 2.2%, and 5.6% of TADs as differential (Fig. 5A). Because GM12878 is a female cell line in which one X Chromosome undergoes inactivation and becomes the inactive X Chromosome (Xi), pronounced haplotype-specific differences are biologically expected on Chromosome X (Giorgetti et al. 2016). Consistent with this expectation, 84.7% of TADs on Chromosome X were identified as differential by HiDT compared with 0%, 14.9%, and 9.0% for DiffDomain, DiffGR, and TADCompare, respectively (Fig. 5B). Notably, one differential TAD spanned the X-inactivation center and contained XIST and TSIX, key regulators of X-inactivation (Fig. 5C; Chaumeil et al. 2006).
Identification of haplotype-specific differential TADs in GM12878. (A) Proportions of differential TADs identified between the paternal and maternal haplotypes. (B) Proportions of differential TADs on Chromosome X. (C) Example of a differential TAD encompassing TSIX and XIST. (D) Proportions of differential and nondifferential TADs containing no allele-specific genes or at least one allele-specific gene. (E) Example of a differential TAD containing the allele-biased gene TBL1X. (F) Single-cell Hi-C maps of the TBL1X TAD in maternal and paternal haplotypes, with RNA Pol II ChIA–PET interactions circled. (G) A differential TAD overlapping a maternal-specific deletion (Chr 22: 22,544,651–23,244,244), which includes the gene IGLL5. (H) Hi-C, RNA Pol II ChIA–PET, ChIP-seq, and RNA-seq signals at the IGLL5 locus visualized using the WashU Epigenome Browser (Li et al. 2022). (I) Single-cell Hi-C maps of the differential TAD across multiple cells, with ChIA–PET interactions circled.
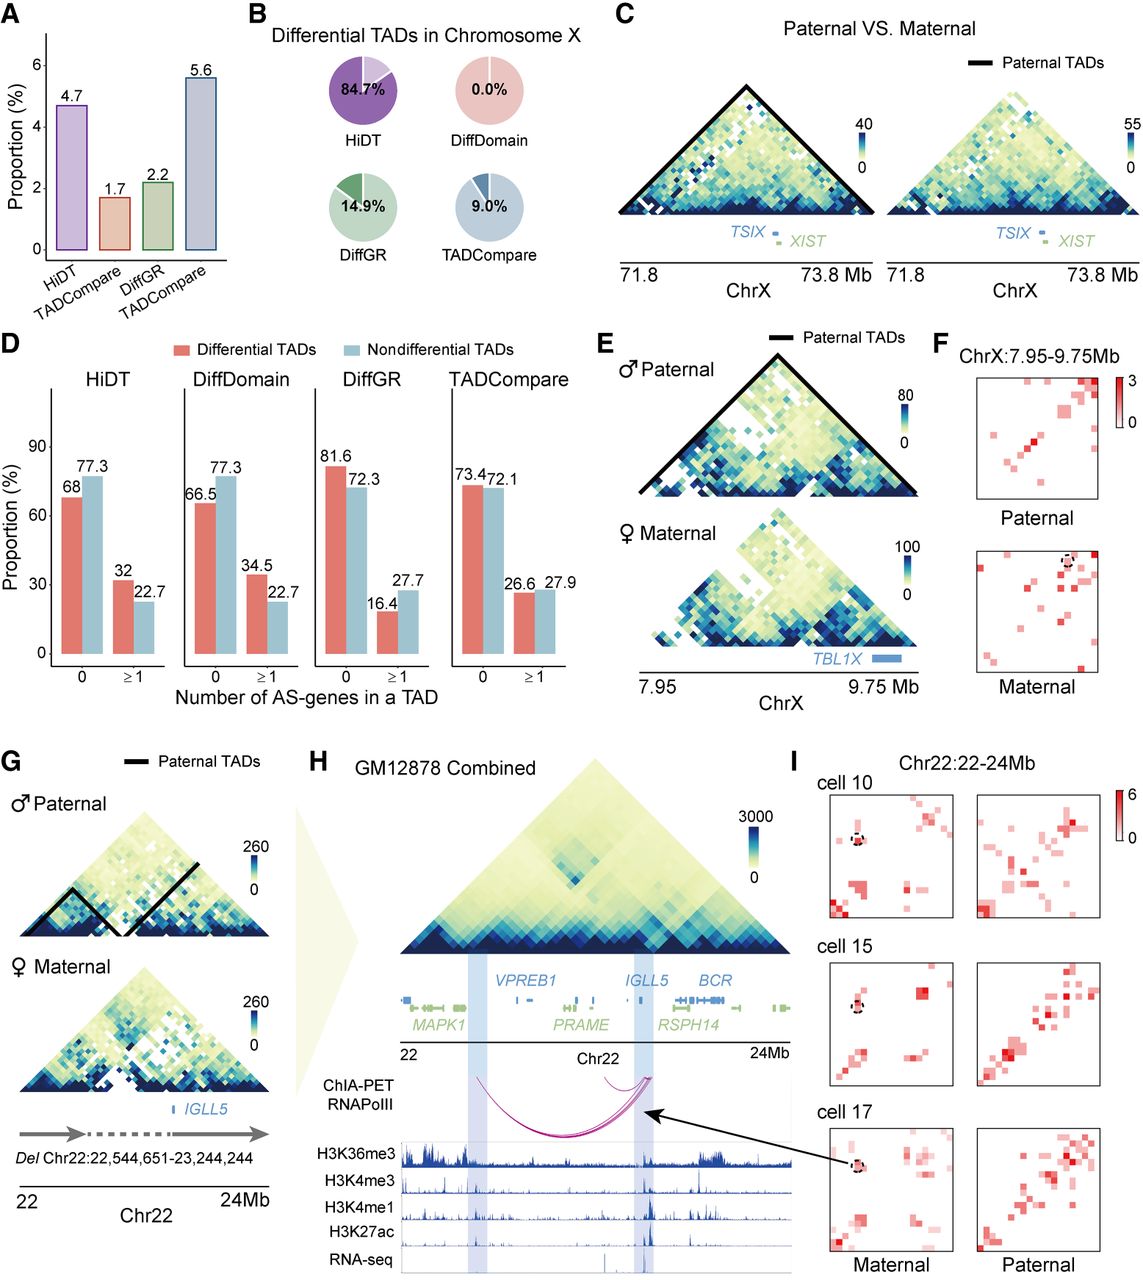
Differential TADs identified by HiDT were significantly enriched for allele-specific chromatin loops compared with nondifferential TADs (Supplemental Fig. S13A,B). They also showed greater overlap with allele-specific gene expression. A similar trend was observed for DiffDomain but not for DiffGR or TADCompare (Fig. 5D). For example, one differential TAD contained the allele-biased gene TBL1X (Fig. 5E). In diploid GM12878, RNA Pol II ChIA–PET data showed a promoter–enhancer interaction linking TBL1X to a distal region marked by H3K27ac and H3K4me1 (Supplemental Fig. S13C). This interaction was observed in maternal but not in paternal haploid single-cell Hi-C maps, supporting maternal-specific chromatin organization at this locus (Fig. 5F).
Two differential TADs also overlapped reported haplotype-specific SVs, including a paternal-specific inversion on Chromosome 2 and a maternal-specific deletion on Chromosome 22 (Supplemental Fig. S13D; Fig. 5G). The deletion contains IGLL5, an immunoglobulin lambda–like gene involved in B cell development, which is highly expressed in diploid GM12878. RNA Pol II ChIA–PET data revealed an interaction between the IGLL5 promoter and a distal enhancer-marked region (Fig. 5H). This interaction was consistently observed in maternal haploid cells but was rare or absent in paternal cells (Fig. 5I; Supplemental Fig. S13E), suggesting allele-specific regulation associated with the deletion.
Together, these results demonstrate the biological significance of the differential TADs identified by HiDT. They reflect the expected large-scale structural divergence between the inactive and active X Chromosomes, overlap known haplotype-specific SVs, and include regions associated with allele-specific gene regulation. These findings underscore HiDT's ability to detect haplotype-specific differential TADs from sparse contact maps and reveal functionally relevant allele-specific 3D genome organization.
Identification of cell subtype–specific differential TADs
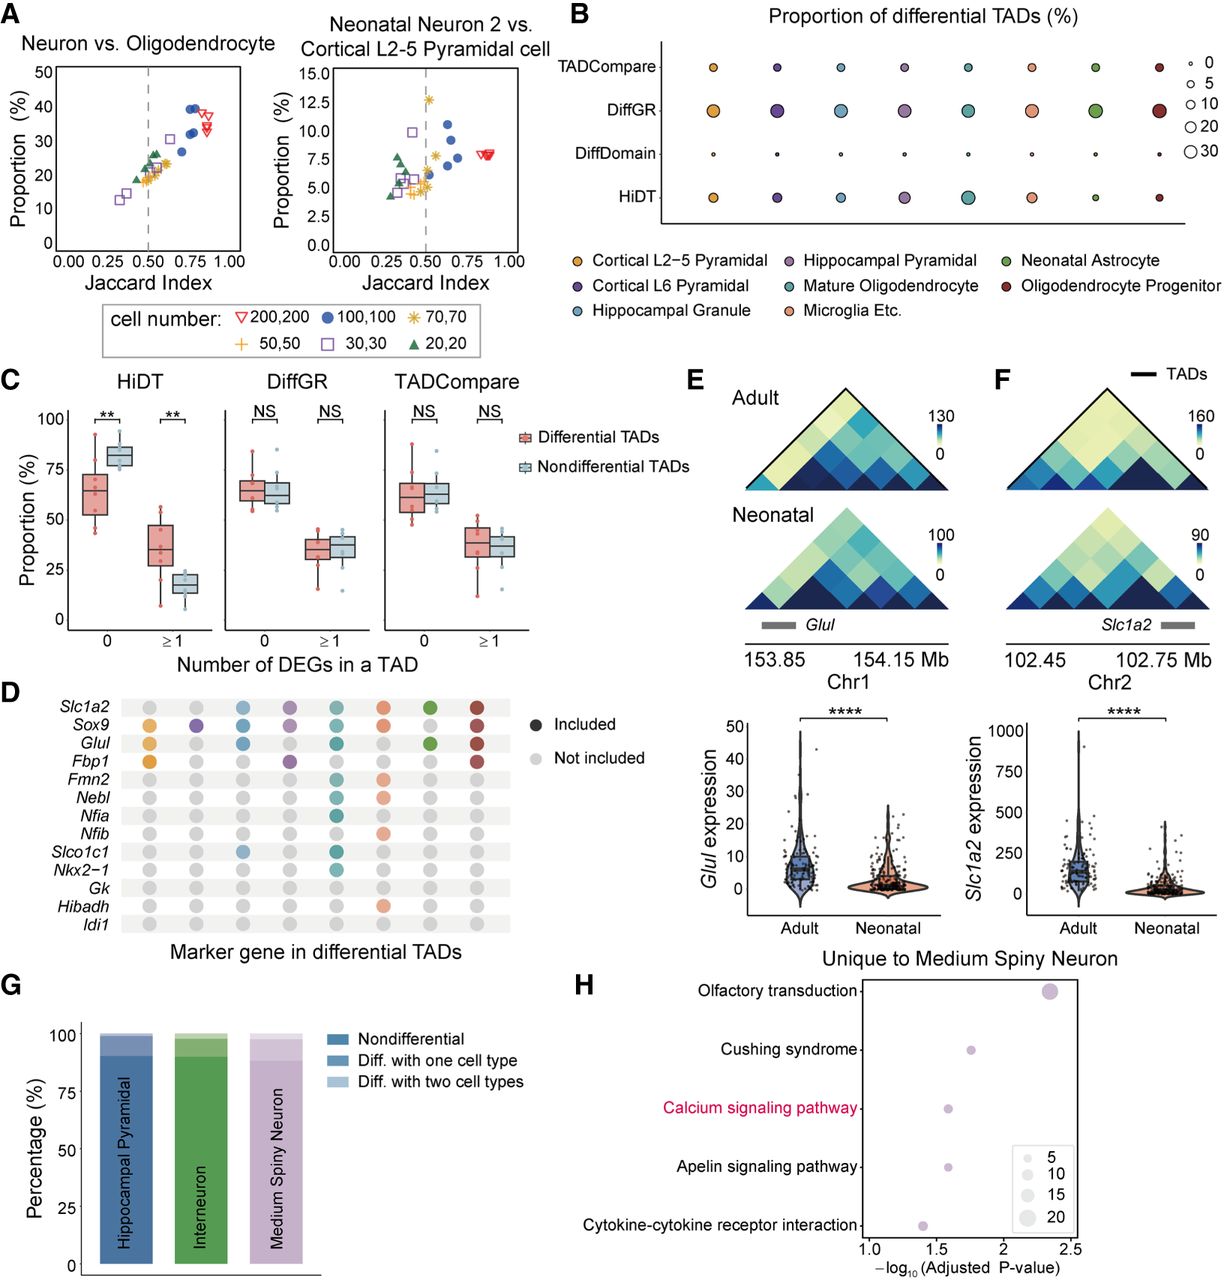
To demonstrate the utility of HiDT for sparse single-cell contact maps, we applied it to single-cell Hi-C data from the mouse cortex and hippocampus generated using Dip-C (Tan et al. 2021). We first evaluated the number of cells required for reliable differential TAD detection using aggregated pseudobulk Hi-C maps (Methods) (Supplemental Fig. S14A). We found that aggregating as few as 70 cells generally allowed HiDT to identify differential TADs with reasonable consistency, as most comparisons yielded Jaccard index values greater than 0.5 (Fig. 6A; Supplemental Fig. S14B).
Identification of differential TADs across cell subtypes from mouse brain single-cell Hi-C data. (A) Proportions and Jaccard indices of differential TADs identified from increasing numbers of sampled cells for neurons versus oligodendrocytes and neonatal neuron 2 versus cortical L2–5 pyramidal cells. Five replicates are shown for each cell number, and the dashed line marks a Jaccard index of 0.5. (B) Proportions of differential TADs identified across brain cell types. (C) Proportions of differential and nondifferential TADs containing no DEGs or at least one DEG. Statistical significance was assessed using a Wilcoxon signed-rank test: (**) P < 0.01. (D) Astrocyte marker genes that are located within differential TADs. (E,F) Differential TADs containing Glul and Slc1a2 between adult and neonatal astrocytes, with corresponding single-cell expression levels. Statistical significance was evaluated using a two-sided paired t-test: (****) P < 0.0001. (G) Proportion of differential TADs identified among hippocampal pyramidal, interneurons, and medium spiny neurons. Differential TADs are categorized as being specific to one subtype or shared across two subtypes. (H) GO enrichment of genes within differential TADs shared between the medium spiny neuron comparisons.
We next compared merged single-cell Hi-C maps from six developmental stages (P001, P007, P028, P056, P309, and P347). Using P347 as the reference, HiDT identified more differential TADs between P347 and earlier stages and fewer between P347 and the later stages P056 and P309 (Supplemental Fig. S14C). DiffDomain detected no differential TADs, whereas DiffGR and TADCompare identified similar proportions across stages, showing limited sensitivity to developmental progression.
We further analyzed differential TADs among cell subtypes (Supplemental Table S3), using adult astrocytes as the reference. The proportion of differential TADs varied markedly across comparisons. Neonatal astrocytes, which are closely related to adult astrocytes, showed only 2.4% differential TADs, compared with 35.3% in mature oligodendrocytes. DiffDomain detected no differential TADs, whereas DiffGR and TADCompare produced similar proportions across subtypes, with limited discrimination between closely related and distinct cell types (Fig. 6B).
We next examined the functional relevance of these differential TADs using matched scRNA-seq data from eight samples. Only HiDT showed greater DEG overlap in differential TADs than in nondifferential TADs (Fig. 6C). In addition, many differential TADs overlapped known astrocyte marker genes (Fig. 6D). For example, Sox9 was located within differential TADs in all comparisons except the comparison involving neonatal astrocytes and showed higher expression in adult astrocytes (Supplemental Fig. S14D,E). HiDT also identified differential TADs between adult and neonatal astrocytes containing Glul and Slc1a2, two mature astrocyte markers (Lattke et al. 2021), both of which showed significantly higher expression in adult astrocytes (Fig. 6E,F). Additional subtype-specific differential TADs contained neural-related genes, including Lrrtm1, Ctnna2, Aplp1, and Kirrel2 (Supplemental Fig. S14F).
We then performed pairwise comparisons among hippocampal pyramidal cells, interneurons, and medium spiny neurons. Approximately 10% of TADs were differential in each comparison, and ∼2% were consistently differential in both comparisons involving the same subtype (Fig. 6G). Functional enrichment of genes within these shared differential TADs revealed pathways associated with known subtype functions, such as the calcium signaling pathway in medium spiny neurons (Fig. 6H; Carter and Sabatini 2004). Between cortical L2–5 and cortical L6 pyramidal cells, HiDT identified 73 differential TADs (2.7%) (Supplemental Fig. S14G). These differential TADs showed significantly greater DEG overlap than nondifferential TADs and included Tafa2 and Gm43946 (Supplemental Fig. S14H,I).
These results demonstrate that HiDT effectively identifies differential TADs from pseudobulk Hi-C maps derived from single-cell Hi-C data across diverse biological contexts, including developmental progression and cell subtypes. By capturing TAD-level changes associated with marker genes and differentially expressed genes, HiDT highlights its utility in revealing cell-type-specific and subtype-specific 3D genome reorganization.
Discussion
HiDT formulates the identification of differential TADs as a graph similarity problem on weighted graphs constructed from TAD pairs. By leveraging a GNN, HiDT quantitatively evaluates structural differences between graph pairs to detect differential TADs. Extensive evaluations on Hi-C data sets from multiple cell lines and species demonstrate that HiDT consistently outperforms existing methods, particularly in low sequencing depth samples.
The superior performance of HiDT can be attributed to three key innovations. First, the use of an attention-based edge-enhanced GNN layer enables the model to effectively exploit edge features, enabling a more accurate representation of weighted TAD graphs compared with traditional GCN or GAT layers. Second, to ensure robustness across data sets of varying sequencing depths, we constructed the training sets using Hi-C samples with a range of sequencing depths. A depth-specific normalization layer was further introduced to scale node features appropriately, enhancing the model's generalizability.
Importantly, the robust performance of HiDT on sparse contact maps extends its applicability. In addition to identifying differential TADs from high-sequencing depth samples, HiDT can be applied to sparse and noisy samples such as haplotype-specific contact maps and single-cell Hi-C data sets. Specifically, we demonstrated its utility in identifying differential TADs between maternal and paternal haplotypes; among normal tissues, primary tumor tissues, and metastatic tissues with low sequencing depth; and among distinct neuronal subtypes in the mouse brain. Notably, the differential TADs identified by HiDT under these diverse conditions are significantly enriched for biologically meaningful features, including haplotype-specific SVs, tumor oncogenes, and DEGs between cellular subtypes. These results highlight HiDT's ability to identify biologically relevant differential TADs across diverse biological conditions, making it a powerful tool for investigating the relationship between 3D genome organization and gene regulation.
Despite these encouraging results, the generalizability of HiDT remains an important limitation of the current framework. In practice, data sets generated by different protocols or from different species may differ substantially in interaction distributions, distance-decay patterns, and domain-scale structural features, which may reduce model performance when the target data deviate markedly from the training data. This limitation may be more relevant for chromatin conformation capture technologies with interaction profiles that differ more markedly from conventional Hi-C, as well as for species with distinct genome organization patterns.
In addition, the current training labels were constructed using high sequencing depth Hi-C data sets and consensus results from multiple existing methods. Although this strategy was adopted to provide more reliable supervision for model training, it may still introduce bias toward patterns captured by current methods and could limit the ability of HiDT to identify certain novel or previously unannotated forms of differential TADs.
In the future, HiDT could be improved in several directions. First, model generalizability could be improved by training on more diverse data sets spanning different protocols and species or by integrating representations derived from multiple data types to better accommodate heterogeneous contact map properties. Second, the dependence on existing differential TAD callers for training label construction could be reduced by incorporating more biologically motivated supervision, such as RNA-seq, ChIP-seq, or other functional genomic evidence associated with differential TADs. In addition, incorporating more explicit feature selection or regularization strategies may improve interpretability and help better identify the contacts or graph features most relevant to differential TAD identification.
Methods
Availability of data and materials
All data sets used in this study are publicly available. The Hi-C training samples for the HiDT model are listed in Supplemental Table S4. Bulk Hi-C data from the IMR-90 and KBM7 cell lines were downloaded from the 4D Nucleome Data Portal under accession numbers 4DNES1ZEJNRU and 4DNESDEK4IH8, respectively. Haplotype-resolved Hi-C data for the GM12878 cell line were obtained from the NCBI Gene Expression Omnibus (GEO; https://www.ncbi.nlm.nih.gov/geo/) database under accession number GSE167200. Zebrafish Hi-C data at different developmental stages, including sperm, 2.25 hpf, 4 hpf, 5.3 hpf, and 24 hpf, were downloaded from the 4D Nucleome Portal under accession numbers 4DNES4G1HPQC, 4DNESGHJXSRM, 4DNESG4K7J7U, 4DNESTJOLVFJ, and 4DNES9YQ1GX9. Single-cell Dip-C Hi-C data and MALBAC-DT single-cell RNA-seq data from various mouse brain cell types were downloaded from the GEO database under accession numbers GSE162511 and GSE162509, respectively. CRC patients’ Hi-C and matched RNA-seq data sets, including normal, primary tumor, and metastatic liver tissues, were obtained from the BIGD database under accession number HRA000417.
The implementation of HiDT
For each candidate TAD region, we construct two graphs, G1 and G2, representing the local 3D chromatin structure under the reference and comparison conditions, respectively. In each graph, nodes correspond to genomic bins (vi and vj) and edge weights represent KR-normalized (Knight and Ruiz 2013; Rao et al. 2014) contact frequencies between bins. Given a pair of weighted TAD graphs and a node attribute matrix initialized as all-one vectors , where N is the number of genomic bins and din = 8 is the feature dimension used in this study, we first apply doubly stochastic normalization (Gong and Cheng 2019) to the edge weights to ensure that both row and column sums are equal to one. The normalized edge weight E is produced as follows:
In the next step, we incorporate a depth-specific normalization layer (Xu et al. 2024) to adjust node feature representations according to varying sequencing depth levels. Each input sample is assigned a discrete sequencing depth level D ∈ {0, 1, 2, 3, 4, 5, 6, 7}, and the normalization layer applies level-specific scaling and bias parameters to each node embedding. Specifically, for each node i the embedding is normalized using the corresponding depth level Di as follows:
Then, we employ an aggregation module with a gating mechanism (Li et al. 2019) to compute a graph-level representation based on a set of node representations as input. The graph representation is defined as below:
Finally, we use a margin-based pairwise loss function (Li et al. 2019) that maximizes the feature distance between positive pairs (differential TADs) and minimizes it for negative pairs (nondifferential TADs). The loss is defined as
To identify differential TADs in a novel sample pair, HiDT splits the contact matrices into submatrices according to the provided TAD boundaries. HiDT then calculates the graph embedding for each submatrix pair and computes the Euclidean distance between them. TAD pairs with distances greater than a cutoff of one are classified as differential. The same cutoff and parameter settings were used across all data sets in this study.
Training samples
The training data set consists of positive and negative TAD pairs, defined based on consistent TAD boundary identification and differential TAD annotation (as described in the Overview of HiDT section). High-confidence differential and nondifferential TADs were defined as those identified by at least two out of three differential TAD detection methods: DiffDomain (Hua et al. 2024), TADCompare (Cresswell and Dozmorov 2020), and DiffGR (Liu and Ma 2024). TAD boundaries were determined as the genomic locations in which at least three of the methods, including IS (Crane et al. 2015), DI (Dixon et al. 2012), Arrowhead (Rao et al. 2014), and TopDom (Shin et al. 2016), produced consistent results.
To ensure the reliability of TAD boundary and differential TAD calls, we used high-quality GM12878 and K562 samples with 3.87 billion and 906.9 million total contacts, respectively, at 25 kb resolution (including 2.9 billion and 678 million intrachromosomal contacts). To improve robustness across sequencing depths, the training data set included GM12878 and K562 samples spanning a broad range of depth levels. Specifically, GM12878 replicates ranged from 38.7 million to 3.87 billion total contact pairs (28.5 million to 2.9 billion intrachromosomal contacts; 0.18% to 33.51% zero interactions within TAD regions), and K562 replicates ranged from 44.1 million to 906.9 million total contact pairs (33.9 million to 678 million intrachromosomal contacts; 0.99% to 22.94% zero interactions within TAD regions). Each cell line comprised 10 replicates. Samples were partitioned by chromosome, with Chromosomes 1–17 used for training, Chromosome 18 for validation, and Chromosomes 19–X used for testing and benchmarking. Under this scheme, the training set comprised 16,280 positive samples and 17,290 negative samples. Further details on sequencing depths are provided in Supplemental Table S4.
Sequencing depth–level categorization
Because the training samples span a wide range of sequencing depths, we included sequencing depth as an additional feature to reduce depth-related variation in feature representations. Samples were assigned to eight levels based on total contact pairs: 0–50 million, 50–100 million, 100–200 million, 200–300 million, 300–400 million, 400–650 million, 650–900 million, and >900 million.
Establishing high-confidence TAD sets for evaluating method performance
High-confidence differential TADs were defined as those identified by at least two of the four methods (HiDT, DiffDomain, DiffGR, and TADCompare) at full sequencing depth, whereas high-confidence nondifferential TADs were those classified as nondifferential by all four methods. These sets were used to calculate FPR, TPR, and AUC for predictions from downsampled data sets. The Jaccard index measured agreement between differential TADs identified from downsampled data and those identified by the same method at full depth.
Hi-C sample processing and downsampling
Hi-C contact matrices were KR normalized using Juicer Tools (Durand et al. 2016) with the addNorm option, followed by row-wise normalization so that each row summed to one. To generate data sets at different sequencing depths, the original COOL files were downsampled using the random-sample function in cooltools (Open2C et al. 2024), which randomly samples pixel counts according to the specified retained fraction using binomial sampling. The hictk tool (Rossini and Paulsen 2024) was used for conversion between HIC and COOL formats.
SV identification from Hi-C data
SVs were identified from Hi-C data using EagleC (Wang et al. 2022) with predictSV-single-resolution at 50 kb resolution and prob-cutoff = 0.8. Because EagleC reports SV breakpoints rather than complete SV regions, NeoLoopFinder (Wang et al. 2021) was used to identify the corresponding second breakpoint and define the full SV region.
Determining the cell number threshold for differential TAD identification in scHi-C data
Following the strategy used in DiffDomain (Hua et al. 2024), increasing numbers of cells from each cell type were randomly sampled and aggregated into pseudobulk Hi-C maps, with five independent replicates at each cell number. Differential TADs identified between the two cell types were compared with those obtained using all available cells as the reference. This analysis was performed for neurons versus oligodendrocytes and neonatal neuron2 versus cortical L2–5 pyramidal cells.
Single-cell Hi-C data processing
scHi-C contact pairs were downloaded from GEO accession number GSE162511, and low-read cells were filtered out. Cells were grouped by the published cell-type annotations, and their contact pairs were merged to generate pseudobulk data sets. Juicer Tools (Durand et al. 2016) was used with the pre command to create 50 kb HIC files containing only intrachromosomal interactions.
TAD boundary identification
TAD callers were selected according to sequencing depth and structural scale. For the high-quality bulk Hi-C data sets from GM12878 and IMR-90, TADs were identified using DI (Dixon et al. 2012) at 25 kb and 50 kb resolutions, respectively. To assess robustness to different TAD callers, IS (Crane et al. 2015) was also applied to GM12878 at 25 kb resolution. Hierarchical TADs and subTADs were identified using HiTAD (Wang et al. 2017) at 10 kb resolution. For pseudobulk Dip-C data, deDoc (Li et al. 2018) was used at 50 kb because it is suitable for sparse contact maps. Haplotype-resolved GM12878 and CRC samples were analyzed using deDoc2 (Li et al. 2023) at 50 kb, as deDoc could not be successfully applied to these data sets. For deDoc and deDoc2, high-level TADs were retained. The resulting boundaries were used to partition the contact maps into submatrices for differential TAD analysis.
Identification and functional analysis of DEGs
DEGs between cell types in the Dip-C data set were identified using Seurat (Hao et al. 2024), with adjusted P < 0.05 and |logFC| > 0.25. DEGs in tumor samples were identified using DESeq2 (Love et al. 2014) with adjusted P < 0.05 and |logFC| > 1. For P02, which lacked biological replicates, DEGs between P02-N and P02-T and between P02-NL and P02-M were defined using |logFC| > 1. Gene Ontology (GO) analysis was performed with GSEApy (Fang et al. 2023), and terms with adjusted P < 0.05 and more than five genes were retained.
Code availability
The software package implementing the HiDT algorithm has been deposited on GitHub (https://github.com/GaoLabXDU/HiDT) and as Supplemental Code. The data sets used in this study, together with the scripts used to analyze them, are available on Zenodo (https://doi.org/10.5281/zenodo.19511984).
Competing interest statement
The authors declare no competing interests.
Acknowledgments
We thank R. Jiang for helpful discussions and the Key Laboratory of Computational Bioinformatics of Xi'an at Xidian University for their support. We also thank X. Xu and L. Lin at the Academy of Military Medical Sciences for generously providing processed data. This work was supported by the National Natural Science Foundation of China (NSFC) grant no. 62550005, no. 62132015 and U22A2037 to L.G., no. 62573335 to Y.Y., no. 62302386 to J. Lin, and no. 62422318 to H.C. This work was also supported by the Natural Science Foundation of Shaanxi Province (Category B, grant no. 2026JC-YXQN-219 to Y.Y.).
Author contributions: J. Li conceived and designed the study. J. Li and H.X. developed HiDT. Y.Y. and L.G. provided additional input during method development. J. Li performed the data analyses with helpful comments from H.C. and J. Lin. J. Li, Y.Y., and L.G. wrote the manuscript.
Footnotes
[1] Supplementary material [Supplemental material is available for this article.]
[2] Article published online before print. Article, supplemental material, and publication date are at https://www.genome.org/cgi/doi/10.1101/gr.281535.125.
[3] Freely available online through the Genome Research Open Access option.
References
- ↵Akdemir KC, Le VT, Chandran S, Li Y, Verhaak RG, Beroukhim R, Campbell PJ, Chin L, Dixon JR, Futreal PA, 2020. Disruption of chromatin folding domains by somatic genomic rearrangements in human cancer. Nat Genet 52: 294–305. 10.1038/s41588-019-0564-y
- ↵Álvarez-González L, Arias-Sardá C, Montes-Espuña L, Marín-Gual L, Vara C, Lister NC, Cuartero Y, Garcia F, Deakin J, Renfree MB, 2022a. Principles of 3D chromosome folding and evolutionary genome reshuffling in mammals. Cell Rep 41: 111839. 10.1016/j.celrep.2022.111839
- ↵Álvarez-González L, Burden F, Doddamani D, Malinverni R, Leach E, Marín-García C, Marín-Gual L, Gubern A, Vara C, Paytuví-Gallart A, 2022b. 3D chromatin remodelling in the germ line modulates genome evolutionary plasticity. Nat Commun 13: 2608. 10.1038/s41467-022-30296-6
- ↵An L, Yang T, Yang J, Nuebler J, Xiang G, Hardison RC, Li Q, Zhang Y. 2019. OnTAD: hierarchical domain structure reveals the divergence of activity among TADs and boundaries. Genome Biol 20: 282. 10.1186/s13059-019-1893-y
- ↵Bonev B, Cavalli G. 2016. Organization and function of the 3D genome. Nat Rev Genet 17: 661–678. 10.1038/nrg.2016.112
- ↵Carter AG, Sabatini BL. 2004. State-dependent calcium signaling in dendritic spines of striatal medium spiny neurons. Neuron 44: 483–493. 10.1016/j.neuron.2004.10.013
- ↵Chaumeil J, Le Baccon P, Wutz A, Heard E. 2006. A novel role for Xist RNA in the formation of a repressive nuclear compartment into which genes are recruited when silenced. Genes Dev 20: 2223–2237. 10.1101/gad.380906
- ↵Chen M, Zhu Q, Li C, Kou X, Zhao Y, Li Y, Xu R, Yang L, Yang L, Gu L, 2020. Chromatin architecture reorganization in murine somatic cell nuclear transfer embryos. Nat Commun 11: 1813. 10.1038/s41467-020-15607-z
- ↵Chu S, Wang H, Yu M. 2017. A putative molecular network associated with colon cancer metastasis constructed from microarray data. World J Surg Oncol 15: 115. 10.1186/s12957-017-1181-9
- ↵Crane E, Bian Q, McCord RP, Lajoie BR, Wheeler BS, Ralston EJ, Uzawa S, Dekker J, Meyer BJ. 2015. Condensin-driven remodelling of X chromosome topology during dosage compensation. Nature 523: 240–244. 10.1038/nature14450
- ↵Cresswell KG, Dozmorov MG. 2020. TADCompare: an R package for differential and temporal analysis of topologically associated domains. Front Genet 11: 158. 10.3389/fgene.2020.00158
- ↵Dang D, Zhang S-W, Dong K, Duan R, Zhang S. 2025. Uncovering topologically associating domains from three-dimensional genome maps with TADGATE. Nucleic Acids Res 53: gkae1267. 10.1093/nar/gkae1267
- ↵Deshpande AS, Ulahannan N, Pendleton M, Dai X, Ly L, Behr JM, Schwenk S, Liao W, Augello MA, Tyer C, 2022. Identifying synergistic high-order 3D chromatin conformations from genome-scale nanopore concatemer sequencing. Nat Biotechnol 40: 1488–1499. 10.1038/s41587-022-01289-z
- ↵Dixon JR, Selvaraj S, Yue F, Kim A, Li Y, Shen Y, Hu M, Liu JS, Ren B. 2012. Topological domains in mammalian genomes identified by analysis of chromatin interactions. Nature 485: 376–380. 10.1038/nature11082
- ↵Dixon JR, Jung I, Selvaraj S, Shen Y, Antosiewicz-Bourget JE, Lee AY, Ye Z, Kim A, Rajagopal N, Xie W, 2015. Chromatin architecture reorganization during stem cell differentiation. Nature 518: 331–336. 10.1038/nature14222
- ↵Durand NC, Shamim MS, Machol I, Rao SSP, Huntley MH, Lander ES, Aiden EL. 2016. Juicer provides a one-click system for analyzing loop-resolution Hi-C experiments. Cell Syst 3: 95–98. 10.1016/j.cels.2016.07.002
- ↵Eres IE, Luo K, Hsiao CJ, Blake LE, Gilad Y. 2019. Reorganization of 3D genome structure may contribute to gene regulatory evolution in primates. PLoS Genet 15: e1008278. 10.1371/journal.pgen.1008278
- ↵Fang Z, Liu X, Peltz G. 2023. GSEApy: a comprehensive package for performing gene set enrichment analysis in Python. Bioinformatics 39: btac757. 10.1093/bioinformatics/btac757
- ↵Giorgetti L, Lajoie BR, Carter AC, Attia M, Zhan Y, Xu J, Chen CJ, Kaplan N, Chang HY, Heard E, 2016. Structural organization of the inactive X chromosome in the mouse. Nature 535: 575–579. 10.1038/nature18589
- ↵Gjoni K, Gunsalus LM, Kuang S, McArthur E, Pittman M, Capra JA, Pollard KS. 2025. Comparing chromatin contact maps at scale: methods and insights. Nat Methods 22: 824–833. 10.1038/s41592-025-02630-5
- ↵Gong L, Cheng Q. 2019. Exploiting edge features for graph neural networks. In Proceedings of the IEEE/CVF Conference on Computer Vision and Pattern Recognition (CVPR), Long Beach, CA, pp. 9211–9219.
- ↵Hao Y, Stuart T, Kowalski MH, Choudhary S, Hoffman P, Hartman A, Srivastava A, Molla G, Madad S, Fernandez-Granda C, 2024. Dictionary learning for integrative, multimodal and scalable single-cell analysis. Nat Biotechnol 42: 293–304. 10.1038/s41587-023-01767-y
- ↵Hong Y, Bie L, Zhang T, Yan X, Jin G, Chen Z, Wang Y, Li X, Pei G, Zhang Y, 2024. SAFB restricts contact domain boundaries associated with L1 chimeric transcription. Mol Cell 84: 1637–1650.e10. 10.1016/j.molcel.2024.03.021
- ↵Hua P, Badat M, Hanssen LLP, Hentges LD, Crump N, Downes DJ, Jeziorska DM, Oudelaar AM, Schwessinger R, Taylor S, 2021. Defining genome architecture at base-pair resolution. Nature 595: 125–129. 10.1038/s41586-021-03639-4
- ↵Hua D, Gu M, Zhang X, Du Y, Xie H, Qi L, Du X, Bai Z, Zhu X, Tian D. 2024. DiffDomain enables identification of structurally reorganized topologically associating domains. Nat Commun 15: 502. 10.1038/s41467-024-44782-6
- ↵Huang D, Sun W, Zhou Y, Li P, Chen F, Chen H, Xia D, Xu E, Lai M, Wu Y, 2018. Mutations of key driver genes in colorectal cancer progression and metastasis. Cancer Metastasis Rev 37: 173–187. 10.1007/s10555-017-9726-5
- ↵Jing H, Hu J, He B, Negrón Abril YL, Stupinski J, Weiser K, Carbonaro M, Chiang Y-L, Southard T, Giannakakou P, 2016. A SIRT2-selective inhibitor promotes c-Myc oncoprotein degradation and exhibits broad anticancer activity. Cancer Cell 29: 297–310. 10.1016/j.ccell.2016.02.007
- ↵Kelemen A, Carmi I, Oszvald Á, Lőrincz P, Petővári G, Tölgyes T, Dede K, Bursics A, Buzás EI, Wiener Z. 2021. IFITM1 expression determines extracellular vesicle uptake in colorectal cancer. Cell Mol Life Sci 78: 7009–7024. 10.1007/s00018-021-03949-w
- ↵Knight PA, Ruiz D. 2013. A fast algorithm for matrix balancing. IMA J Numer Anal 33: 1029–1047. 10.1093/imanum/drs019
- ↵Kramer NE, Davis ES, Wenger CD, Deoudes EM, Parker SM, Love MI, Phanstiel DH. 2022. Plotgardener: cultivating precise multi-panel figures in R. Bioinformatics 38: 2042–2045. 10.1093/bioinformatics/btac057
- ↵Krijger PHL, Di Stefano B, de Wit E, Limone F, van Oevelen C, de Laat W, Graf T. 2016. Cell-of-origin-specific 3D genome structure acquired during somatic cell reprogramming. Cell Stem Cell 18: 597–610. 10.1016/j.stem.2016.01.007
- ↵Lattke M, Goldstone R, Ellis JK, Boeing S, Jurado-Arjona J, Marichal N, MacRae JI, Berninger B, Guillemot F. 2021. Extensive transcriptional and chromatin changes underlie astrocyte maturation in vivo and in culture. Nat Commun 12: 4335. 10.1038/s41467-021-24624-5
- ↵Li A, Yin X, Xu B, Wang D, Han J, Wei Y, Deng Y, Xiong Y, Zhang Z. 2018. Decoding topologically associating domains with ultra-low resolution Hi-C data by graph structural entropy. Nat Commun 9: 3265. 10.1038/s41467-018-05691-7
- ↵Li Y, Gu C, Dullien T, Vinyals O, Kohli P. 2019. Graph matching networks for learning the similarity of graph structured objects. In Proceedings of the 36th International Conference on Machine Learning, Long Beach, CA, Vol. 97, pp. 3835–3845. Proceedings of Machine Learning Research.
- ↵Li X, Zeng G, Li A, Zhang Z. 2021. DeTOKI identifies and characterizes the dynamics of chromatin TAD-like domains in a single cell. Genome Biol 22: 217. 10.1186/s13059-021-02435-7
- ↵Li D, Harrison JK, Purushotham D, Wang T. 2022. Exploring genomic data coupled with 3D chromatin structures using the WashU epigenome browser. Nat Methods 19: 909–910. 10.1038/s41592-022-01550-y
- ↵Li A, Zeng G, Wang H, Li X, Zhang Z. 2023. Dedoc2 identifies and characterizes the hierarchy and dynamics of chromatin TAD-like domains in the single cells. Adv Sci (Weinh) 10: e2300366. 10.1002/advs.202300366
- ↵Lieberman-Aiden E, van Berkum NL, Williams L, Imakaev M, Ragoczy T, Telling A, Amit I, Lajoie BR, Sabo PJ, Dorschner MO, 2009. Comprehensive mapping of long-range interactions reveals folding principles of the human genome. Science 326: 289–293. 10.1126/science.1181369
- ↵Liu H, Ma W. 2024. DiffGR: detecting differentially interacting genomic regions from Hi-C contact maps. Genomics Proteomics Bioinformatics 22: qzae028. 10.1093/gpbjnl/qzae028
- ↵Liu S, Wang CY, Zheng P, Jia BB, Zemke NR, Ren P, Park HL, Ren B, Zhuang X. 2025. Cell type–specific 3D-genome organization and transcription regulation in the brain. Sci Adv 11: eadv2067. 10.1126/sciadv.adv2067
- ↵Love MI, Huber W, Anders S. 2014. Moderated estimation of fold change and dispersion for RNA-seq data with DESeq2. Genome Biol 15: 550. 10.1186/s13059-014-0550-8
- ↵Moorman A, Benitez EK, Cambulli F, Jiang Q, Mahmoud A, Lumish M, Hartner S, Balkaran S, Bermeo J, Asawa S, 2025. Progressive plasticity during colorectal cancer metastasis. Nature 637: 947–954. 10.1038/s41586-024-08150-0
- ↵Nora EP, Lajoie BR, Schulz EG, Giorgetti L, Okamoto I, Servant N, Piolot T, van Berkum NL, Meisig J, Sedat J, 2012. Spatial partitioning of the regulatory landscape of the X-inactivation centre. Nature 485: 381–385. 10.1038/nature11049
- ↵Open2C, Abdennur N, Abraham S, Fudenberg G, Flyamer IM, Galitsyna AA, Goloborodko A, Imakaev M, Oksuz BA, Venev SV, 2024. Cooltools: enabling high-resolution Hi-C analysis in Python. PLoS Comput Biol 20: e1012067. 10.1371/journal.pcbi.1012067
- ↵Rao SSP, Huntley MH, Durand NC, Stamenova EK, Bochkov ID, Robinson JT, Sanborn AL, Machol I, Omer AD, Lander ES, 2014. A 3D map of the human genome at kilobase resolution reveals principles of chromatin looping. Cell 159: 1665–1680. 10.1016/j.cell.2014.11.021
- ↵Rossini R, Paulsen J. 2024. hictk: blazing fast toolkit to work with .hic and .cool files. Bioinformatics 40: btae408. 10.1093/bioinformatics/btae408
- ↵Shin H, Shi Y, Dai C, Tjong H, Gong K, Alber F, Zhou XJ. 2016. TopDom: an efficient and deterministic method for identifying topological domains in genomes. Nucleic Acids Res 44: e70. 10.1093/nar/gkv1505
- ↵Symmons O, Uslu VV, Tsujimura T, Ruf S, Nassari S, Schwarzer W, Ettwiller L, Spitz F. 2014. Functional and topological characteristics of mammalian regulatory domains. Genome Res 24: 390–400. 10.1101/gr.163519.113
- ↵Tan L, Ma W, Wu H, Zheng Y, Xing D, Chen R, Li X, Daley N, Deisseroth K, Xie XS. 2021. Changes in genome architecture and transcriptional dynamics progress independently of sensory experience during post-natal brain development. Cell 184: 741–758.e17. 10.1016/j.cell.2020.12.032
- ↵Wang X-T, Cui W, Peng C. 2017. HiTAD: detecting the structural and functional hierarchies of topologically associating domains from chromatin interactions. Nucleic Acids Res 45: e163. 10.1093/nar/gkx735
- ↵Wang X, Xu J, Zhang B, Hou Y, Song F, Lyu H, Yue F. 2021. Genome-wide detection of enhancer-hijacking events from chromatin interaction data in rearranged genomes. Nat Methods 18: 661–668. 10.1038/s41592-021-01164-w
- ↵Wang X, Luan Y, Yue F. 2022. EagleC: a deep-learning framework for detecting a full range of structural variations from bulk and single-cell contact maps. Sci Adv 8: eabn9215. 10.1126/sciadv.abn9215
- ↵Wierzbicki PM, Adrych K, Kartanowicz D, Dobrowolski S, Stanislawowski M, Chybicki J, Godlewski J, Korybalski B, Smoczynski M, Kmiec Z. 2009. Fragile histidine triad (FHIT) gene is overexpressed in colorectal cancer. J Physiol Pharmacol 60 Suppl 4: 63–70.
- ↵Wike CL, Guo Y, Tan M, Nakamura R, Shaw DK, Díaz N, Whittaker-Tademy AF, Durand NC, Aiden EL, Vaquerizas JM, 2021. Chromatin architecture transitions from zebrafish sperm through early embryogenesis. Genome Res 31: 981–994. 10.1101/gr.269860.120
- ↵Winick-Ng W, Kukalev A, Harabula I, Zea-Redondo L, Szabó D, Meijer M, Serebreni L, Zhang Y, Bianco S, Chiariello AM, 2021. Cell-type specialization is encoded by specific chromatin topologies. Nature 599: 684–691. 10.1038/s41586-021-04081-2
- ↵Xu J, Song F, Lyu H, Kobayashi M, Zhang B, Zhao Z, Hou Y, Wang X, Luan Y, Jia B, 2022. Subtype-specific 3D genome alteration in acute myeloid leukaemia. Nature 611: 387–398. 10.1038/s41586-022-05365-x
- ↵Xu H, Ye Y, Duan R, Gao Y, Hu Y, Gao L. 2024. Beaconet: a reference-free method for integrating multiple batches of single-cell transcriptomic data in original molecular space. Adv Sci (Weinh) 11: e2306770. 10.1002/advs.202306770
- ↵Xu X, Gan J, Gao Z, Li R, Huang D, Lin L, Luo Y, Yang Q, Xu J, Li Y, 2025. 3D genome landscape of primary and metastatic colorectal carcinoma reveals the regulatory mechanism of tumorigenic and metastatic gene expression. Commun Biol 8: 365. 10.1038/s42003-025-07647-2
- ↵Yang T, Zhang F, Yardımcı GG, Song F, Hardison RC, Noble WS, Yue F, Li Q. 2017. HiCRep: assessing the reproducibility of Hi-C data using a stratum-adjusted correlation coefficient. Genome Res 27: 1939–1949. 10.1101/gr.220640.117
- ↵Yardımcı GG, Ozadam H, Sauria MEG, Ursu O, Yan K-K, Yang T, Chakraborty A, Kaul A, Lajoie BR, Song F, 2019. Measuring the reproducibility and quality of Hi-C data. Genome Biol 20: 57. 10.1186/s13059-019-1658-7
- ↵Yu W, He B, Tan K. 2017. Identifying topologically associating domains and subdomains by Gaussian mixture model and proportion test. Nat Commun 8: 535. 10.1038/s41467-017-00478-8
- ↵Zhan Y, Mariani L, Barozzi I, Schulz EG, Blüthgen N, Stadler M, Tiana G, Giorgetti L. 2017. Reciprocal insulation analysis of Hi-C data shows that TADs represent a functionally but not structurally privileged scale in the hierarchical folding of chromosomes. Genome Res 27: 479–490. 10.1101/gr.212803.116
- ↵Zhang S, Plummer D, Lu L, Cui J, Xu W, Wang M, Liu X, Prabhakar N, Shrinet J, Srinivasan D, 2022. DeepLoop robustly maps chromatin interactions from sparse allele-resolved or single-cell Hi-C data at kilobase resolution. Nat Genet 54: 1013–1025. 10.1038/s41588-022-01116-w
- ↵Zhou C, Gao Y, Ding P, Wu T, Ji G. 2023. The role of CXCL family members in different diseases. Cell Death Discov 9: 212. 10.1038/s41420-023-01524-9