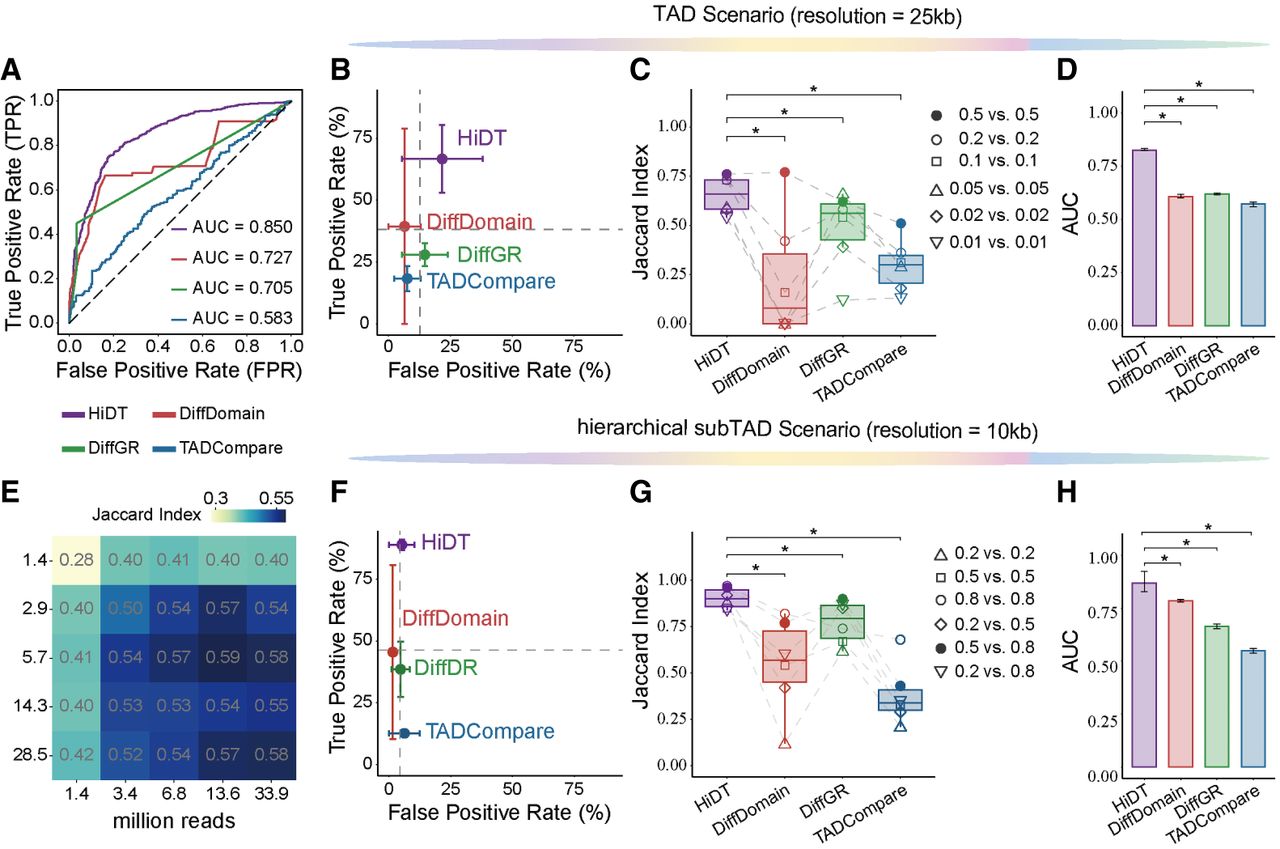
Performance evaluation of HiDT for differential TAD and hierarchical subTAD identification using GM12878 and K562 data. (A) Receiver operating characteristic (ROC) curves and area under the curve (AUC) values for differential TAD identification at 25 kb resolution. (B) False-positive rate (FPR) and true-positive rate (TPR) for differential TAD identification from downsampled contact maps using high-confidence reference sets. Each circle shows the mean across sample pairs, and gray dashed lines show the overall means across methods. (C) Jaccard indices were calculated between differential TADs identified from downsampled data and those identified by the same method from the corresponding full-depth data. Symbols indicate downsampling pairs, with paired results connected by gray dashed lines. (D) AUC values across five downsampling replicates. Error bars indicate standard deviations. (E) Jaccard indices of HiDT across sequencing depths, expressed as millions of intrachromosomal contacts. (F–H) Corresponding FPR and TPR, Jaccard indices, and AUC values for differential hierarchical subTAD identification. Statistical significance was assessed using a Wilcoxon signed-rank test. Significance labels are defined as follows: (*) P < 0.05.