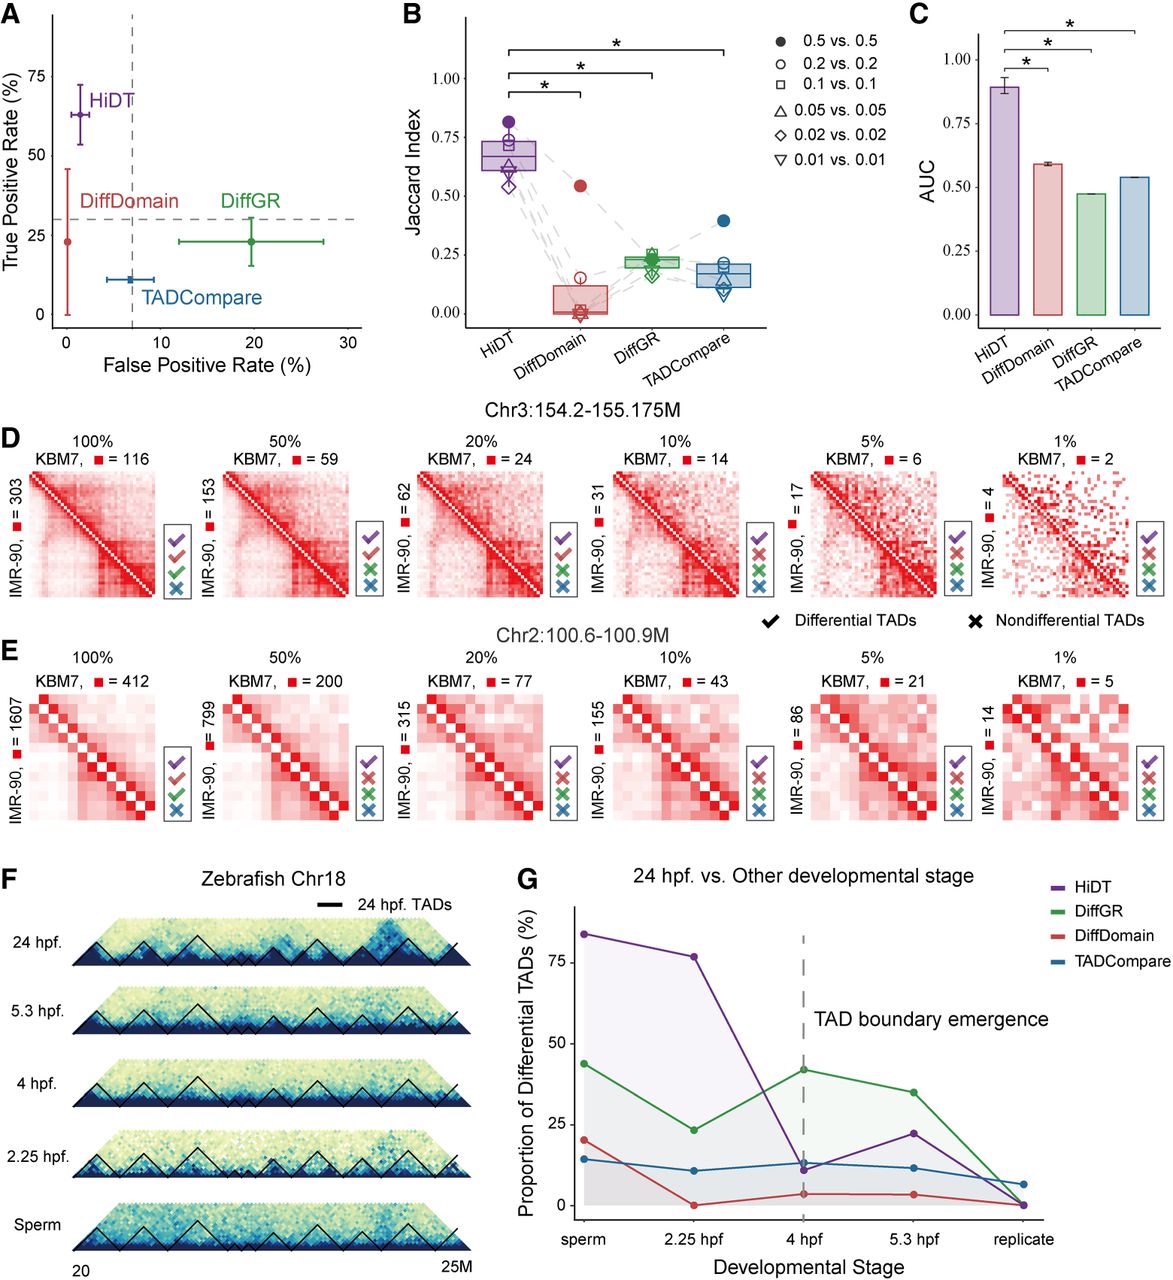
Performance evaluation of HiDT on IMR-90 versus KBM7 and zebrafish developmental Hi-C data. (A) FPR and TPR of differential TADs identified from downsampled 25 kb contact maps using high-confidence reference sets. (B) Jaccard indices of differential TADs identified from downsampled and full-depth data. Each point represents one downsampling pair, with paired results connected by gray dashed lines. (C) AUC values for differential TAD identification between IMR-90 and KBM7 at 25 kb resolution. Bars and error bars indicate the mean and standard deviation across five downsampling replicates. (D,E) Representative differential TADs between IMR-90 and KBM7 at different downsampling ratios. Upper and lower triangles show KBM7 and IMR-90 contact maps, respectively. Check and cross marks indicate whether each method classified the TAD pair as differential. (F) Hi-C contact maps of a region on Chromosome 18 across zebrafish developmental stages. Black lines indicate DI-defined TAD boundaries. Heatmaps were generated using Plotgardener (Kramer et al. 2022). (G) Proportions of differential TADs identified by each method when comparing the 24 hpf sample with its replicate and with earlier developmental stages.