

Abstract
Variation in protein 3D structures reflects genetic variation and contributes to phenotypic diversity, yet its underlying genetic mechanisms remain unclear. To investigate the relationship between protein 3D structure and phenotype, we predict the 3D structures of 795,649 proteins from 26 maize (Zea mays L.) inbred lines using AlphaFold2. Population genetics analysis of these protein 3D structures reveal that buried residues held greater genomic evolutionary rate profiling (GERP) scores than exposed residues, indicating that buried residues are under stronger purifying selection. The design of the maize nested association mapping population makes it possible to utilize haplotype information and protein 3D structural variation to reveal the molecular mechanisms linking genetic diversity and phenotypic variation for a population with about 5000 individuals. Associating protein 3D structure variation with phenotypes (structure-based proteome-wide association study [PWAS]) identifies 14.2% more (96 vs. 84) significant proteins compared with associating protein sequence with phenotypes (sequence-based PWAS) using 32 agronomic traits. Moreover, structure-based PWAS identifies 24 additional significant proteins unique to predicted structures, whereas sequence-based PWAS identifies 12 additional significant proteins. Structure-based proteome-wide predictions (PWPs) improve genomic prediction accuracy by an average of 3.8% compared with sequence-based PWPs. In general, predicted protein 3D structures represent a powerful approach for understanding the natural diversity of protein haplotypes.
Tremendous progress has been made over the past decade in linking genomic variation to phenotypic variance (Atwell et al. 2010; Klein et al. 2010; Xiao et al. 2017; Tam et al. 2019; Togninalli et al. 2020; Ramstein and Buckler 2022; Wang et al. 2023; Wu et al. 2023). However, understanding the molecular mechanisms underlying sequence phenotype relationships remains a major challenge. Genome-wide predictions can now reach high accuracy within narrow germplasm pools but are less accurate for many complex traits in individuals with greater genetic distance (Windhausen et al. 2012; Desta and Ortiz 2014). This lack of transferability has been observed in both human and agricultural contexts. Moreover, different populations may exhibit distinct architectures of the causal variants underlying complex traits (Werner et al. 2005; Song et al. 2018; Keys et al. 2020), with rare alleles and different allele frequencies. In addition, even the most accurate whole-genome prediction models tend to overlook molecular mechanistic functions and fail to model aspects such as disruptions in protein activity.
Phenotypic variation broadly results from the modification of molecular processes within cells (Doerge 2002) in which proteins are among the most important functional molecules. The biological function of a given protein is dictated by the arrangement of the atoms and functional groups in its three-dimensional (3D) structure. Therefore, variation in protein 3D structure is an essential source of information to explain how coding sequence variants impact gene activity (Hicks et al. 2019). Because of the extremely high cost and throughput bottleneck of protein 3D structure investigation technology, omics-wide comparisons of 3D structure have rarely been conducted for alleles at the population scale within eukaryotic species or across related species. AlphaFold2 (Jumper et al. 2021) enables researchers to perform proteome-wide 3D structure predictions without having to generate crystals for all individual proteins encoded by a genome.
Proteins carry diverse selection signatures resulting from structural and functional constraints (MacGowan et al. 2024). One prime determinant of structural constraints is the relative solvent-accessible surface area (RSA) of residues. Buried residues accept lower evolutionary substitutions and are more structurally constrained than exposed residues (Chothia and Lesk 1986). Structural constraints are reflected in the allele frequency spectrum, which is commonly used as an indication of natural selection (Vishnoi et al. 2011). Evolutionary measures of sequence conservation provide important insights into structural constraints (Davydov et al. 2010; Kistler et al. 2018; Sun et al. 2023). Therefore, understanding how natural selection shaped protein 3D architecture is crucial for identifying functionally important regions that contribute to genetic adaptation to the environment.
Genome-wide association studies (GWASs) have identified many candidate causal loci in protein-coding genes and regulatory regions. These genomic variations impact traits largely by modulating the dosage or functional activity of proteins. Association studies based on gene expression have also been conducted at the population scale. These analyses are often based on mRNA abundance (Yang et al. 2024), which demonstrates a moderate correlation with protein abundance (Mergner et al. 2020). Protein 3D structure, as determinant of protein function, also influences various important biological activities. An improved understanding of protein 3D structural variation might provide critical insights into the molecular mechanisms underlying complex traits (Gerasimavicius et al. 2025). To capture such effects, association analysis and genomic prediction integrating 3D structural variation into quantitative genetics might offer a concrete, functionally interpretable framework for analyzing phenotypic variation.
Considering the high computational cost and lack of annotated protein sequences, applying AlphaFold2 to large-scale natural populations is challenging. Artificially designed populations with a limited number of founder lines make it possible to use AlphaFold2 to explore the genetic mechanisms underlying phenotypic diversity. In this context, the maize (Zea mays L.) nested association mapping (NAM) population (McMullen et al. 2009; Gage et al. 2020) provides a valuable resource to link genotypic variation with phenotypic variation using computationally folded protein structures with affordable computing resources. The genomes of 26 NAM founder lines have been de novo assembled using long sequencing reads, and their protein sequences have been annotated (Hufford et al. 2021). The NAM population has been characterized by more than 100 different phenotypes in different environments more than tens of millions of plants, ranging from agronomic characteristics to omics profiles (Gage et al. 2020; Khaipho-Burch et al. 2023). The use of this unique genetic resource for powerful AI-based structure prediction offers a valuable opportunity to investigate the genetic mechanisms underlying phenotypic diversity.
In this study, we predicted protein 3D structures for 26 maize founder inbred lines and projected these structures onto the NAM inbred population with about 5000 individuals. Based on these predictions, we investigated signatures of natural selection acting on protein structure. To examine the impact of structural variation on phenotypes, we utilized the increased association power of protein 3D structural variation by conducting a structure-based proteome-wide association study (PWAS). Additionally, we explored the contribution of protein 3D structural variation to the accuracy of phenotypic prediction using proteome-wide prediction (PWP). Our findings suggest that protein structures have significant potential for enhancing quantitative and population genetics analyses.
Results
Protein structure predictions for 26 diverse maize inbred lines
To investigate the structural diversity, we used AlphaFold2 to predict the structure of proteins for the maize inbred line B73 and the 25 other NAM founder lines. Whether AlphaFold2 can predict the effects of single amino-acid polymorphisms (SAPs) is controversial (Stein and Mchaourab 2024), so we first compared the protein sequence from the same core pangene group to characterize the sequence diversity of orthologous proteins among the 26 maize NAM founder lines (Hufford et al. 2021). We identified sequence variants in ∼70% of pairwise protein comparisons, whereas only ∼10% differed by a single point mutation (Fig. 1A), indicating the high level of sequence diversity within this panel.
Protein 3D structure predictions for 26 maize NAM founder lines using AlphaFold2. (A) Protein sequence diversity in maize NAM founder lines. Each NAM founder line was compared with other NAM founder lines in pairs. (SAP) Single amino-acid polymorphism, (indel) insertion/deletion. (B) Percentage of predicted protein 3D structures at different confidence levels in B73 (left; total count: 72,539) and NAM founder lines (right; total count: 1,089,242); colors represent median confidence scores. Unresolved protein structures were not predicted; see Methods. (C) Distribution and percentage of confidence scores for all NAM founder lines residues. The histogram shows the density distribution of confidence scores, and the pie chart shows the percentage of confidence scores. (pLDDT) Predicted local distance difference test. (D) Distribution of RSA for residues in all NAM founder lines. (RSA) Relative solvent-accessible surface area. (E) Heatmap representing median confidence scores of protein structures as a function of protein length in all NAM founder lines.
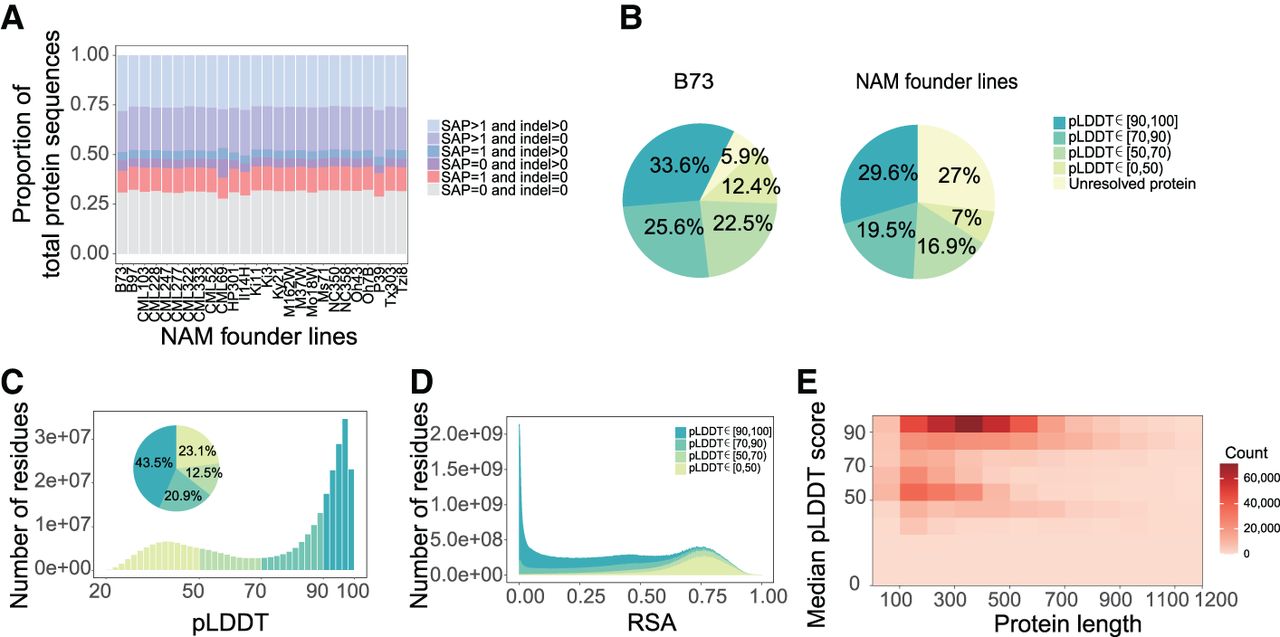
We predicted the 3D structures of 68,262 proteins from B73 (v5.0; including canonical proteins from 37,724 genes) using AlphaFold2 (Jumper et al. 2021), as B73 has been widely used as the reference maize line for more than a decade (Schnable et al. 2009). For the other 25 founder lines, we merged their canonical protein sequences into a nonredundant collective protein set (excluding protein sequences identical to their respective B73 reference). Overall, we predicted the structures of 313,639 unique protein sequences, corresponding to 795,649 proteins for all 26 NAM founder lines (Supplemental Fig. S1A,B). The folded protein structures represent 94.1% of all proteins from B73 and ∼73% of proteins from the NAM founder lines (Fig. 1B; Supplemental Table S1). To assess the prediction confidence for each protein and each residue, we used the predicted local distance difference test score (pLDDT) (Jumper et al. 2021). At a per-protein level, 59.2% and 49.1% of all proteins showed high confidence (median pLDDT ≥ 70) in the B73 and the NAM founder lines, respectively (Fig. 1B; Supplemental Table S1). A more stringent cut-off (median pLDDT ≥ 90) predicted 33.6% (B73) and 29.6% (NAM founder lines) of folded proteins with very high confidence (Fig. 1B). At the per-residue level, 61.0% (B73) (Supplemental Fig. S2A) and 64.4% (NAM founder lines) (Fig. 1C) of the residues were predicted with high confidence (pLDDT ≥ 70) (Supplemental Table S2). The pLDDT scores for each residue followed a clear bimodal distribution (Fig. 1C; Supplemental Fig. S2A), similar to that of humans (Alderson et al. 2023).
RSA is a measure of the exposure of an amino acid residue to the protein's solvent (Ramsey et al. 2011; Savojardo et al. 2021), with values ranging from zero for a totally buried residue to one for a totally exposed residue. RSA followed a bimodal distribution, with low pLDDT scores mainly distributed in the high RSA region and high pLDDT scores mainly distributed in the low RSA region for both B73 (Supplemental Fig. S2B) and the NAM founder lines (Fig. 1D). Furthermore, RSA was significantly negatively correlated with pLDDT (Supplemental Fig. S3). Residues with high-confidence scores are potentially functional domains and are tightly folded (Akdel et al. 2022). Structural domains are fundamental units critical to biological function, typically ranging in length from 100 to 500 residues (Wheelan et al. 2000). Our results reveal that high-confidence levels are predominantly enriched in domain-like length regions in B73 (Supplemental Fig. S2C) and the NAM founder lines (Fig. 1E). The folded maize proteins structures with high sequence diversity represent valuable resources to investigate the evolution of protein structures and conduct quantitative genetics analysis.
Buried residues are under stronger purifying selection than exposed residues
Natural selection acting on protein 3D structures plays key roles in environmental adaptation and fitness with structural constraints representing one of the main determinants of the rates of evolution (Wolf et al. 2008). Therefore, we aimed to explore the molecular mechanisms underlying natural selection via predicted 3D structures. We identified 495,357 nonsynonymous and 490,815 synonymous single-nucleotide polymorphisms (SNPs) (Bukowski et al. 2018) from the maize 282 association panel (Flint-Garcia et al. 2005). High-confidence and buried regions (with high pLDDT and low RSA) held higher proportions of synonymous SNPs than nonsynonymous SNPs, indicating that these regions are likely subject to stronger purifying selection pressure (P-value < 2.2 × 10⁻¹⁶, Fisher's exact test) (Fig. 2A,B). To further investigate how natural selection acted on protein structure, we used Z. mays ssp. mexicana and Z. mays ssp. parviglumis as outgroups to infer ancestral states and observed that nonsynonymous SNPs in the lowest derived allele frequency bin held the lowest mean RSA value compared with the other bins (P-value < 0.05, one-way analysis of variance and Fisher's least significant difference test) (Fig. 2C), suggesting that purifying selection acts on buried residues.
Protein structure predictions provide functional insights into natural selection in maize. (A) Density distribution of pLDDT scores between synonymous and nonsynonymous SNPs. (B) Density distribution of RSA between synonymous and nonsynonymous SNPs. (C) Distribution of RSA for different derived allele frequencies. (D) Relationship between GERP scores and buried (RSA < 0.5) or exposed residues. Median value is shown as a solid middle line within the box plot, which spans from the 25th to 75th percentiles. For definition of buried and exposed residues, see Supplemental Figure S4. (E) Correlation between RSA and GERP scores divided by pLDDT score bins (as indicated by the gray shading above the plots).
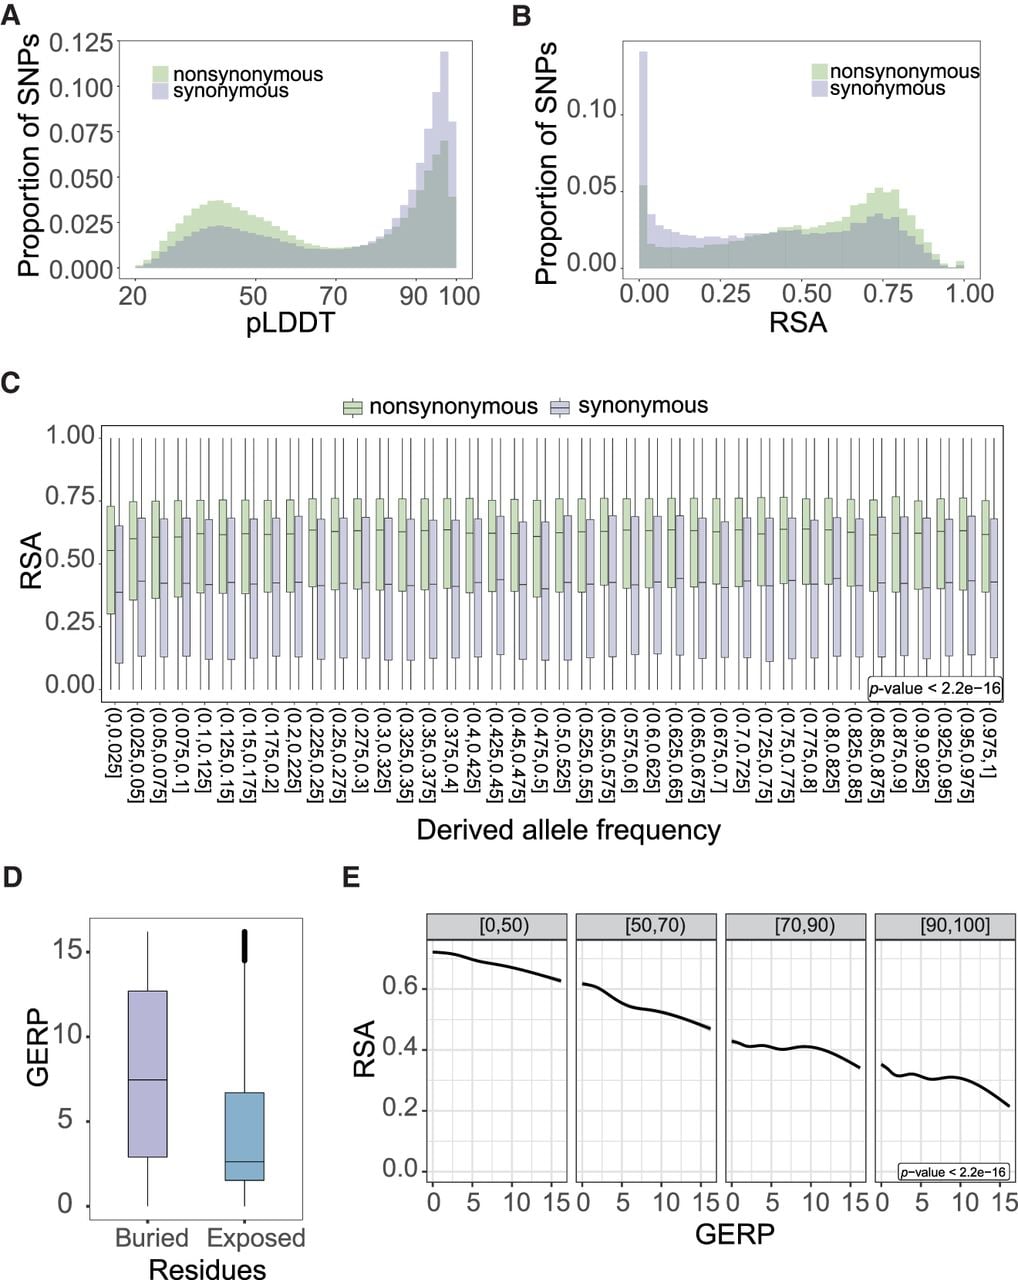
Genomic sites with higher genomic evolutionary rate profiling (GERP) scores are interpreted to be under stronger purifying selection (Davydov et al. 2010; Yang et al. 2017). Genomic sites at buried residues (RSA < 0.5) had greater GERP scores than those at exposed residues (RSA ≥ 0.5), suggesting that buried residues are under stronger purifying selection (P-value < 2.2 × 10⁻¹⁶, t-test) (Fig. 2D; Supplemental Fig. S4). RSA is negatively correlated with pLDDT (Supplemental Fig. S3), and pLDDT decreases substantially when the median alignment depth is less than about 30 sequences in the multiple sequence alignment (MSA) from the AlphaFold2 model (Jumper et al. 2021). A high depth of MSA is likely to reflect sequence conservation. To avoid this source of confounding (Chakravarty and Porter 2022), we analyzed the strength of purifying selection conditionally on pLDDT bins. In each bin, residues with low solvent accessibility held higher GERP scores compared with residues with high solvent accessibility (Fig. 2E), suggesting that they are subjected to stronger purifying selection than those with high solvent accessibility, even after accounting for the confounding effect of pLDDT. Moreover, πN/πS (the ratio of nonsynonymous to synonymous nucleotide site diversity) was lower in buried regions than in exposed regions, even when considering the confounding effect of pLDDT scores, confirming purifying selection in buried regions (Supplemental Fig. S5). Taken together, these observations indicate that predicted protein 3D structure by AlphaFold2 at population scale could reveal associations between structural features of protein and evolutionary constraint, providing key functional insights into natural selection.
Predicted structural variants provide novel insights into genetic effects on phenotypes
To conduct association analysis based on protein variation, we measured the structural similarity as well as sequence similarity for the canonical isoforms of each core pangene group. We used the principal components (PCs) of the structure- and sequence-based similarity matrices as independent variables to perform association analysis on 32 traits. To account for population structure and relatedness, we included a genome-wide relationship matrix (based on genomic SNPs) and a genome-wide IBD matrix (based on protein haplotypes) in a linear mixed model (Supplemental Fig. S6). Our PWAS focused on PCs with eigenvalues higher than a predefined threshold (1 × 10⁻⁵), which included most PCs with nonzero variance (Supplemental Fig. S7A). Lowering this predefined threshold resulted in near-identical results from structure-based tests (Supplemental Fig. S7B–E). It is noteworthy that this lower threshold also resulted in spurious associations with extremely high significance values (e.g., pangene 9228, with −log10(P) > 200) (Supplemental Table S3). On average, the associations between predicted structure and phenotype were stronger than those between sequence and phenotype (Fig. 3A; Supplemental Fig. S8), suggesting higher statistical power through structure-based associations. We identified 108 significant proteins through both structure-based and sequence-based association analyses (96 and 84 by structure- and sequence-based tests, respectively). Of these, 72 proteins were shared between the two methods, whereas structure-based association identified 24 additional significant protein–trait associations unique to predicted structures (Fig. 3B; Supplemental Fig. S9), suggesting that structure-based association analysis is a valuable and informative complement to sequence-based association analysis. The variability of PCs was almost identical with different significant levels for all significant proteins (Supplemental Fig. S10). To test whether the relative advantage of structure-based PWAS was not owing to the use of specific sequence-based MSA software, we conducted the analysis using two other MSA tools: MUSCLE and T-Coffee (Notredame et al. 2000; Edgar 2004). The protein sequence similarity matrices generated from different MSA approaches were highly correlated with each other but were different from the structural similarity matrices (Supplemental Fig. S11). The observed improvement in statistical significance from predicted protein structures was consistent across MSA software (Supplemental Figs. S12, S13). Furthermore, we investigated whether the significant proteins identified via structure-based PWAS could be identified via standard SNP-based GWAS. The results suggested structured-based PWAS identified additional loci that were not identified by SNP-based GWAS (Fig. 3C,D; Supplemental Table S4).
Comparison between association analyses. (A) Decay of significance over physical distance from significance peaks in PWAS. The peak is at the starting point of a significant gene. (B) Significant association signals from structure- and sequence-based PWAS. The dashed lines correspond to a 5% significance threshold with Bonferroni correction. (C) Significant loci from structure-based PWAS and SNP-based GWAS. The dashed lines correspond to a 5% significance threshold with Bonferroni correction (5.32 in green for structure-based PWAS, 7.34 in purple for SNP-based GWAS). In SNP-based GWAS, significant genes are selected based on the most significant SNP in coding regions. (D) Manhattan plot of structure-based PWAS and SNP-based GWAS. Traits shown are ear row number, node number above ear, and upper leaf angle. The dashed lines are identical to those shown in C.
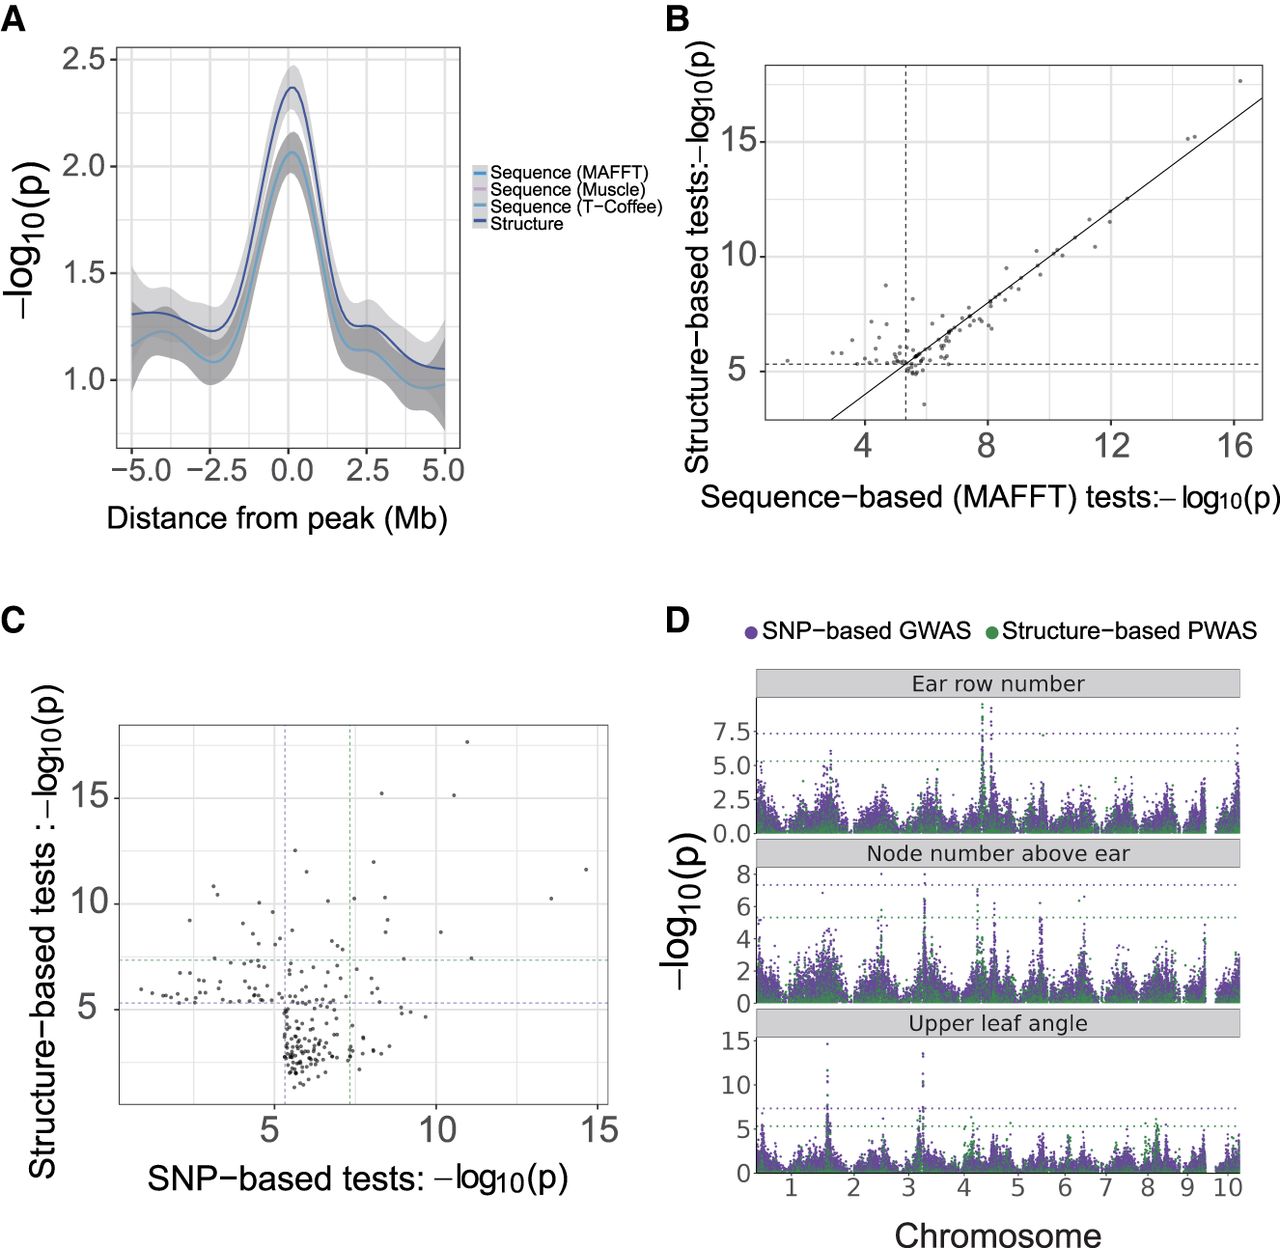
To assess our ability to identify candidate causal genes via structure-based PWAS, we inspected associated protein structures encoded by known genes with phenotypes (Supplemental Fig. S14). The predicted protein structure of the transcription factor LIGULELESS1 (encoded by Zm00001eb067740) was significantly associated with upper leaf angle. LIGULELESS1 regulates ligule and leaf angle development, and the mutant phenotype of this gene has been genetically studied (Li et al. 2017; Mantilla-Perez and Salas Fernandez 2017). The predicted protein structure of TUBTF6 (encoded by Zm00001eb188370) was significantly associated with upper leaf angle. This gene was reported to be enriched in a leaf gene regulatory network (Bertolini et al. 2025). DWARF and IRREGULAR LEAF1 (DWIL1; encoded by Zm00001eb287100) was associated with node number above the ear and was previously reported to influence plant height, internode length, and potentially node number (Jiang et al. 2012). GNARLEY (encoded by Zm00001eb117820) was associated with node number above the ear. Its mutation alters the overall plant architecture (Foster et al. 1999), and its ortholog in rice, Oryza sativa homeobox 15 (OSH15), affects node development (Sato et al. 1999). Because of linkage disequilibrium (LD), the extra power gained from structured PWAS might not point to the causal genes. The predicted structure of GOLDEN2-LIKE 37 (GLK37; encoded by Zm00001eb073790) showed a stronger association with ear row number than its sequence, and KRN2 (Zm00001eb073740) is in high LD with GLK37. KRN2 was previously reported to regulate ear row number (Chen et al. 2022). Genetic research is needed to confirm and further understand the underlying molecular mechanisms of these significant protein–trait associations.
Protein 3D structure improves genomic prediction accuracy
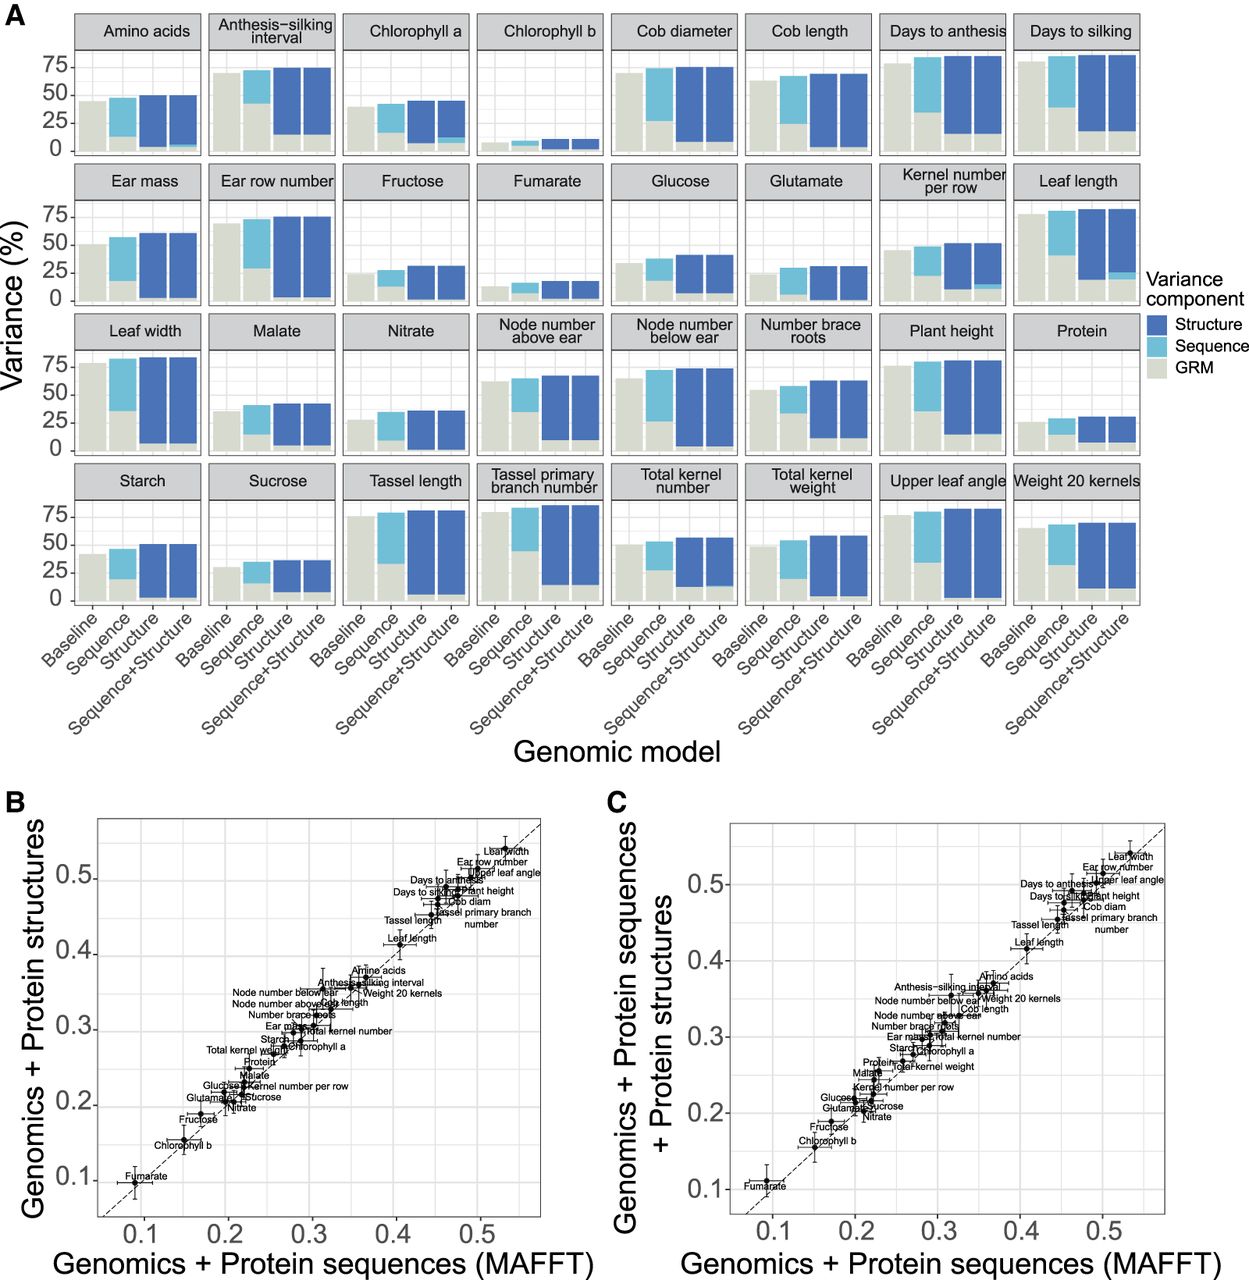
We assessed the additional contributions of protein structure variation to the genomic variance of the 32 traits in the NAM population by performing variance partitioning using a genomic prediction model. Because the genotypic variants used for association are not fully independent of each other, we estimated their effect sizes (i.e., the amount of phenotypic variance explained) using a mixed model and included the whole-genome SNP-based genomic value as an independent variable. We constructed three proteome-wide similarity matrices using structure, sequence, and IBD from all pangene groups. We first estimated the variance explained by the sequence similarity matrix and then added the protein structural similarity matrix as an additional source of variance (Fig. 4A). The inclusion of the structural similarity matrix provided a better fit compared with using the sequence similarity matrix alone (likelihood ratio test, P-value < 0.05) (Fig. 4A). Structure-based PWP improved prediction accuracy by 3.8% on average compared with sequence-based PWP (P-value = 1.1 × 10⁻⁷, paired t-test) (Fig. 4B), in which node number below ear, fructose content, and glucose content yielded >10% improvement in prediction accuracy. Structure-based PWP incorporating sequence information improved prediction accuracy by 4.1% compared with sequence-based PWP on average (P-value = 2.7 × 10⁻⁷, paired t-test) (Fig. 4C), in which fumarate, node number below ear, protein, fructose content, and glucose content yielded >10% improvement in prediction accuracy. The increased prediction accuracy was independent of MSA methods used (Supplemental Figs. S15, S16). Structure-based similarities, alone or combined with IBD-based similarities, resulted in increased prediction accuracy compared with IBD-based similarity alone (1.9% and 2.5%, respectively) (Supplemental Fig. S17), whereas node number below ear led to the highest improvement in prediction accuracy (12.0% and 11.4%). These results indicate that protein structures explain genotypic variation not captured by protein sequence or IBD information, which translates into higher genomic prediction accuracy.
Protein 3D structure improving prediction accuracy compared to protein sequence. (A) Variance partitioning in different genomic models for 32 traits. Sequences were aligned using MAFFT. Likelihood values are listed in Supplemental Table S5. (B) Comparison of prediction accuracy between sequence-based PWP and structure-based PWP. (C) Comparison of prediction accuracy between sequence-based PWP and sequence-based plus structure-based PWP. Dots represent the mean values of 25 leave-one-family-out repeats, and error bars indicate their standard errors.
Discussion
Although functional features have been incorporated into association testing or genomic prediction, leading to significant improvements (Ramstein and Buckler 2022; Chen et al. 2024), the use of protein 3D structure for PWAS and PWP remains unexplored. Information on protein 3D structure provided molecular insights into the consequences of natural selection. The structure variants at population scale enabled us to perform structure-based PWAS and PWP to identify genes associated with important agronomic traits. Our results represent a pioneering exploration of how predicted protein 3D structural diversity can enhance our understanding of phenotypic variation.
Prediction of protein structure requires high-quality genome sequence and annotation
Prediction of protein structure heavily depends on high-quality protein sequences, as the 3D conformation of a protein is determined by the arrangement of its amino acids. Sequencing errors or gaps in the sequence can lead to inaccurate or misleading predicted structures. Therefore, ensuring the completeness and accuracy of the genomic sequence data is crucial for reliable structure prediction. Highly accurate gene annotation (the process of finding and designating the locations of individual genes) is also required to improve structure predictions (Salzberg 2019). With the advent of Oxford Nanopore Technology (ONT) and Pacific Biosciences (PacBio) HiFi sequencing technologies, more and more genomes are being assembled at the telomere-to-telomere (T2T) level (Xie et al. 2024). As a result, the acquisition of high-quality protein sequences has become increasingly feasible, enabling large-scale protein structure predictions and opening new avenues for the exploration of functional mechanisms.
Genetic effects are captured by high-confidence protein 3D structure
Proteome-wide protein 3D structure prediction accurately captures structural differences between genes in the reference genome of human and other model organisms (Tunyasuvunakool et al. 2021; Akdel et al. 2022). As protein sequence alleles are conserved across mammalian species, AlphaFold2 might not have the power to predict the impact of SAPs (Stein and Mchaourab 2024). However, AlphaFold2 may effectively predict allelic differences in protein structures in plant species, which are significantly more diverse than in mammal species (Buckler et al. 2006; Song et al. 2024). In this study, we extend proteome-wide protein 3D structure prediction to a population scale by taking advantage of the design of the maize NAM population. This allowed us to use predicted structure to analyze phenotypic variation in quantitative genetics studies, thereby enabling the decomposition of genotypic variability, which would otherwise not be possible.
Predicted protein structural similarity is more informative than protein sequence similarity
Structural similarity between proteins is a strong predictor of functional similarity (Erdin et al. 2011). Vastly different amino acid sequences can lead to similar structures, although even two closely related sequences may fold into distinctly different structures (Krissinel 2007). Our structure-based PWAS results suggest that 3D structures predicted from sequences are more useful than sequences alone for discovering candidate genes. Our method filtered some PCs with low variance, which introduced extra false positives in PWAS. We examined several candidate genes that contribute to phenotypic variation. Although we identified promising candidates, sequence differences in proteins do not necessarily affect their predicted 3D structure. For omic-wide associations, we applied the canonical Bonferroni multiple tests correction to adjust significance thresholds for SNPs and pangene groups separately. Owing to the substantially larger number of SNPs compared with pangene groups, the resulting significance thresholds (expressed as −log10(P-value)) were higher for SNPs. Nevertheless, even applying the same threshold to SNP-based GWAS and PWAS, the observation that structure-based PWAS provides complementary information to SNP-based GWAS still holds (Fig. 3C). In our analysis, we only kept pangenes that were present in all individuals, although additional genes are dispensable or private to some founder lines. Our analysis focused on sequence variability and did not consider potential effects of gene absence. Moreover, the dosage of functional molecules in cells, which is also essential for trait regulation (Wingo et al. 2021), could not be captured by predicting protein structure. Including dosage regulation and protein complexes in the model might further improve our understanding of the genetic mechanisms underlying trait diversity. Predicted 3D structure may only describe one component of gene activity, independent from gene regulation. Therefore, our proposed structure-based PWAS approach should ultimately be combined with other approaches (e.g., proteome-wide dosage association studies) to obtain a detailed biological description of genotypic variability.
Predicted protein structural variants capture genotypic variability
There have been mixed results about the usefulness of AlphaFold2 for predicting the effect of single-residue variants on protein structure (Buel and Walters 2022; McBride et al. 2023). Our PWAS and PWP results clearly indicate that AlphaFold2 can capture genotypic variability for agronomic, morphological, and compositional traits in maize. Importantly, predicted protein structural variants in our study consisted of haplotype variants, not necessarily single-residue variants. Based on our results, we hypothesize that AlphaFold2 can accurately predict allelic variants for protein structure provided that there are large enough differences among protein alleles. This hypothesis calls for further research to quantify the structural differences between protein alleles and to test the accuracy of their prediction.
In our analyses, precision was prioritized over power, as our PWAS approach was essential to account for biases introduced by LD, by including both SNP-based relationship and haplotype-based IBD matrices (Supplemental Fig. S6). A previous study predicted mRNA abundance for each haplotype in the NAM population, similar to our prediction of protein structures (Giri et al. 2021). Importantly, in this study, permutations of predicted gene activity across the 26 haplotypes in the NAM population were predictive of phenotypes, as long as haplotypes were still correctly assigned to individual NAM lines. This result highlights the potential source of confounding owing to haplotype variation alone, as well as the necessity to account for haplotype IBD in association studies of gene activity imputed by haplotype.
Although our PWP results suggest that predicted 3D structure provides useful functional information about genetic effects, the gains in prediction accuracy realized in our study are certainly too low to justify routine applications of AlphaFold2 in genomic selection programs. However, the PHG used in this study may still be used for imputing haplotypes in any breeding population, and our structure-based similarity matrices may then be used without running AlphaFold2 again. Further research is needed to determine whether haplotype imputation by this PHG database (or future databases containing more genome assemblies) is accurate enough for effective incorporation of predicted protein structure information into genomic prediction models.
Methods
Protein sequence diversity investigation
To investigate sequence diversity, we extracted the pangenes from previously published pangene annotations (Hufford et al. 2021) with at least one predicted protein structure for each of the 26 founder lines (see below), resulting in 17,633 pangenes. MSA was performed using MAFFT to investigate the sequence diversity (Katoh and Standley 2013) for each pangene group. Protein sequences from the 26 NAM founder lines were iteratively used as the reference. The query sequences were compared with the reference sequence for each pangene of each iteration to count the number of SAPs and indels.
Protein 3D structure prediction
Protein structure prediction was performed using AlphaFold v2.0.0 with the preset reduced_dbs parameter as described in the AlphaFold database publication (Tunyasuvunakool et al. 2021). The genome annotations and pangene results were generated by Hufford et al. (2021). All B73 v5.0 protein sequences and canonical protein sequences from the other NAM founder lines were selected as input. Sequences with residue codes “*” (premature stop codon) or “X” (unknown residue) were also excluded. The 3D structures of all B73 protein sequences were predicted, and canonical protein sequences from the other NAM founder lines were extracted for 3D structure prediction. All the kept protein sequences were merged to check for duplicated protein sequences. By default, AlphaFold v2.0.0 outputs five structural models for each input sequence; the model with the highest pLDDT was selected for subsequent analyses. Because of the high computational cost, we only folded proteins with fewer than 1200 amino acids for the 25 NAM founder lines, except for B73. Because of high GPU memory requirements, some proteins failed to fold. Protein structures were defined as resolved if they were successfully predicted by AlphaFold2 and were otherwise considered to be unresolved. Protein folding was conducted using high-performance computing (HPC) computational nodes with 4 NVIDIA Quadro RTX 5000 GPU cards.
Calculation of RSA
The accessible surface area (ASA) for each amino acid residue in a protein structure was calculated using DSSP v2.3.0 (Touw et al. 2015). The maximum possible solvent accessible surface area (MaxASA) was obtained from a previous publication (Tien et al. 2013). The RSA of each amino acid residue was calculated using the formula RSA = ASA/MaxASA.
SNP annotation
The variant calling file for 282 association panels was downloaded from maize HapMap 3.2.1 (Bukowski et al. 2018) and uplifted to B73 v5.0 reference coordinates via CrossMap (Zhao et al. 2014). Allele frequencies were counted using VCFtools (Danecek et al. 2011). Based on genome annotation information in general feature format (GFF3), SNPs in protein-coding regions were extracted and classified as either synonymous SNPs or nonsynonymous SNPs. The SNP data set was annotated by GERP score from a previous publication (Kistler et al. 2018) uplifted to B73 v5.0 coordinates.
Calculation of nucleotide diversity (π)
The biallelic SNP file for each line in the 282 association panel was converted to a genomic sequence file using B73 v5.0 reference coordinates as the reference. Protein-coding sequences were extracted using GffRead (Pertea and Pertea 2020), and the same transcripts from all lines were merged into MSA files. Each codon was classified based on pLDDT bin and RSA bins. RSA value was divided into 10 bins ranging from zero to one at intervals of 0.1. πN and πS (π of nonsynonymous and synonymous mutations, respectively) were calculated by bppsuite (Guéguen et al. 2013), with MSA files used as input. The average πN and πS values for all the codons in each bin were used to perform statistical analysis and generate the plot (Supplemental Fig. S5).
Estimation of derived allele frequency
To infer the derived allele for each SNP in the maize population, the genomes of Z. mays ssp. mexicana (TIL18) and Z. mays ssp. parviglumis (TIL11) were used as outgroups. The sequences of two genomes are available at MaizeGDB (https://download.maizegdb.org/). The genomes of the two outgroups were aligned against the B73 v5.0 reference genome (Hufford et al. 2021) using AnchorWave (Song et al. 2022). The genome alignments were converted into a GVCF format file using the MAFToGVCF plugin of TASSEL (Bradbury et al. 2007). For each SNP in the maize population, if the reference allele matched either the TIL18 or TIL11 allele, the reference allele was categorized as an ancestral allele. Otherwise, if the alternative allele was identical to the TIL18 or TIL11 allele, the reference allele was defined as a derived allele. For a SNP, whose reference position was not aligned to either of those two outgroups and was therefore likely located in newly derived sequence fragments, the SNP was excluded from the analysis.
Variant calling for the NAM population and kinship matrix construction
SNP variant calling of the NAM founder lines was conducted using PHG v1 (Bradbury et al. 2022). A PHG database was constructed from the genomes of 26 NAM founder lines (Hufford et al. 2021) using the B73 v5.0 assembly as the reference. GBS reads from 4736 accessions were mapped to the pangenome, and SNP variants were imputed in the NAM RIL population. The PLINK (Purcell et al. 2007) program was used to retain only biallelic variants with the parameter “‐‐max-alleles 2,” resulting in 42,329,376 SNPs for 4736 inbred lines. The SNP-based kinship matrix G was computed using the Balding–Nichols (BN) methods in the EMMAX software (Kang et al. 2010).
Protein similarity matrix construction
The NAM population was used for PWAS and PWP. To predict protein structures at population scale, all metrics for the NAM founder lines were projected onto the NAM population with 25 families using the PHG (Supplemental Fig. S18; Bradbury et al. 2022), assuming no recombination crossover in the middle of coding genes. To measure the structural similarity within each core pangene group j, structure alignments were performed using US-align, and the structural similarity matrices were computed as TM scores with values in [0,1], using structure alignment results as input (Zhang et al. 2022). To construct sequence similarity matrices, protein sequences were aligned via one of three MSA approaches, that is, MAFFT (Katoh and Standley 2013), MUSCLE (Edgar 2004), or T-Coffee (Notredame et al. 2000). The similarity scores for each pair of sequences were calculated as numerical values in [0,1] as well. Each pair of amino acids was treated as similar to each other if they had a positive score from the BLOSUM62 matrix; otherwise, they were considered to be dissimilar to each other. For each pair of protein sequences, the similarity score was calculated as the number of similar amino acids divided by the average length of these two protein sequences. The IBD matrix for each pangene group was constructed using an identity matrix to NAM founder haplotypes.
For each type of similarity (structure-, sequence-, or IBD-based) and pangene group j, Kj was the 26 × 26 relationship matrix among the 26 founder haplotypes computed from similarity matrix Sj (https://github.com/shuaiwang2/Protein3D_QG/blob/main/PWAS/PWAS-data_processing.R). First, each relationship matrix was obtained by centering the corresponding similarity matrix: Kj = HSjH′, where H is the centering matrix H = I26 − J26/26. The pangene groups were then filtered according to the following criteria: (1) no missing haplotypes among the 26 NAM founders, (2) successful protein structure prediction for all observed haplotypes, and (3) trace of similarity matrix (sum of diagonal elements after centering) greater than 1/25. This filtering step resulted in m = 11,927 retained pangene groups across similarity metrics (US-align, MAFFT, MUSCLE, T-Coffee, IBD). The distribution of pangene is almost even on the chromosomes, except for a missing portion of Chromosome 10 (Supplemental Fig. S19).
The input to PWAS consisted of one or more PCs per retained pangene group, obtained by eigen decomposition of Kj for each pangene group j. To retain eigenvalues that contribute substantially to the overall variance of the matrix, for each pangene group j, PCs were included in PWAS if their variance explained in Kj was greater than 1 × 10⁻⁵. If there were no PCs kept, the pangene group would not be used for the following analyses. The average number of structured-based PCs included (k) was seven, with a range from one to 25. The average number of sequence-based PCs included was six, with a range from one to 25. For each pangene group j and relationship matrix Kj, the matrix of PCs used in PWAS was , where Zj is the n × 26 design matrix assigning each individual to one of the 26 founder haplotypes at the pangene group j, Uj is the 26 × k matrix of retained eigenvectors of Kj, and Λj is the k × k diagonal matrix of the corresponding eigenvalues.
The input to PWP consisted of the sum of sequence-based, IBD-based, or structure-based similarity matrices across all pangene groups. To ensure mathematical validity, similarity matrices were adjusted to positive definite matrices using the nearPD function from the Matrix package in R (Higham 2002; R Core Team 2025). To normalize proteome-wide relationship matrices, the mean of their diagonal elements was set to one as follows:
PWAS
PWAS was performed using the following linear mixed model for each pangene group j:
A total of 11,927 pangenes were investigated in PWAS separately. A total of 32 traits were analyzed in PWAS. The phenotypes used were selected from previous publications (Buckler et al. 2009; Brown et al. 2011; Kump et al. 2011; Poland et al. 2011; Tian et al. 2011; Cook et al. 2012; Hung et al. 2012; Peiffer et al. 2013; Olukolu et al. 2014; Wallace et al. 2014; Benson et al. 2015; Foerster et al. 2015; Bian and Holland 2017; Diepenbrock et al. 2017), of which the most highly correlated traits were excluded (Supplemental Table S6).
SNP-based GWAS
GWAS was implemented by GEMMA (Zhou and Stephens 2012) using default parameters. A total of 19,458,794 SNPs were used for SNP-based GWAS. SNPs with a minor allele frequency greater than 0.05 and missing rates <20% were retained using PLINK (Purcell et al. 2007). We calculated the GWAS significant threshold using Bonferroni multiple-testing correction based on the number of effective SNPs. The effective SNP count was derived with an R2 threshold of 0.99, a window size of 100,000, and a step size of 50,000, resulting into 1,090,989 SNPs. The GWAS used the same phenotypic traits as those used in the PWAS.
Variance partitioning
To assess the significance of structure-based PWP, variance partitioning was performed using the MMEst function implemented by the MM4LMM package (Laporte et al. 2022). Proteome-wide relationship matrices were used as input for variance partitioning. The “baseline” prediction model only included a SNP-based kinship matrix G. The “sequence” model included a G matrix and a proteome-wide relationship matrix P based on protein sequences. The “IBD” model included a G matrix and a P matrix based on haplotype IBD. The “structure” model included a G matrix and a P matrix based on predicted structures. The “sequence+structure” model included a G matrix and two P matrices based on sequences and predicted structures. The “IBD+structure” model included a G matrix and two P matrices based on haplotype IBD and predicted structures.
To test the statistical significance of additional random effects (e.g., structure-based genomic values), a likelihood ratio test was conducted to compare different genomic models using the following formula:
Proteome-wide prediction
To estimate the improvement of prediction accuracy using structure information, PWP was carried out using the greml function implemented in the qgg package (Rohde et al. 2020). The model applied was as follows:
In models with only one proteome-wide relationship matrix, p is a vector of “proteomic” values, such that , where P is based on either structure, sequence, or IBD. In models with two proteome-wide relationship matrices, p = p1 + p2, where , , with P1 and P2 being two different proteome-wide relationship matrices.
Considering the population properties of the NAM population, PWP models were validated by leave-one-family-out cross-validation. Each NAM family was left out as a validation data set to compute the prediction accuracy separately, whereas the other 24 NAM families were used for training. Prediction accuracy was computed as , where is the vector of predicted genotypic values: . This process was repeated for 25 iterations.
Statistical analysis
All statistical analyses used for this paper were performed in R (R Core Team 2025) and are indicated in the main text and figure legends.
Data access
All predicted protein 3D structures are available at Figshare (https://doi.org/10.25452/figshare.plus.29176679). Genotype data for the NAM association panel and protein IDs projected to NAM population are available at Figshare (https://doi.org/10.6084/m9.figshare.28349087). Custom scripts and codes used in this study are available as Supplemental Code and at GitHub (https://github.com/shuaiwang2/Protein3D_QG).
Competing interest statement
The authors declare no competing interests.
Acknowledgments
This project was supported by the U.S. Department of Agricultural (USDA) Research Service, National Science Foundation no. 1822330, the Shandong Provincial Natural Science Fund for Excellent Young Scientists Fund Program (Overseas) (2023HWYQ-109), the USDA National Institute of Food and Agriculture's Agriculture and Food Research Initiative predoctoral fellowship (M.K.-B.: 2022-67011-36458), and project SYS202206 supported by Shandong Provincial Natural Science Foundation. We thank the members of the E.S.B. laboratory (Cornell University) for helpful discussions. We thank Zhiwu Zhang (Washington State University) and Jiabo Wang (Southwest Minzu University, China) for helpful discussions of quantitative genetics analysis.
Author contributions: E.S.B., B.S., G.P.R., and M.C.R. conceived the study. S.W., B.S., and G.P.R. wrote the manuscript. B.S., L.C.J., Z.R.M., and P.J.B. performed variant calling using de novo genome assemblies. B.S. and W.J.A. performed protein structures prediction. M.K.-B. curated the phenotypes. G.P.R., D.S., and S.W. conducted the PWAS and genome prediction analysis. All authors revised and reviewed the manuscript.
Notes
[1] Supplementary material [Supplemental material is available for this article.]
[2] Article published online before print. Article, supplemental material, and publication date are at https://www.genome.org/cgi/doi/10.1101/gr.280514.125.
References
- ↵Akdel M, Pires DEV, Pardo EP, Jänes J, Zalevsky AO, Mészáros B, Bryant P, Good LL, Laskowski RA, Pozzati G, 2022. A structural biology community assessment of AlphaFold2 applications. Nat Struct Mol Biol 29: 1056–1067. 10.1038/s41594-022-00849-w
- ↵Alderson TR, Pritišanac I, Kolarić Đ, Moses AM, Forman-Kay JD. 2023. Systematic identification of conditionally folded intrinsically disordered regions by AlphaFold2. Proc Natl Acad Sci 120: e2304302120. 10.1073/pnas.2304302120
- ↵Atwell S, Huang YS, Vilhjálmsson BJ, Willems G, Horton M, Li Y, Meng D, Platt A, Tarone AM, Hu TT, 2010. Genome-wide association study of 107 phenotypes in Arabidopsis thaliana inbred lines. Nature 465: 627–631. 10.1038/nature08800
- ↵Benson JM, Poland JA, Benson BM, Stromberg EL, Nelson RJ. 2015. Resistance to gray leaf spot of maize: genetic architecture and mechanisms elucidated through nested association mapping and near-isogenic line analysis. PLoS Genet 11: e1005045. 10.1371/journal.pgen.1005045
- ↵Bertolini E, Rice BR, Braud M, Yang J, Hake S, Strable J, Lipka AE, Eveland AL. 2025. Regulatory variation controlling architectural pleiotropy in maize. Nat Commun 16: 2140. 10.1038/s41467-025-56884-w
- ↵Bian Y, Holland JB. 2017. Enhancing genomic prediction with genome-wide association studies in multiparental maize populations. Heredity (Edinb) 118: 585–593. 10.1038/hdy.2017.4
- ↵Bradbury PJ, Zhang Z, Kroon DE, Casstevens TM, Ramdoss Y, Buckler ES. 2007. TASSEL: software for association mapping of complex traits in diverse samples. Bioinformatics 23: 2633–2635. 10.1093/bioinformatics/btm308
- ↵Bradbury PJ, Casstevens T, Jensen SE, Johnson LC, Miller ZR, Monier B, Romay MC, Song B, Buckler ES. 2022. The practical haplotype graph, a platform for storing and using pangenomes for imputation. Bioinformatics 38: 3698–3702. 10.1093/bioinformatics/btac410
- ↵Brown PJ, Upadyayula N, Mahone GS, Tian F, Bradbury PJ, Myles S, Holland JB, Flint-Garcia S, McMullen MD, Buckler ES, 2011. Distinct genetic architectures for male and female inflorescence traits of maize. PLoS Genet 7: e1002383. 10.1371/journal.pgen.1002383
- ↵Buckler ES, Gaut BS, McMullen MD. 2006. Molecular and functional diversity of maize. Curr Opin Plant Biol 9: 172–176. 10.1016/j.pbi.2006.01.013
- ↵Buckler ES, Holland JB, Bradbury PJ, Acharya CB, Brown PJ, Browne C, Ersoz E, Flint-Garcia S, Garcia A, Glaubitz JC, 2009. The genetic architecture of maize flowering time. Science 325: 714–718. 10.1126/science.1174276
- ↵Buel GR, Walters KJ. 2022. Can AlphaFold2 predict the impact of missense mutations on structure? Nat Struct Mol Biol 29: 1–2. 10.1038/s41594-021-00714-2
- ↵Bukowski R, Guo X, Lu Y, Zou C, He B, Rong Z, Wang B, Xu D, Yang B, Xie C, 2018. Construction of the third-generation Zea mays haplotype map. GigaScience 7: 1–12. 10.1093/gigascience/gix134
- ↵Chakravarty D, Porter LL. 2022. Alphafold2 fails to predict protein fold switching. Protein Sci 31: e4353. 10.1002/pro.4353
- ↵Chen W, Chen L, Zhang X, Yang N, Guo J, Wang M, Ji S, Zhao X, Yin P, Cai L, 2022. Convergent selection of a WD40 protein that enhances grain yield in maize and rice. Science 375: eabg7985. 10.1126/science.abg7985
- ↵Chen W, Li X, Zhang X, Chachar Z, Lu C, Qi Y, Chang H, Wang Q. 2024. Genome-wide association study of trace elements in maize kernels. BMC Plant Biol 24: 724. 10.1186/s12870-024-05419-4
- ↵Chothia C, Lesk AM. 1986. The relation between the divergence of sequence and structure in proteins. EMBO J 5: 823–826. 10.1002/j.1460-2075.1986.tb04288.x
- ↵Cook JP, McMullen MD, Holland JB, Tian F, Bradbury P, Ross-Ibarra J, Buckler ES, Flint-Garcia SA. 2012. Genetic architecture of maize kernel composition in the nested association mapping and inbred association panels. Plant Physiol 158: 824–834. 10.1104/pp.111.185033
- ↵Danecek P, Auton A, Abecasis G, Albers CA, Banks E, DePristo MA, Handsaker RE, Lunter G, Marth GT, Sherry ST, 2011. The variant call format and VCFtools. Bioinformatics 27: 2156–2158. 10.1093/bioinformatics/btr330
- ↵Davydov EV, Goode DL, Sirota M, Cooper GM, Sidow A, Batzoglou S. 2010. Identifying a high fraction of the human genome to Be under selective constraint using GERP++. PLoS Comput Biol 6: e1001025. 10.1371/journal.pcbi.1001025
- ↵Desta ZA, Ortiz R. 2014. Genomic selection: genome-wide prediction in plant improvement. Trends Plant Sci 19: 592–601. 10.1016/j.tplants.2014.05.006
- ↵Diepenbrock CH, Kandianis CB, Lipka AE, Magallanes-Lundback M, Vaillancourt B, Góngora-Castillo E, Wallace JG, Cepela J, Mesberg A, Bradbury PJ, 2017. Novel loci underlie natural variation in vitamin E levels in maize grain. Plant Cell 29: 2374–2392. 10.1105/tpc.17.00475
- ↵Doerge RW. 2002. Mapping and analysis of quantitative trait loci in experimental populations. Nat Rev Genet 3: 43–52. 10.1038/nrg703
- ↵Edgar RC. 2004. MUSCLE: multiple sequence alignment with high accuracy and high throughput. Nucleic Acids Res 32: 1792–1797. 10.1093/nar/gkh340
- ↵Erdin S, Lisewski AM, Lichtarge O. 2011. Protein function prediction: towards integration of similarity metrics. Curr Opin Struct Biol 21: 180–188. 10.1016/j.sbi.2011.02.001
- ↵Flint-Garcia SA, Thuillet A-C, Yu J, Pressoir G, Romero SM, Mitchell SE, Doebley J, Kresovich S, Goodman MM, Buckler ES. 2005. Maize association population: a high-resolution platform for quantitative trait locus dissection: high-resolution maize association population. Plant J 44: 1054–1064. 10.1111/j.1365-313X.2005.02591.x
- ↵Foerster JM, Beissinger T, de Leon N, Kaeppler S. 2015. Large effect QTL explain natural phenotypic variation for the developmental timing of vegetative phase change in maize (Zea mays L.). Theor Appl Genet 128: 529–538. 10.1007/s00122-014-2451-3
- ↵Foster T, Yamaguchi J, Wong BC, Veit B, Hake S. 1999. Gnarley1 is a dominant mutation in the knox4 homeobox gene affecting cell shape and identity. Plant Cell 11: 1239–1252. 10.1105/tpc.11.7.1239
- ↵Gage JL, Monier B, Giri A, Buckler ES. 2020. Ten years of the maize nested association mapping population: impact, limitations, and future directions. Plant Cell 32: 2083–2093. 10.1105/tpc.19.00951
- ↵Gerasimavicius L, Teichmann SA, Marsh JA. 2025. Leveraging protein structural information to improve variant effect prediction. Curr Opin Struct Biol 92: 103023. 10.1016/j.sbi.2025.103023
- ↵Giri A, Khaipho-Burch M, Buckler ES, Ramstein GP. 2021. Haplotype associated RNA expression (HARE) improves prediction of complex traits in maize. PLoS Genet 17: e1009568. 10.1371/journal.pgen.1009568
- ↵Guéguen L, Gaillard S, Boussau B, Gouy M, Groussin M, Rochette NC, Bigot T, Fournier D, Pouyet F, Cahais V, 2013. Bio++: efficient extensible libraries and tools for computational molecular evolution. Mol Biol Evol 30: 1745–1750. 10.1093/molbev/mst097
- ↵Hicks M, Bartha I, di Iulio J, Craig Venter J, Telenti A. 2019. Functional characterization of 3D protein structures informed by human genetic diversity. Proc Natl Acad Sci 116: 8960–8965. 10.1073/pnas.1820813116
- ↵Higham NJ. 2002. Computing the nearest correlation matrix—a problem from finance. IMA J Numer Anal 22: 329–343. 10.1093/imanum/22.3.329
- ↵Hufford MB, Seetharam AS, Woodhouse MR, Chougule KM, Ou S, Liu J, Ricci WA, Guo T, Olson A, Qiu Y, 2021. De novo assembly, annotation, and comparative analysis of 26 diverse maize genomes. Science 373: 655–662. 10.1126/science.abg5289
- ↵Hung H-Y, Shannon LM, Tian F, Bradbury PJ, Chen C, Flint-Garcia SA, McMullen MD, Ware D, Buckler ES, Doebley JF, 2012. ZmCCT and the genetic basis of day-length adaptation underlying the postdomestication spread of maize. Proc Natl Acad Sci 109: E1913–E1921. 10.1073/pnas.1203189109
- ↵Jiang F, Guo M, Yang F, Duncan K, Jackson D, Rafalski A, Wang S, Li B. 2012. Mutations in an AP2 transcription factor-like gene affect internode length and leaf shape in maize. PLoS One 7: e37040. 10.1371/journal.pone.0037040
- ↵Jumper J, Evans R, Pritzel A, Green T, Figurnov M, Ronneberger O, Tunyasuvunakool K, Bates R, Žídek A, Potapenko A, 2021. Highly accurate protein structure prediction with AlphaFold. Nature 596: 583–589. 10.1038/s41586-021-03819-2
- ↵Kang HM, Sul JH, Service SK, Zaitlen NA, Kong S-Y, Freimer NB, Sabatti C, Eskin E. 2010. Variance component model to account for sample structure in genome-wide association studies. Nat Genet 42: 348–354. 10.1038/ng.548
- ↵Katoh K, Standley DM. 2013. MAFFT multiple sequence alignment software version 7: improvements in performance and usability. Mol Biol Evol 30: 772–780. 10.1093/molbev/mst010
- ↵Keys KL, Mak ACY, White MJ, Eckalbar WL, Dahl AW, Mefford J, Mikhaylova AV, Contreras MG, Elhawary JR, Eng C, 2020. On the cross-population generalizability of gene expression prediction models. PLoS Genet 16: e1008927. 10.1371/journal.pgen.1008927
- ↵Khaipho-Burch M, Ferebee T, Giri A, Ramstein G, Monier B, Yi E, Cinta Romay M, Buckler ES. 2023. Elucidating the patterns of pleiotropy and its biological relevance in maize. PLoS Genet 19: e1010664. 10.1371/journal.pgen.1010664
- ↵Kistler L, Yoshi Maezumi S, de Souza JG, Przelomska NAS, Costa FM, Smith O, Loiselle H, Ramos-Madrigal J, Wales N, Ribeiro ER, 2018. Multiproxy evidence highlights a complex evolutionary legacy of maize in South America. Science 362: 1309–1313. 10.1126/science.aav0207
- ↵Klein RJ, Xu X, Mukherjee S, Willis J, Hayes J. 2010. Successes of genome-wide association studies. Cell 142: 350–351. 10.1016/j.cell.2010.07.026
- ↵Krissinel E. 2007. On the relationship between sequence and structure similarities in proteomics. Bioinformatics 23: 717–723. 10.1093/bioinformatics/btm006
- ↵Kump KL, Bradbury PJ, Wisser RJ, Buckler ES, Belcher AR, Oropeza-Rosas MA, Zwonitzer JC, Kresovich S, McMullen MD, Ware D, 2011. Genome-wide association study of quantitative resistance to southern leaf blight in the maize nested association mapping population. Nat Genet 43: 163–168. 10.1038/ng.747
- ↵Laporte F, Charcosset A, Mary-Huard T. 2022. Efficient ReML inference in variance component mixed models using a min-max algorithm. PLoS Comput Biol 18: e1009659. 10.1371/journal.pcbi.1009659
- ↵Li C, Liu C, Qi X, Wu Y, Fei X, Mao L, Cheng B, Li X, Xie C. 2017. RNA-Guided Cas9 as an in vivo desired-target mutator in maize. Plant Biotechnol J 15: 1566–1576. 10.1111/pbi.12739
- ↵MacGowan SA, Madeira F, Britto-Borges T, Barton GJ. 2024. A unified analysis of evolutionary and population constraint in protein domains highlights structural features and pathogenic sites. Commun Biol 7: 447. 10.1038/s42003-024-06117-5
- ↵Mantilla-Perez MB, Salas Fernandez MG. 2017. Differential manipulation of leaf angle throughout the canopy: current status and prospects. J Exp Bot 68: 5699–5717. 10.1093/jxb/erx378
- ↵McBride JM, Polev K, Abdirasulov A, Reinharz V, Grzybowski BA, Tlusty T. 2023. Alphafold2 can predict single-mutation effects. Phys Rev Lett 131: 218401. 10.1103/PhysRevLett.131.218401
- ↵McMullen MD, Kresovich S, Villeda HS, Bradbury P, Li H, Sun Q, Flint-Garcia S, Thornsberry J, Acharya C, Bottoms C, 2009. Genetic properties of the maize nested association mapping population. Science 325: 737–740. 10.1126/science.1174320
- ↵Mergner J, Frejno M, List M, Papacek M, Chen X, Chaudhary A, Samaras P, Richter S, Shikata H, Messerer M, 2020. Mass-spectrometry-based draft of the Arabidopsis proteome. Nature 579: 409–414. 10.1038/s41586-020-2094-2
- ↵Notredame C, Higgins DG, Heringa J. 2000. T-Coffee: a novel method for fast and accurate multiple sequence alignment. J Mol Biol 302: 205–217. 10.1006/jmbi.2000.4042
- ↵Olukolu BA, Wang G-F, Vontimitta V, Venkata BP, Marla S, Ji J, Gachomo E, Chu K, Negeri A, Benson J, 2014. A genome-wide association study of the maize hypersensitive defense response identifies genes that cluster in related pathways. PLoS Genet 10: e1004562. 10.1371/journal.pgen.1004562
- ↵Peiffer JA, Spor A, Koren O, Jin Z, Tringe SG, Dangl JL, Buckler ES, Ley RE. 2013. Diversity and heritability of the maize rhizosphere microbiome under field conditions. Proc Natl Acad Sci 110: 6548–6553. 10.1073/pnas.1302837110
- ↵Pertea G, Pertea M. 2020. GFF utilities: GffRead and GffCompare. F1000Res 9: 304. 10.12688/f1000research.23297.1
- ↵Poland JA, Bradbury PJ, Buckler ES, Nelson RJ. 2011. Genome-wide nested association mapping of quantitative resistance to northern leaf blight in maize. Proc Natl Acad Sci 108: 6893–6898. 10.1073/pnas.1010894108
- ↵Purcell S, Neale B, Todd-Brown K, Thomas L, Ferreira MAR, Bender D, Maller J, Sklar P, de Bakker PIW, Daly MJ, 2007. PLINK: a tool set for whole-genome association and population-based linkage analyses. Am J Hum Genet 81: 559–575. 10.1086/519795
- ↵Ramsey DC, Scherrer MP, Zhou T, Wilke CO. 2011. The relationship between relative solvent accessibility and evolutionary rate in protein evolution. Genetics 188: 479–488. 10.1534/genetics.111.128025
- ↵Ramstein GP, Buckler ES. 2022. Prediction of evolutionary constraint by genomic annotations improves functional prioritization of genomic variants in maize. Genome Biol 23: 183. 10.1186/s13059-022-02747-2
- ↵R Core Team. 2025. R: a language and environment for statistical computing. R Foundation for Statistical Computing, Vienna. https://www.R-project.org/.
- ↵Rohde PD, Sørensen IF, Sørensen P. 2020. qgg: an R package for large-scale quantitative genetic analyses. Bioinformatics 36: 2614–2615. 10.1093/bioinformatics/btz955
- ↵Salzberg SL. 2019. Next-generation genome annotation: we still struggle to get it right. Genome Biol 20: 92. 10.1186/s13059-019-1715-2
- ↵Sato Y, Sentoku N, Miura Y, Hirochika H, Kitano H, Matsuoka M. 1999. Loss-of-function mutations in the rice homeobox gene OSH15 affect the architecture of internodes resulting in dwarf plants. EMBO J 18: 992–1002. 10.1093/emboj/18.4.992
- ↵Savojardo C, Manfredi M, Martelli PL, Casadio R. 2021. Solvent accessibility of residues undergoing pathogenic variations in humans: from protein structures to protein sequences. Front Mol Biosci 7: 626363. 10.3389/fmolb.2020.626363
- ↵Schnable PS, Ware D, Fulton RS, Stein JC, Wei F, Pasternak S, Liang C, Zhang J, Fulton L, Graves TA, 2009. The B73 maize genome: complexity, diversity, and dynamics. Science 326: 1112–1115. 10.1126/science.1178534
- ↵Song B, Mott R, Gan X. 2018. Recovery of novel association loci in Arabidopsis thaliana and Drosophila melanogaster through leveraging INDELs association and integrated burden test. PLoS Genet 14: e1007699. 10.1371/journal.pgen.1007699
- ↵Song B, Marco-Sola S, Moreto M, Johnson L, Buckler ES, Stitzer MC. 2022. AnchorWave: sensitive alignment of genomes with high sequence diversity, extensive structural polymorphism, and whole-genome duplication. Proc Natl Acad Sci 119: e2113075119. 10.1073/pnas.2113075119
- ↵Song B, Buckler ES, Stitzer MC. 2024. New whole-genome alignment tools are needed for tapping into plant diversity. Trends Plant Sci 29: 355–369. 10.1016/j.tplants.2023.08.013
- ↵Stein RA, Mchaourab HS. 2024. Rosetta energy analysis of AlphaFold2 models: point mutations and conformational ensembles. bioRxiv 10.1101/2023.09.05.556364
- ↵Sun S, Wang B, Li C, Xu G, Yang J, Hufford MB, Ross-Ibarra J, Wang H, Wang L. 2023. Unraveling prevalence and effects of deleterious mutations in maize elite lines across decades of modern breeding. Mol Biol Evol 40: msad170. 10.1093/molbev/msad170
- ↵Tam V, Patel N, Turcotte M, Bossé Y, Paré G, Meyre D. 2019. Benefits and limitations of genome-wide association studies. Nat Rev Genet 20: 467–484. 10.1038/s41576-019-0127-1
- ↵Tian F, Bradbury PJ, Brown PJ, Hung H, Sun Q, Flint-Garcia S, Rocheford TR, McMullen MD, Holland JB, Buckler ES. 2011. Genome-wide association study of leaf architecture in the maize nested association mapping population. Nat Genet 43: 159–162. 10.1038/ng.746
- ↵Tien MZ, Meyer AG, Sydykova DK, Spielman SJ, Wilke CO. 2013. Maximum allowed solvent accessibilites of residues in proteins. PLoS One 8: e80635. 10.1371/journal.pone.0080635
- ↵Togninalli M, Seren Ü, Freudenthal JA, Grey Monroe J, Meng D, Nordborg M, Weigel D, Borgwardt K, Korte A, Grimm DG. 2020. AraPheno and the AraGWAS catalog 2020: a major database update including RNA-seq and knockout mutation data for Arabidopsis thaliana. Nucleic Acids Res 48: D1063–D1068. 10.1093/nar/gkz925
- ↵Touw WG, Baakman C, Black J, te Beek TAH, Krieger E, Joosten RP, Vriend G. 2015. A series of PDB-related databanks for everyday needs. Nucleic Acids Res 43: D364–D368. 10.1093/nar/gku1028
- ↵Tunyasuvunakool K, Adler J, Wu Z, Green T, Zielinski M, Žídek A, Bridgland A, Cowie A, Meyer C, Laydon A, 2021. Highly accurate protein structure prediction for the human proteome. Nature 596: 590–596. 10.1038/s41586-021-03828-1
- ↵Vishnoi A, Sethupathy P, Simola D, Plotkin JB, Hannenhalli S. 2011. Genome-wide survey of natural selection on functional, structural, and network properties of polymorphic sites in Saccharomyces paradoxus. Mol Biol Evol 28: 2615–2627. 10.1093/molbev/msr085
- ↵Wallace JG, Bradbury PJ, Zhang N, Gibon Y, Stitt M, Buckler ES. 2014. Association mapping across numerous traits reveals patterns of functional variation in maize. PLoS Genet 10: e1004845. 10.1371/journal.pgen.1004845
- ↵Wang J, Yang W, Zhang S, Hu H, Yuan Y, Dong J, Chen L, Ma Y, Yang T, Zhou L, 2023. A pangenome analysis pipeline provides insights into functional gene identification in rice. Genome Biol 24: 19. 10.1186/s13059-023-02861-9
- ↵Werner JD, Borevitz JO, Henriette Uhlenhaut N, Ecker JR, Chory J, Weigel D. 2005. FRIGIDA-independent variation in flowering time of natural Arabidopsis thaliana accessions. Genetics 170: 1197–1207. 10.1534/genetics.104.036533
- ↵Wheelan SJ, Marchler-Bauer A, Bryant SH. 2000. Domain size distributions can predict domain boundaries. Bioinformatics 16: 613–618. 10.1093/bioinformatics/16.7.613
- ↵Windhausen VS, Atlin GN, Hickey JM, Crossa J, Jannink J-L, Sorrells ME, Raman B, Cairns JE, Tarekegne A, Semagn K, 2012. Effectiveness of genomic prediction of maize hybrid performance in different breeding populations and environments. G3 (Bethesda) 2: 1427–1436. 10.1534/g3.112.003699
- ↵Wingo AP, Liu Y, Gerasimov ES, Gockley J, Logsdon BA, Duong DM, Dammer EB, Robins C, Beach TG, Reiman EM, 2021. Integrating human brain proteomes with genome-wide association data implicates new proteins in Alzheimer's disease pathogenesis. Nat Genet 53: 143–146. 10.1038/s41588-020-00773-z
- ↵Wolf MY, Wolf YI, Koonin EV. 2008. Comparable contributions of structural-functional constraints and expression level to the rate of protein sequence evolution. Biol Direct 3: 40. 10.1186/1745-6150-3-40
- ↵Wu Y, Li D, Hu Y, Li H, Ramstein GP, Zhou S, Zhang X, Bao Z, Zhang Y, Song B, 2023. Phylogenomic discovery of deleterious mutations facilitates hybrid potato breeding. Cell 186: 2313–2328.e15. 10.1016/j.cell.2023.04.008
- ↵Xiao Y, Liu H, Wu L, Warburton M, Yan J. 2017. Genome-wide association studies in maize: praise and stargaze. Mol Plant 10: 359–374. 10.1016/j.molp.2016.12.008
- ↵Xie L, Gong X, Yang K, Huang Y, Zhang S, Shen L, Sun Y, Wu D, Ye C, Zhu Q-H, 2024. Technology-enabled great leap in deciphering plant genomes. Nat Plants 10: 551–566. 10.1038/s41477-024-01655-6
- ↵Yang J, Mezmouk S, Baumgarten A, Buckler ES, Guill KE, McMullen MD, Mumm RH, Ross-Ibarra J. 2017. Incomplete dominance of deleterious alleles contributes substantially to trait variation and heterosis in maize. PLoS Genet 13: e1007019. 10.1371/journal.pgen.1007019
- ↵Yang G, Pan Y, Pan W, Song Q, Zhang R, Tong W, Cui L, Ji W, Song W, Song B, 2024. Combined GWAS and eGWAS reveals the genetic basis underlying drought tolerance in emmer wheat (Triticum turgidum L.). New Phytol 242: 2115–2131. 10.1111/nph.19589
- ↵Zhang Z, Ersoz E, Lai C-Q, Todhunter RJ, Tiwari HK, Gore MA, Bradbury PJ, Yu J, Arnett DK, Ordovas JM, 2010. Mixed linear model approach adapted for genome-wide association studies. Nat Genet 42: 355–360. 10.1038/ng.546
- ↵Zhang C, Shine M, Pyle AM, Zhang Y. 2022. US-Align: universal structure alignments of proteins, nucleic acids, and macromolecular complexes. Nat Methods 19: 1109–1115. 10.1038/s41592-022-01585-1
- ↵Zhao H, Sun Z, Wang J, Huang H, Kocher J-P, Wang L. 2014. CrossMap: a versatile tool for coordinate conversion between genome assemblies. Bioinformatics 30: 1006–1007. 10.1093/bioinformatics/btt730
- ↵Zhou X, Stephens M. 2012. Genome-wide efficient mixed-model analysis for association studies. Nat Genet 44: 821–824. 10.1038/ng.2310