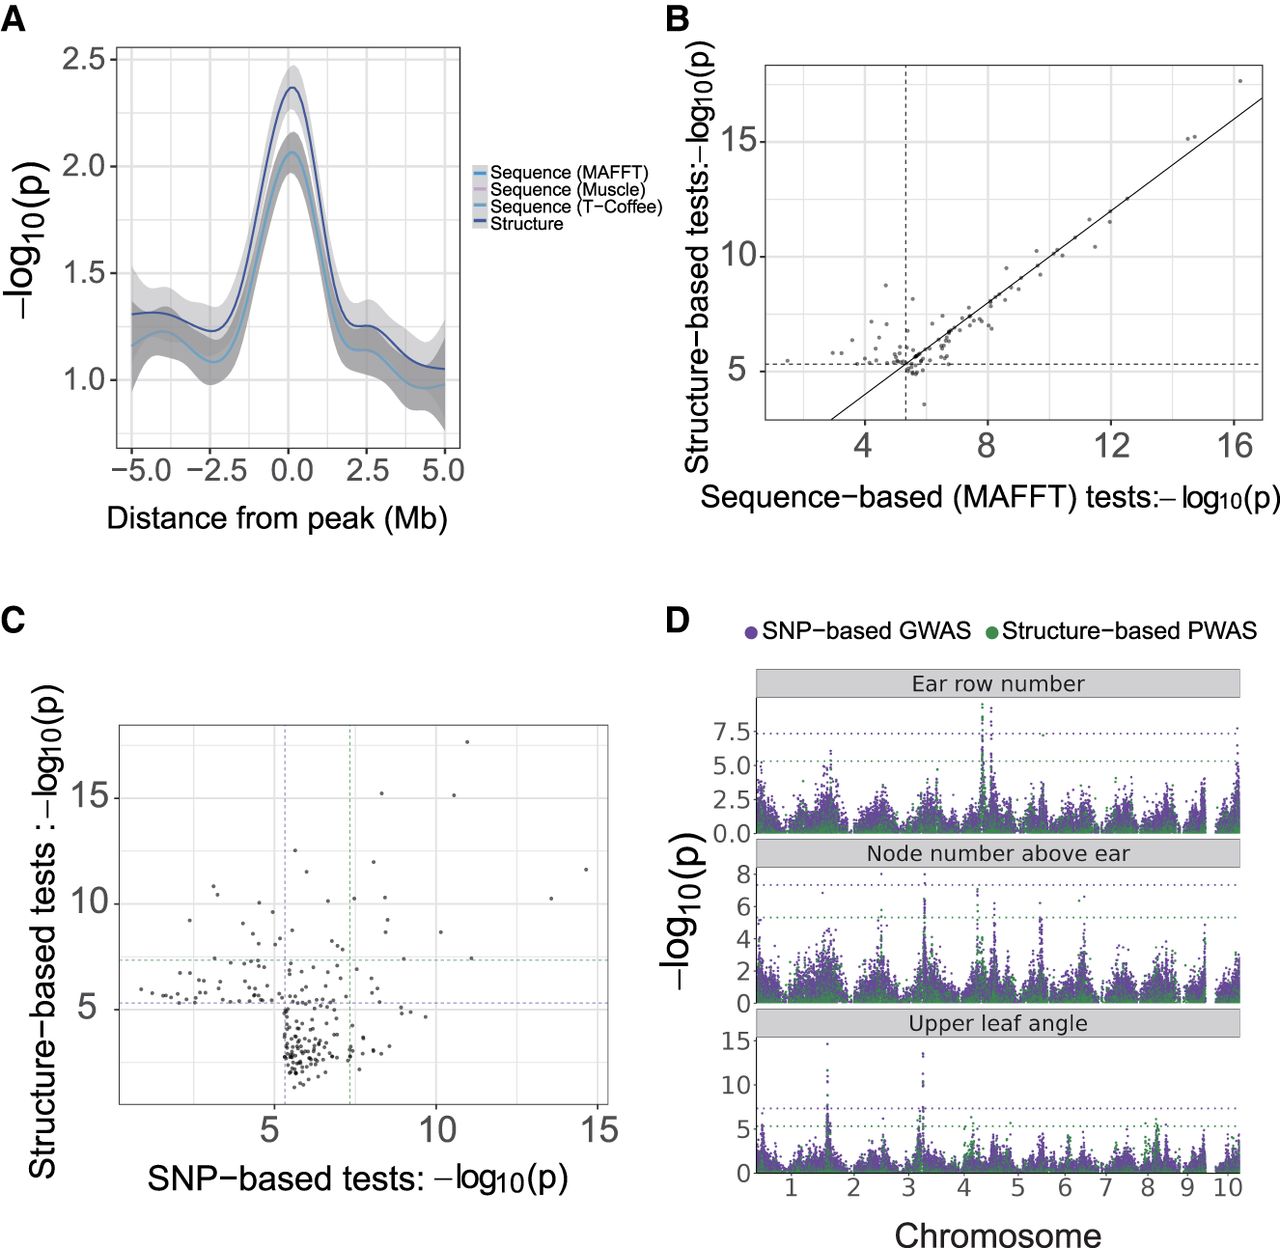
Comparison between association analyses. (A) Decay of significance over physical distance from significance peaks in PWAS. The peak is at the starting point of a significant gene. (B) Significant association signals from structure- and sequence-based PWAS. The dashed lines correspond to a 5% significance threshold with Bonferroni correction. (C) Significant loci from structure-based PWAS and SNP-based GWAS. The dashed lines correspond to a 5% significance threshold with Bonferroni correction (5.32 in green for structure-based PWAS, 7.34 in purple for SNP-based GWAS). In SNP-based GWAS, significant genes are selected based on the most significant SNP in coding regions. (D) Manhattan plot of structure-based PWAS and SNP-based GWAS. Traits shown are ear row number, node number above ear, and upper leaf angle. The dashed lines are identical to those shown in C.