Figure 2.
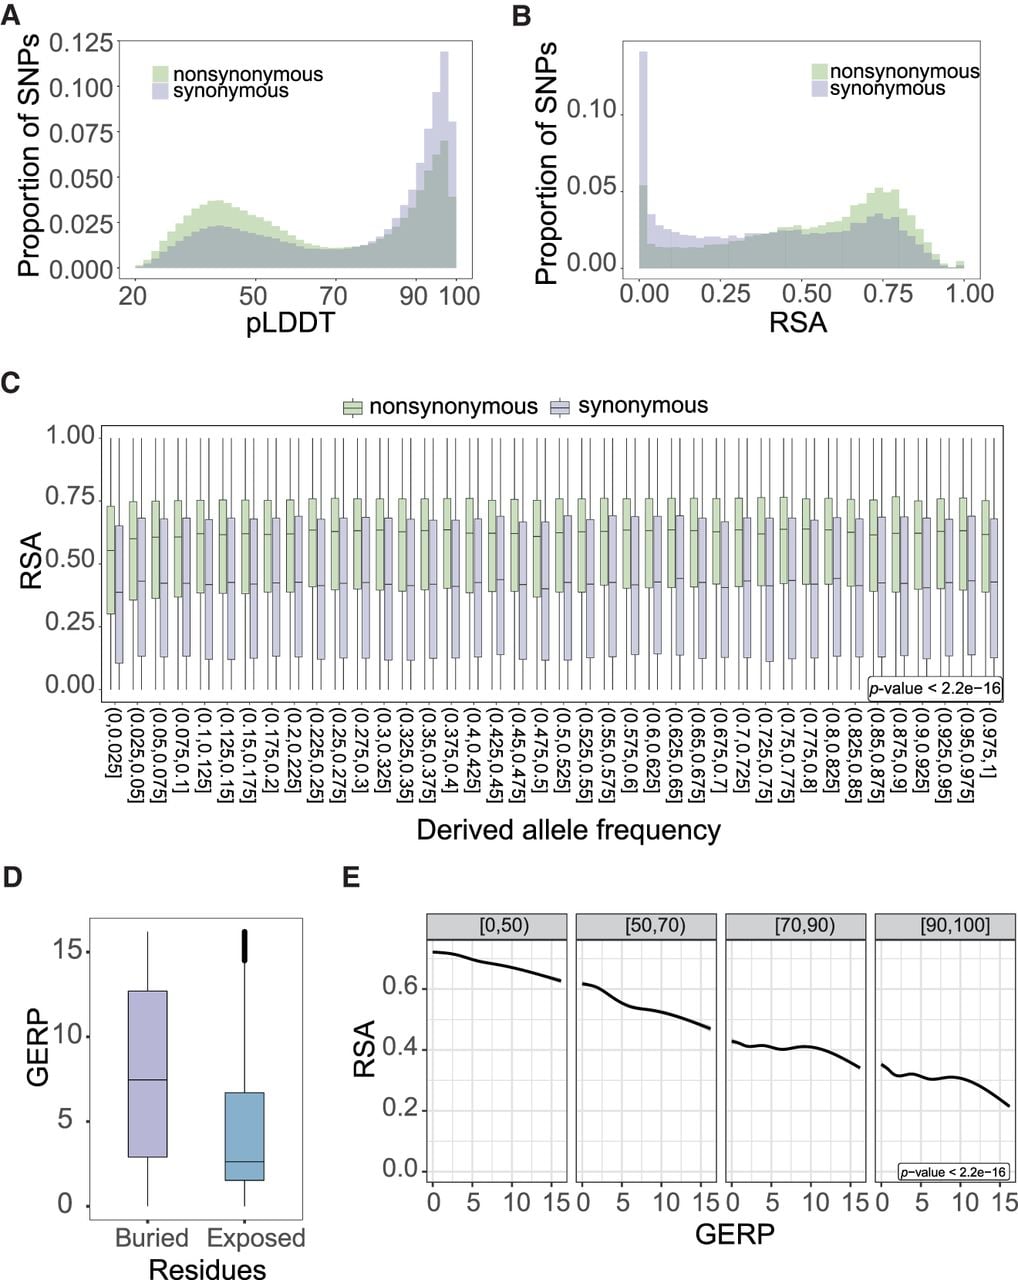
Protein structure predictions provide functional insights into natural selection in maize. (A) Density distribution of pLDDT scores between synonymous and nonsynonymous SNPs. (B) Density distribution of RSA between synonymous and nonsynonymous SNPs. (C) Distribution of RSA for different derived allele frequencies. (D) Relationship between GERP scores and buried (RSA < 0.5) or exposed residues. Median value is shown as a solid middle line within the box plot, which spans from the 25th to 75th percentiles. For definition of buried and exposed residues, see Supplemental Figure S4. (E) Correlation between RSA and GERP scores divided by pLDDT score bins (as indicated by the gray shading above the plots).