
Abstract
The development of spatial transcriptomics (ST) technologies has revolutionized the way we map the complex organization and functions of tissues. These technologies offer valuable insights into the organization and function of complex biological systems. However, existing methods often focus too narrowly on single modalities or resolutions, thereby hindering the comprehensive capture of multilayered biological heterogeneity. Here, STMSC is proposed as a multislice joint analysis framework featuring a precorrection mechanism that enables the precise identification of complex spatial domains, advancing disease pathology insights. STMSC assumes that precise three-dimensional (3D) reconstruction is essential for an in-depth investigation of tissue components and mechanisms. Incorporating hematoxylin and eosin (H&E) imaging data, STMSC enhances slice alignment accuracy in 3D reconstruction. By deconstructing microenvironments, it reconstructs fine-grained cellular landscapes and emphasizes collective cellular behavior in defining spatial domains. Its graph attention autoencoder with precorrection balances biological information at different levels, improving the accuracy of ST analyses. By analyzing consecutive tissue slices and pathological data sets, STMSC accurately reconstructs 3D structures and provides deeper insights into complex cancer environments. Specifically, STMSC captures intra- and interstage heterogeneity in cancer development, offering novel insights into the complexity of pathological tissue structures.
Spatial transcriptomics (ST) technologies have revolutionized biotechnology by enabling precise localization of gene expression within tissues, offering critical insights into complex tissue architecture and function (You et al. 2024). Unlike traditional transcriptomic approaches, ST preserves spatial context, unveiling cellular heterogeneity essential for studying organs (Rao et al. 2021; Srivatsan et al. 2021; Bergmann et al. 2022; Chen et al. 2022) and tumors (Lewis et al. 2021; Pelka et al. 2021; Erickson et al. 2022; Kuppe et al. 2022). Current ST technologies fall into two categories: image-based and sequencing-based. Image-based methods, such as seqFISH (Shah et al. 2016), osmFISH (Codeluppi et al. 2018), CosMx (He et al. 2022), and MERFISH (Zhang et al. 2021), achieve single-cell (SC) resolution but are costly and limited in gene panel size. Sequencing-based techniques such as 10x Genomics Visium (https://www.10xgenomics.com), and Slide-seq (Rodriques et al. 2019; Stickels et al. 2021) provide broader transcriptomic coverage at lower cost but lack SC resolution owing to spot-level sequencing. Advanced technologies like Stereo-seq (Chen et al. 2022), Visium HD (Nagendran et al. 2023), Pixel-seq (Fu et al. 2022), and Seq-Scope (Cho et al. 2021) can achieve subcellular resolution and potentially enable SC analysis through cell segmentation. However, in practice, Stereo-seq, Visium HD, and Seq-Scope data are often aggregated into coarser spatial bins for analysis rather than relying on cell segmentation. (Benjamin et al. 2024). To address this limitation, we model each sequencing-based spot as a microenvironment comprising diverse cell types and leverage AI-driven deconvolution to reconstruct cellular-level representations, refining ST analysis and facilitating accurate three-dimensional (3D) tissue reconstruction.
Despite the spatial insights ST provides, most current data consist of parallel two-dimensional (2D) slices, whereas biological processes occur in 3D. This 2D constraint can distort tissue structures, such as neural connections in the hippocampus (Akam et al. 2012), limiting our understanding of function and pathology. Multislice joint analysis is thus essential for reconstructing 3D spatial structures and obtaining a comprehensive view of tissue organization. Furthermore, in ST, accurate 3D spatial domain identification is crucial for understanding tissue structure and function. 3D spatial domains are specific regions of tissue comprising cells that not only share functional attributes but also exhibit expression patterns reflecting their spatial context (Uttam et al. 2020; Dong and Zhang 2022; Zhong et al. 2024). Identifying these domains requires balancing cell-oriented (microlevel) and microenvironment-oriented (macrolevel) perspectives. The former focuses on high-resolution transcriptional differences at the SC level, whereas the latter emphasizes spatial structure and intercellular interactions. Overemphasizing either can obscure the interplay between cellular heterogeneity and tissue function. Integrating both perspectives is essential for capturing multiscale biological complexity and achieving precise 3D spatial domain delineation.
Early analytical methods primarily focused on single-slice ST. stLearn (Pham et al. 2023) is the first deep learning–based method to integrate hematoxylin and eosin (H&E) images, spatial coordinates, and gene expression data to improve spatial domain identification. With advancements in research, approaches such as BayesSpace (Zhao et al. 2021), SpaGCN (Hu et al. 2021), and STAGATE (Dong and Zhang 2022) have refined single-slice analysis. BayesSpace applies Bayesian statistics and Markov chain Monte Carlo (MCMC) to enhance spatial resolution and delineate spatial domains. SpaGCN integrates H&E histopathology images with gene expression and spatial localization using graph convolutional networks (CGNs) for spatial domain identification. STAGATE employs graph attention autoencoders (GAEs) to learn low-dimensional latent representations of spatial and gene expression data, facilitating spatial domain recognition. As researchers gain a deeper understanding of tissue spatial organization, methods for 3D spatial domain identification have emerged; for example, STAligner (Zhou et al. 2023) aligns slices on shared landmarks without requiring point correspondences between adjacent slices. However, this method focuses solely on gene expression information within bins, leading to a partial understanding of the biological system as a whole. STitch3D (Wang et al. 2023) integrates data from multiple 2D tissue slices with paired single-cell RNA (scRNA) sequencing to characterize complex tissue architectures. This approach neglects the critical role of H&E image data. These images are correlated with gene expression patterns, and unlike gene expression data, they capture spot features that remain unaffected by molecular diffusion (Badea and Stănescu 2020; Schmauch et al. 2020; Ash et al. 2021). This provides crucial phenotypic insights that are indispensable for precise slice alignment and accurate 3D tissue reconstruction. GraphST (Long et al. 2023) utilizes deep graph information maximization (DGI) to compare information between a point and its spatial neighbors. However, it falls short in acknowledging that spatial domain identification is influenced more by the distribution of entire cell types than by individual cells. Moreover, the scube and splane modules of SPACEL (Xu et al. 2023) enhance the transformation of spatial coordinates and the identification of spatial domains in consecutive slices. This method underestimates the importance of accurate 3D reconstruction as a prerequisite for in-depth exploration of the various components and mechanisms within tissues.
Addressing the limitations inherent in current methodologies, this paper introduces a multislice joint analysis framework with a precorrection mechanism (STMSC). STMSC integrates slice alignment via the H&E image and performs spot deconvolution while simultaneously constructing the latent space for spatial domain identification, aiming to better reflect the organizational structure of spatial domains. Notably, the STMSC framework introduces innovations in three key areas: (1) STMSC enhances multislice integration via a novel H&E-based alignment algorithm, enabling precise 3D tissue reconstruction; (2) STMSC reconstructs the microenvironment by estimating cell type compositions within spatial bins, addressing microlevel information loss and highlighting the collective behavior of cells in spatial domain formation; and (3) STMSC introduces a precorrection mechanism combined with a GAE, ensuring balanced micro- and macrolevel data while mitigating error accumulation.
Results
Overview of the STMSC framework
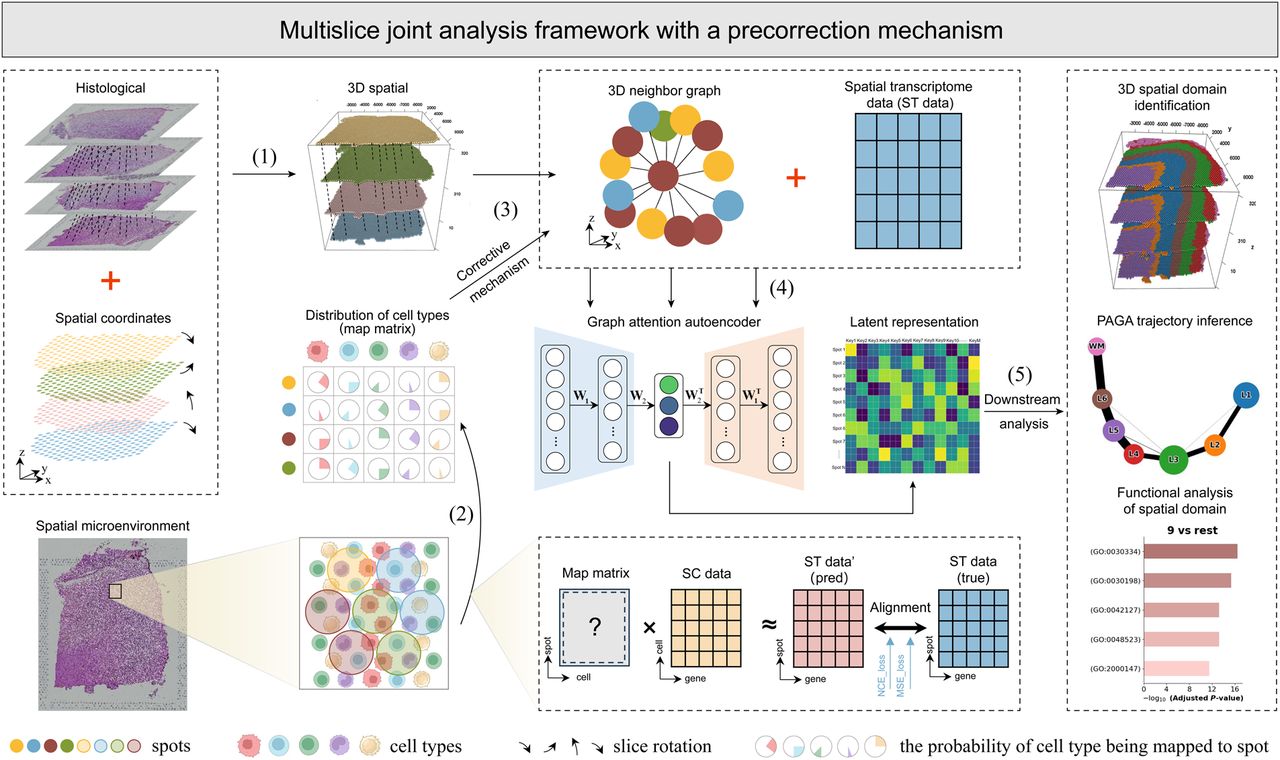
STMSC is a deep learning data analysis framework tailored for ST data. This framework takes as input gene expression data, spatial coordinates, and histological images from ST, integrating corresponding SC data to provide a comprehensive latent representation of spatial information for subsequent biological analysis. First, STMSC performs the task of slice alignment (Fig. 1, step 1). This step begins by digitizing H&E-stained images and combining spatial coordinates with image information to achieve precise slice alignment, resulting in 3D spatial coordinates. Utilizing these coordinates, k-nearest neighbor (K-NN) graphs are constructed. Next, STMSC uses SC data to deconstruct the microenvironment, accurately capturing biological information at the cell level for each spot and creating a complete cellular landscape (Fig. 1, step 2). This information is used to further refine the neighborhood graph (Fig. 1, step 3), effectively addressing issues that may arise with traditional spatial coordinate distance measurements at complex domain boundaries. Finally, the corrected 3D neighborhood graph and ST gene expression data are input into a GAE (Fig. 1, step 4). This model learns the latent spatial representation of spots, which reflects the biological information and structural characteristics within the tissue. Once trained, these latent representations can be used for spatial domain identification, 3D tissue structure reconstruction, and various downstream analysis tasks (Fig. 1, step 5). Among the downstream analyses, trajectory inference was conducted with particular attention to biological plausibility. To this end, the human cerebral cortex data set was selected, as it follows a well-characterized linear developmental trajectory, in contrast to more structurally complex tissues such as breast cancer. Figure 1 depicts the comprehensive architectural framework of STMSC, and the Methods section provides detailed algorithmic specifics.
Overview of STMSC. (1) Slice alignment: uses iterative closest point (ICP) (Arun et al. 1987) to align multiple slices, establishing the three-dimensional (3D) positions of spots and constructing a global 3D structure. (2) Microenvironmental deconstruction: trains a cell-to-spot mapping matrix M using spatial transcriptomic (ST) gene expression data (Xst) and single-cell data (Xsc) via a spatially informed contrastive learning model. In this model, the similarity of positive pairs (i.e., spatially adjacent spots) is maximized, whereas the similarity of negative pairs (i.e., spatially nonadjacent spots) is minimized. (3) Construction and correction of 3D neighborhood graph. (4) Joint modeling: STMSC jointly models multiple slices and employs a graph attention mechanism-based autoencoder to learn latent spot representations with 3D spatial information. (5) Downstream analysis: The learned latent representations serve as inputs for downstream analysis, including 3D spatial domain identification and spatial trajectory inference.
In this section, we aim to validate the efficacy of the STMSC model in accurately identifying 3D spatial domains and reconstructing complex 3D spatial structures. First, we demonstrate the model's ability to precisely delineate cortical regions and reconstruct the 3D spatial architecture of the human brain. Next, we demonstrate STMSC's ability to capture multilayered biological heterogeneity, thereby revealing subtle biological textures. Finally, we show how accurate spatial domain identification by STMSC provides deeper insights into complex cancer microenvironments. Additionally, we validate our approach using simulated data sets (Supplemental Table 1), with detailed analyses provided in Supplemental Section 2.
STMSC reconstructs the 3D spatial organization of the human brain and accurately identifies spatial domains
In this study, we utilize a data set from the dorsolateral prefrontal cortex (DLPFC) of three adult human samples (Maynard et al. 2021), each consisting of four consecutive tissue slices, generated using the 10x Genomics Visium platform (Maynard et al. 2021). These sections are meticulously annotated with different cortical layers (layers I through VI) and white matter (WM) regions. These annotations serve as a benchmark for comprehensively assessing the spatial domain recognition capabilities of the STMSC model in both single-slice and multislice data integration scenarios. The correspondence between slice names and slice numbers is provided in Supplemental Table 7.
First, the multislice alignment step, incorporating both coordinate information and histological images, effectively reconstructed 3D tissue structures (Fig. 2A), enriching the information available for 3D spatial domain identification. We then quantitatively evaluated the spatial domain recognition capabilities of STMSC using the adjusted Rand index (ARI) (Fig. 2B) and conducted a detailed comparison with existing advanced ST analysis methods, including SpaGCN (Hu et al. 2021), STAGATE (Dong and Zhang 2022), STAligner (Zhou et al. 2023), GraphST (Long et al. 2023), STitch3D (Wang et al. 2023), and SPACEL (Xu et al. 2023). In Figure 2B, the height of each bar represents the average ARI across 12 tissue slices for a given method, and each dot denotes the ARI score from an individual slice, providing a direct visualization of both overall performance and variability across slices. Notably, STMSC consistently achieves higher mean ARI values than all other methods across the 12 slices, indicating its superior performance in spatial domain identification. These gains likely result from STMSC's ability to integrate latent spatial information across tissue sections (Fig. 2D; Haghverdi et al. 2016; Wolf et al. 2019). The latent representations of all sections exhibit consistent patterns, with trajectories from the WM to layer I aligning with the neurogenesis sequence during cortical development (Gilmore and Herrup 1997). STMSC further validates the consistency between spatial domain trajectories and spatial maps, highlighting its exceptional performance in 3D spatial domain recognition.
3D reconstruction of the human brain and comparison with other advanced methods. (A) 3D spatial domain identification results for DLPFC data. (B) Comparison results of clustering index ARI. (C) Mean results of ablation experiments on the STMSC. (D) UMAP visualization of STMSC's learned spot representations in the shared latent space. (E) Results of ablation experiments on the STMSC. (F) 2D visualization results of spatial domain recognition. (G) Spatial distribution of cell types on section Sample3-Slice1.
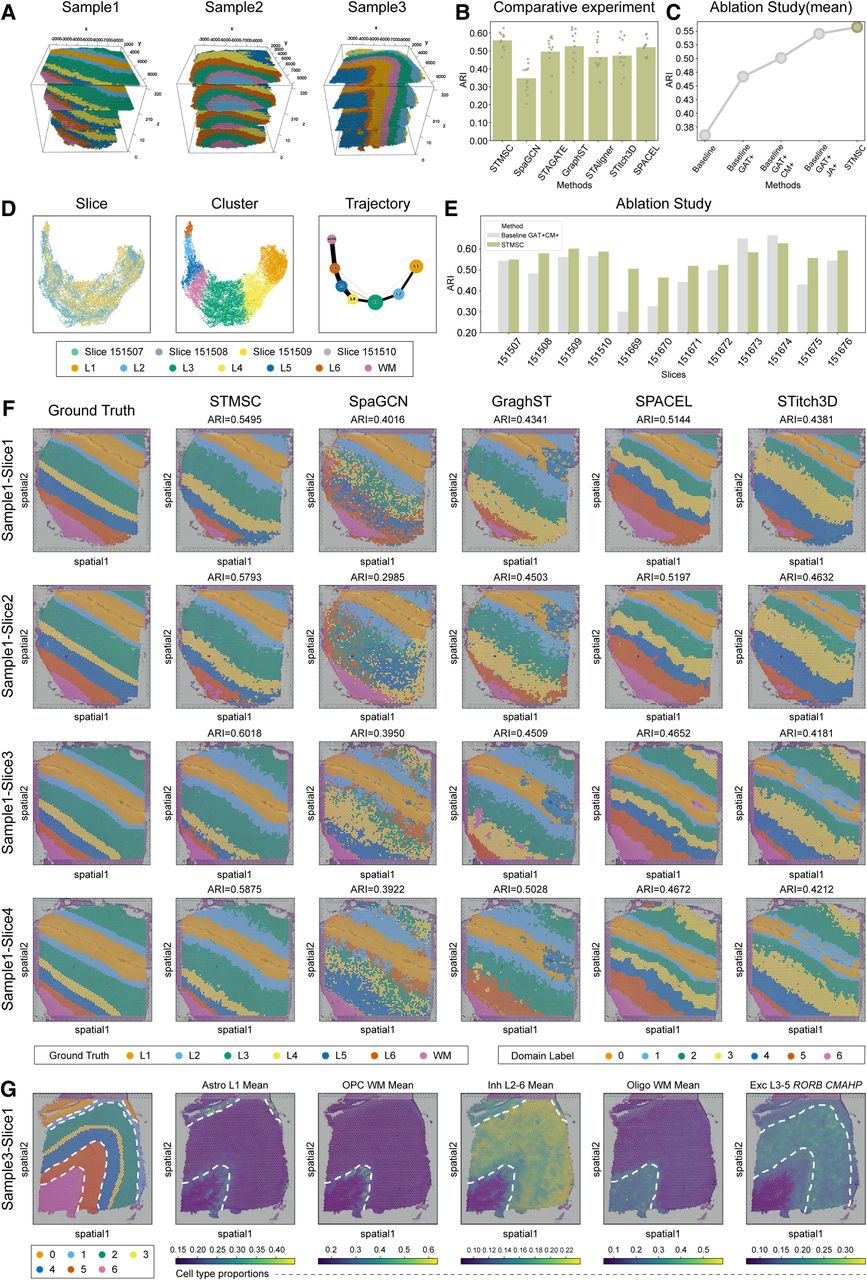
Second, we conducted a detailed analysis on four consecutive slices from Sample 1 (Fig. 2F), utilizing UMAP to visualize the spatial domain recognition results of STMSC, SpaGCN, GraphST, SPACEL, and Stitch3D. The results indicate that SpaGCN faces challenges in processing cortical boundaries, making them less clearly identifiable. GraphST shows some inconsistencies in layer integrity, leading to mixing within the same domain. SPACEL detects an additional cortical region in the upper right corner of Sample1-Slice3 and Sample1-Slice4, where such a structure is not typically found. SPACEL demonstrates better performance in identifying thinner layers, likely owing to its ability to generate smoother boundaries in structured cortical regions. Stitch3D exhibits domain mixing in spatial domain 0, which affects the accurate identification of layers. Compared with other methods, STMSC excels in accurately identifying each cortical layer (i.e., spatial domain) with minimal interlayer confusion, achieving a higher level of completeness in layer delineation than competing approaches. This outcome validates the effectiveness of STMSC's design in reconstructing 3D tissue structures, characterizing the cellular landscape, and capturing subtle biological textures within tissues, ultimately enhancing the accuracy of spatial domain identification.
Furthermore, to evaluate the reliability of microenvironmental structures identified with our framework, we analyzed sample3-slice1 as an example. Because of the lack of direct experimental evidence detailing the cellular composition at each point in this data set, we used the correlation annotations from the original study (Maynard et al. 2021) as a reference. The results (Fig. 2G) show that oligodendrocyte (Oligo) subtypes are predominantly expressed in the WM, whereas astrocyte (Astro) subtypes are preferentially expressed in layer L1. Oligodendrocyte precursor cells (OPCs), which are immature Oligos that can differentiate into mature Oligos, are located along the edges of the WM, aligning with biological expectations. Additionally, inhibitory (Inh) neurons are primarily distributed across layers L2 to L6. To further investigate, we performed a detailed visualization of excitatory neurons. According to the literature, excitatory neurons (Exc) marked by RORB and CMAHP are mainly distributed in layers L3 to L5, consistent with our observations. In conclusion, our experimental findings confirm the reliability of the microenvironmental structure module within our framework, as its analytical outcomes closely correspond to the cortical annotations presented in the original study. This alignment not only attests to the accuracy of our method but also facilitates new advancements in the study of the human cerebral cortex. By offering deeper insights into the cellular composition and spatial distribution within the cortex, our research establishes a solid foundation for future investigations in the field of neuroscience.
Finally, we conducted an ablation analysis using the DLPFC data set. We systematically evaluated the impact of each module within the STMSC framework by generating several ablated versions: baseline GAT+JA+, which removes the correction module; baseline GAT+CM+, which excludes the multislice joint analysis module; baseline GAT+, which omits both the correction mechanism and the multislice joint analysis module; and baseline, which eliminates the correction mechanism, multislice joint analysis, and GAE. The results (Fig. 2C,E) demonstrate that the average performance of STMSC across the 12 slices outperforms all ablated versions, confirming the necessity and effectiveness of each module. This indicates that adding H&E image data offers essential phenotypic information, which improves the slice alignment task and increases the effectiveness of multilayer joint analysis. The reconstruction of the cellular landscape and the insights gained into collective cellular behaviors within tissues are essential for accurate domain identification. Moreover, the introduced precorrection mechanism effectively aids in capturing subtle biological textures within tissues. In summary, the results of this experiment validate the concepts discussed earlier in this paper.
STMSC enhances domain identification by capturing multilevel biological heterogeneity, thereby revealing subtle biological textures
Accurately identifying and characterizing small spatial domains is critical in the study of biological tissue microstructures (Kalita-de Croft et al. 2021; Zheng et al. 2023). Given the highly complex architecture of the brain cortex, adjacent regions may differ in cellular composition and function. Therefore, constructing a detailed cellular landscape of the tissue is essential. STMSC addresses the challenge of missing microlevel information by employing a microenvironment deconstruction task, thereby providing critical support for domain identification. Additionally, traditional distance-based graph structuring methods may fail to define domain boundaries effectively. To address this, the STMSC model incorporates a precorrection mechanism that utilizes fine-grained cellular composition data to enhance domain delineation. The effectiveness of this mechanism and the model's capability in identifying subtle biological structures were validated using 10x Visium data from coronal brain sections of mice, annotated with gene expression maps from the Allen Brain Atlas and Mouse Brain available through Squidpy (Fig. 3A, left; Palla et al. 2022).
Analysis of the mouse coronal brain data set. (A) 2D visualization of STMSC spatial domain identification versus true labels. (B) Alluvial plot showing correspondence between STMSC domains and manual annotations (ground truth). (C) 2D visualization of spatial domain identification by other methods. (D) ARI comparison of clustering on the mouse prefrontal cortex. (E) Ablation study results. (F) Dotplot of spatially differentially expressed genes.
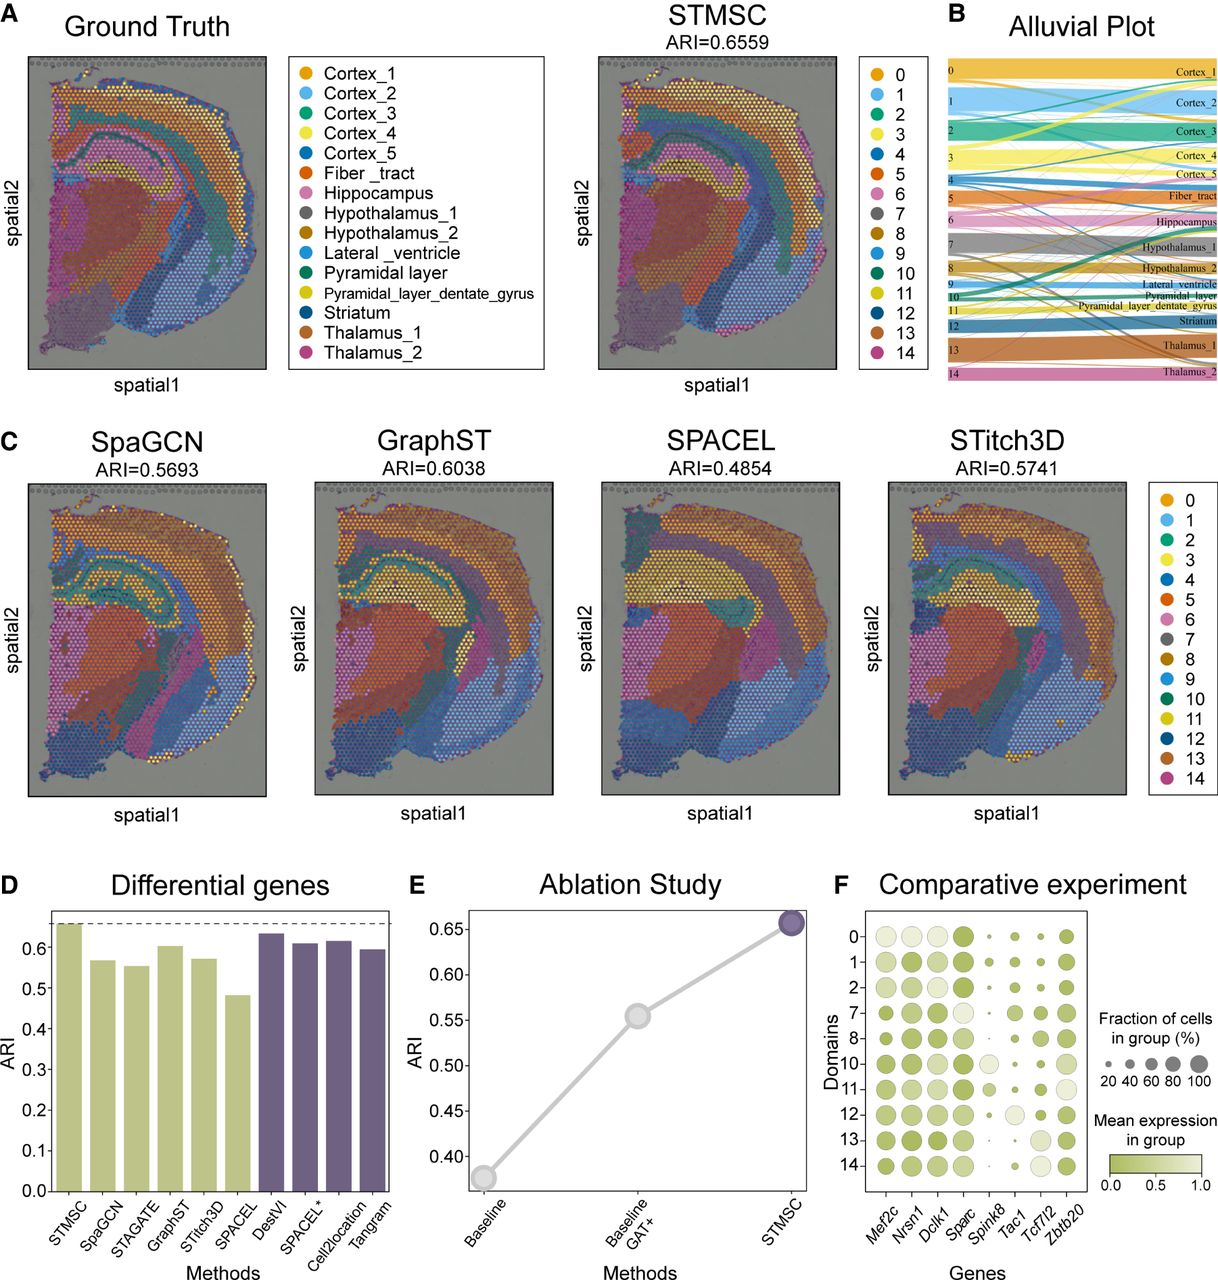
Initially, experimental results (Fig. 3A,C) demonstrated that the spatial regions identified by the STMSC model align closely with manually annotated regions in Squidpy. Notably, within the hippocampus, STMSC precisely differentiated between two distinct structures: the pyramidal layer and the dentate gyrus. In contrast, other models like SpaGCN, GraphST, and SPACEL failed to recognize these subtle structural differences. Although the STitch3D model could roughly delineate these areas, it lacked the precision achieved by STMSC. Further analysis revealed that STMSC's ARI reached 0.66, leading the field and showcasing the model's superiority in spatial region partitioning accuracy (Fig. 3D). Figure 3B illustrates the correspondence between different STMSC spatial regions (e.g., Cortex_1, Cortex_2, Hippocampus, Thalamus_1, etc.) and the manually annotated regions. Each flow represents the mapping from the STMSC-identified region to the manual annotation labels. Different colors represent the regions, and the width of the flow indicates the degree of correspondence. The STMSC method shows good spatial domain identification ability, with high consistency in most regions compared with the manual annotations. The ablation experiment results presented in Figure 3E further demonstrate the effectiveness of the precorrection mechanism.
Subsequently, in exploring the differential expression of spatially variable genes, we confirmed that specific gene expression patterns across different brain areas are closely associated with neurodevelopment and functional disorders (Fig. 3F). For example, mutations in the Mef2c gene in a mouse model of autism affect neurodevelopment and core behavioral phenotypes, primarily evident in cortical development (Zhang and Zhao 2022; Li et al. 2024). Similarly, knockout of the Nrsn1 gene alters cortical morphology, such as thickening of the cortex and loose cell arrangement, which could impact brain functional development (Li et al. 2016; Skeide et al. 2016). Dclk1 gene expression is crucial for neuronal migration and the formation of cortical structures, and its anomalies may be linked to developmental disorders like epilepsy and autism spectrum disorders (Ding et al. 2023). Moreover, although the Sparc gene is primarily associated with obesity and metabolic functions, its role in regulating related hypothalamic functions cannot be overlooked (Chaiyasoot et al. 2023). Expression of the Spink8 gene in mouse hippocampal pyramidal cells reveals its potential role in memory and learning (Zeisel et al. 2015). The Tac1 gene plays a role in regulating emotional responses, particularly in the mechanisms of depression (Quinn et al. 2013). Research on the Tcf7l2 gene further confirms its key role in thalamic neuronal functions, affecting neuronal firing patterns and behavioral choices (Lipiec et al. 2020). Knockout of the Zbtb20 gene impacts learning and memory, highlighting its role in hippocampal-dependent cognitive functions (Nielsen et al. 2014; Nagao et al. 2016). These findings emphasize how high-precision gene expression analysis techniques across different brain regions can deepen our understanding of how genes regulate brain development and disease processes on structural and functional levels.
To assess the impact of the microenvironmental deconstruction module on spatial domain identification accuracy, we conducted comparative experiments by replacing this module with other well-established models, including DestVI (Lopez et al. 2022), SPACEL*(Spoint), Cell2location (Kleshchevnikov et al. 2022), and Tangram (Biancalani et al. 2021). These models are widely recognized and applied in the field of deconvolution, providing robust benchmarks for our evaluation. Using the same data set and experimental conditions, we substituted the microenvironmental deconstruction module in the STMSC framework with each of the aforementioned models. The ARI was employed as the primary evaluation metric, measuring the consistency between clustering results and true labels in the spatial domain identification task. As shown in Figure 3D (purple bar graph on the right), the original microenvironmental deconstruction module in STMSC achieved the highest ARI score, outperforming the alternative models. This demonstrates the superior efficacy and applicability of our module in capturing spatial domain features and enhancing identification accuracy. In addition, we benchmarked performance against other deconvolution methods in terms of estimating cell type proportions using a simulation approach and found that STMSC exhibited comparable performance to existing methods for this specific task, albeit Cell2Location displayed the best performance as measured by a Pearson's correlation between predicted and observed cell type proportions (Cell2Location R = 0.867, STMSC R = 0.5125) (Supplemental Tables 2–6). These results highlight that different methods may be better suited to different analytical goals; for example, if precise cell type deconvolution is the primary objective, purpose-built methods such as Cell2Location may be preferable. Importantly, as detailed in the Methods section “Flexibility of the framework,” STMSC is designed as a modular and adaptable framework that allows users to incorporate the most appropriate deconvolution methods based on the specific characteristics and analytical goals of their data sets.
STMSC provides deeper insights into complex cancer environments through accurate spatial domain identification
Tumor heterogeneity presents substantial challenges in designing effective therapeutic strategies and is associated with poorer patient survival outcomes (Alizadeh et al. 2015; Nguyen et al. 2021). ST, by preserving spatial information crucial for reconstructing spatial distribution domains and distance-dependent interactions, offers unique advantages in anatomically characterizing and delineating intra-tumor heterogeneity. We applied STMSC to human breast cancer data acquired via the 10x Genomics Visium platform. Noted for its marked intra- and intertumoral heterogeneity, the data set was annotated into 20 spatial domains based on pathological features in the SEDR study (Xu et al. 2024), categorized into four morphotypes: ductal carcinoma in situ/lobular carcinoma in situ (DCIS/LCIS), healthy tissue, invasive ductal carcinoma (IDC), and tumor margins (Fig. 4A). First, in the task of spatial domain identification, using SEDR's annotations as a reference, Figure 4A illustrates the visualization of spatial domain recognition, demonstrating accurate and smooth identification for most regions. Figure 4H employs the ARI to quantify STMSC's performance in spatial domain identification, showing superior performance across most regions compared with alternative methodologies. Figure 4B illustrates the correspondence between different STMSC spatial regions and the manually annotated regions.
Human breast cancer data set analysis results. (A) 2D visualization of STMSC spatial domain identification compared with true labels. (B) Alluvial plot showing correspondence between STMSC domains and manual annotations (ground truth). (C) Differential gene expression analysis for spatial domains 9 and 10. (D) Spatial expression visualization of CXCL14 and COX6C in spatial domains 9 and 10. (E) GO enrichment analysis with spatial domains 9 and 10 cross-referenced to each other. (F) GO enrichment analysis for spatial domains 0, 4, and 17. (G) GO enrichment analysis with spatial domains 2 and 6 cross-referenced to each other. (H) Comparison of ARI clustering evaluation metric for STMSC.
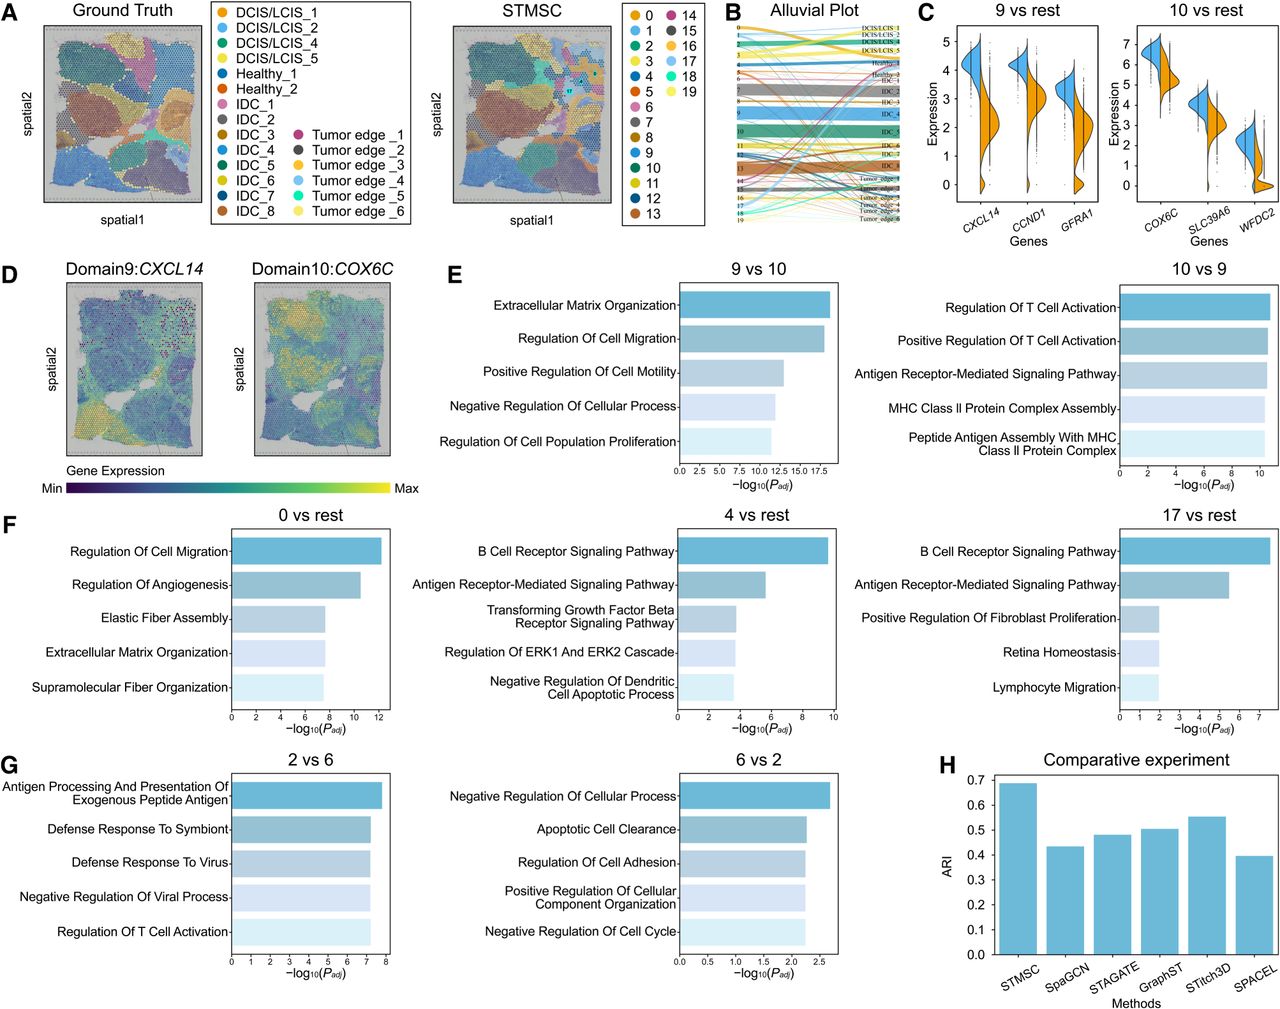
Second, we conducted differential gene expression (DEG) (Fig. 4C) and Gene Ontology (GO) enrichment analysis (Fig. 4E) on the identified spatial domains to validate the SEDR annotations and explore the heterogeneity between two spatial domains within the IDC region. First, we performed a differential gene expression analysis between spatial domains 9 and 10. The results revealed that CXCL14 was overexpressed in domain 9, promoting tumor cell invasion and migration, particularly in breast cancer, in which it enhances tumor growth and metastasis by secreting secondary cytokines. This finding aligns with the invasive characteristics of IDC (Hara and Tanegashima 2012). Elevated expression of CCND1 in domain 9 is recognized as a critical driver of IDC progression, as its overexpression accelerates the cell cycle, contributing to uncontrolled cell proliferation, a hallmark of IDC (Mercapide et al. 2002; Tajiri et al. 2014). In contrast, COX6C was highly expressed in domain 10, potentially facilitating tumor cells’ evasion of apoptosis through mitochondrial regulation, making it a promising biomarker or therapeutic target (Pareja et al. 2020; de Oliveira et al. 2023). The high expression of SLC39A6 in domain 10 has been linked to the progression of estrogen receptor-positive (ER+) IDC, suggesting its role as a potential marker for hormone therapy response (Thakkar et al. 2010). These findings underscore the consistency between the SEDR annotations and the biological characteristics of IDC across domains 9 and 10. We further visualized the spatial distribution of the aforementioned differentially expressed genes, CXCL14 and COX6C, as examples (Fig. 4D). The results revealed clear spatial patterns for both genes.
Furthermore, recognizing the complexity of the tumor microenvironment, even within the IDC region, heterogeneity can still arise. To probe the differences between domains 9 and 10, we performed a GO enrichment analysis using each domain as a reference for the other (Fig. 4E). The results demonstrated that domain 9 was enriched for GO terms related to extracellular matrix (ECM) organization and remodeling, processes essential for tumor cells to breach the basement membrane and invade adjacent tissues. Additional GO terms were associated with cell migration and motility, highlighting the enhanced invasive and metastatic potential of cells in this domain. In contrast, domain 10 was enriched for GO terms related to T cell activation and antigen receptor signaling, suggesting heightened immune activity in this area, potentially fostering a microenvironment conducive to immune cell infiltration and activation, which could impact tumor growth and progression. In summary, although both domains 9 and 10 belong to the IDC region, they exhibit heterogeneity. Domain 9 is characterized by increased cellular migration, invasion, and ECM remodeling, indicative of more aggressive and metastatic behavior, consistent with the invasive nature of IDC. In contrast, domain 10 displays enhanced immune-related activity, particularly in T cell activation and antigen receptor signaling, implying a more active immune response in the tumor microenvironment, potentially inhibiting invasion and metastasis. Therapeutically, domain 9 may benefit from strategies targeting invasion and metastasis, whereas domain 10 might be more responsive to immune-based therapies. Overall, this in-depth analysis of tumor-associated spatial domains not only validates the accuracy of the SEDR annotations but also uncovers the intraregional heterogeneity within IDC, providing novel insights into the complex biology of breast cancer and laying a robust foundation for future precision medicine research.
To further investigate the differences between distinct stages of breast cancer progression, we conducted GO enrichment analysis on spatial domains 2 and 6 (Fig. 4G). Using spatial domain 6 as a reference, GO analysis of spatial domain 2 revealed an enrichment of immune-related processes, particularly those associated with active immune responses and antigen presentation. This heightened immune activity in spatial domain 2 likely reflects the immune system's effort to detect and eliminate early-stage abnormal cells. Such immune engagement is characteristic of early breast cancer stages, such as DCIS and LCIS, in which the immune system plays a crucial role in responding to emerging tumor cells. Conversely, when spatial domain 2 was used as the reference, GO enrichment analysis of spatial domain 6 revealed an overrepresentation of pathways related to cell cycle dysregulation, uncontrolled cellular proliferation, and enhanced cell adhesion and migration. These processes suggest that cancer cells in spatial domain 6 have acquired invasive properties, consistent with the biological characteristics of IDC, in which cancer cells penetrate the basement membrane and invade surrounding tissues. These GO enrichment findings align with the known biological functions of spatial domains 2 and 6, further validating the spatial domain delineations. Moreover, they provide crucial molecular insights into the transition from in situ carcinomas, such as DCIS and LCIS, to invasive forms like IDC. This analysis underscores the potential molecular mechanisms driving breast cancer progression from localized, early-stage lesions to more aggressive, invasive disease.
Finally, it is important to note the complexity of tumor tissues, which, unlike brain cortex with clear and definite morphological boundaries, are highly heterogeneous and contain complex microenvironments. SEDR suggests that manual morphological annotations based solely on tumor pathology are insufficient to characterize this complexity. STMSC's recognition results for the upper right quadrant of pathological slices showed discrepancies; areas originally marked as healthy were identified as three distinct regions (spatial domains 0, 4, and 17). Detailed GO enrichment analysis (Fig. 4F) revealed that domain 0 is primarily involved in tissue remodeling and repair and domain 4 in immune response and signaling, and domain 17 reflects a combination of immune response, cell migration, and tissue repair. Given the relative spatial positions of domains 0, 4, and 17, these areas form what was artificially marked as a healthy region, with domain 17 on the outermost layer, domain 4 in the middle, and domain 0 at the center. We hypothesize that the immune activity in the outermost layer (domain 17) may be a response to cancer cell invasion, a notion further supported by consistent findings across multiple spatial domain identification methods (see Supplemental Section 1; Supplemental Fig. 1). This suggests that breast cancer may be attempting to invade the healthy regions composed of domains 0, 4, and 17, although these areas employ various mechanisms to protect themselves from harm. This insight underscores the efficacy of our data analysis and provides crucial guidance for future biological and clinical research.
Case study: application of STMSC in HER2-positive breast cancer data analysis
In our previous analysis of a single breast cancer slice, we demonstrated that STMSC enables accurate identification of spatial domains, offering deeper insights into the complexity of the tumor microenvironment. To further showcase the potential of STMSC in analyzing 3D tumor biology, we applied it to a HER2-positive breast cancer data set from patient E, which includes three adjacent tissue sections. Compared to single-slice analysis, multislice integration is critical for reconstructing the 3D spatial structure of tissues and obtaining a more comprehensive view of the tumor architecture. This approach enables a more continuous and spatially coherent interpretation of the tumor microenvironment.
By performing cross-slice integration using STMSC (Fig. 5B; Supplemental Fig. 2), we leveraged interslice continuity to enhance the robustness of spatial domain identification and recover biologically meaningful patterns along the depth axis of the tissue. Because only the first slice contains manual annotation (Fig. 5A), we hypothesized based on this slice's annotations that spatial domain 0 is likely immune infiltrate tissue, spatial domains 1 and 2 are likely invasive cancer tissue, and spatial domain 3 likely represents connective tissue. To further validate this hypothesis, we analyzed the enrichment or depletion of different cell types across space domains using the information obtained from STMSC (Fig. 5C) and conducted GO enrichment analysis (Fig. 5D). These analyses confirmed the biological relevance of STMSC-identified domains and provided deeper insights into the tumor microenvironment.
HER2-positive breast cancer data set analysis results. (A) Pathologist's annotation for slice 1 of patient E. (B) Visualization of STMSC's spatial domain detection results. (C) Enrichment or depletion of different cell types in all regions. (D) Notable GO terms for regions.
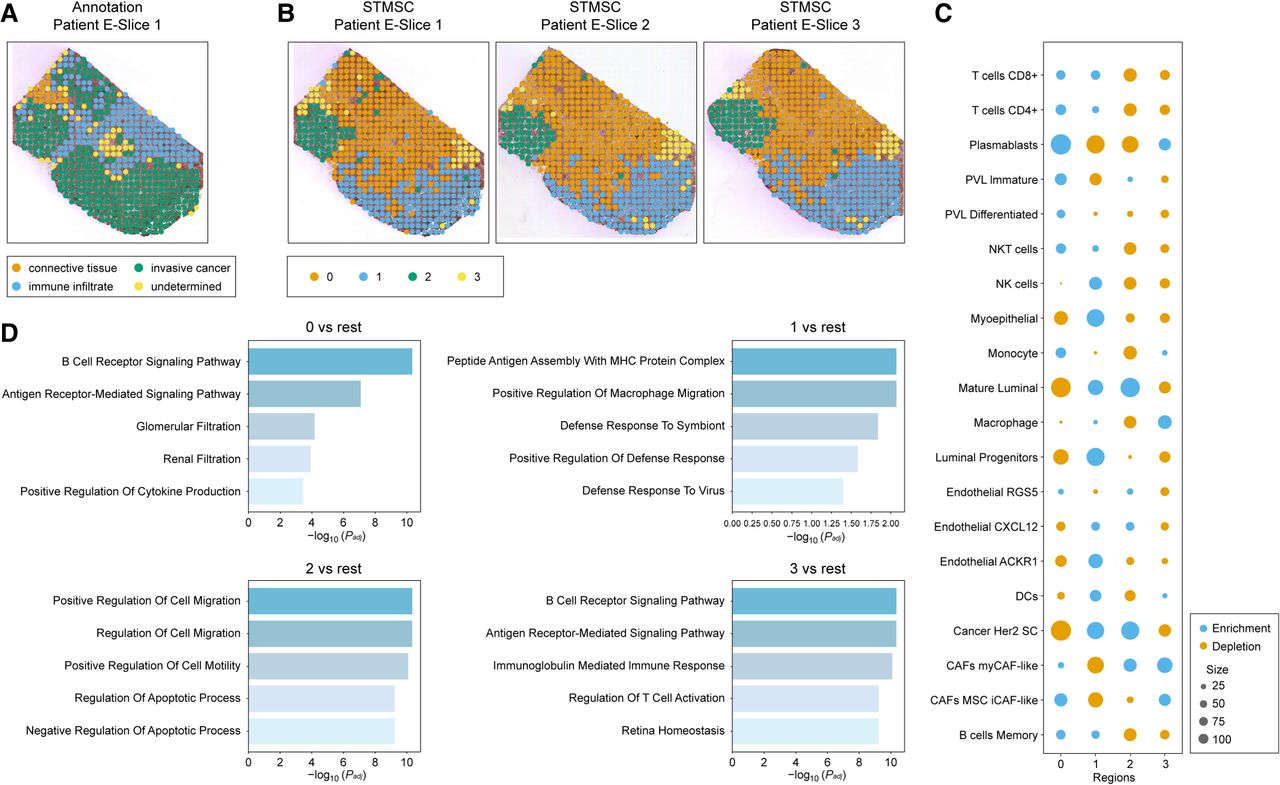
First, through the analysis of enrichment or depletion of different cell types across all regions (Fig. 5D), we found enrichment of immune cells in spatial domain 0, including T cells CD4+ (Speiser et al. 2023), T cells CD8+ (Strioga et al. 2011), and NKT cells (Godfrey et al. 2004). The enrichment of plasmablasts further suggests that this region is a hotspot for immune cell infiltration, indicating a strong immune response (Mao et al. 2017; Wouters and Nelson 2018). In contrast, the depletion of cancer HER2 SC cells indicates that this region does not support tumor growth or expansion, possibly owing to immune-mediated inhibition of tumor cell proliferation (Lu et al. 2023). Thus, spatial domain 0 is identified as an immune-infiltrated region. Space domains 1 and 2, showing enrichment of cancer HER2 SC cells, suggest that these regions are closely associated with tumor growth, invasion, and metastasis, reflecting the characteristics of invasive cancer (Wang et al. 2024). The presence of mature luminal cells in these regions indicates epithelial development, differentiation, and remodeling, processes commonly associated with aggressive tumor progression (Shehata et al. 2012). Additionally, the enrichment of CXCL12-expressing endothelial cells suggests that these regions promote angiogenesis and microenvironmental changes, supporting tumor expansion and dissemination (Portella et al. 2021; Cambier et al. 2023). In contrast, spatial domain 3 shows enrichment of immune cells (e.g., macrophages, monocytes, and dendritic cells) as well as MSC iCAF-like and myCAF-like cancer-associated fibroblasts (CAFs). The coenrichment of immune cells and CAFs suggests a prominent presence of connective tissue cells, particularly fibroblasts (CAFs), which play a key role in tumor microenvironment remodeling and immune evasion. As the predominant cell type in connective tissue, CAFs are involved in tissue repair and reorganization of the tumor microenvironment (Maia et al. 2023; Tsoumakidou 2023). Therefore, spatial domain 3 is likely a connective tissue region that supports tumor progression and metastasis. Taken together, our analysis suggests that spatial domain 0 corresponds to an immune-infiltrated region, spatial domains 1 and 2 are consistent with invasive cancer tissue, and spatial domain 3 represents connective tissue.
To further validate these findings, we conducted GO enrichment analysis across the four spatial domains (Fig. 5D). For space domain 0, enriched pathways such as “B cell receptor signaling pathway” and “antigen receptor-mediated signaling pathway” are closely linked to the immune microenvironment in breast cancer, particularly in HER2-positive cases, in which immune activation plays a critical role in anti-HER2 therapy (Duro-Sánchez et al. 2023). The enrichment of the “B cell receptor signaling pathway” suggests active B cell function and antigen presentation in this region. In spatial domain 1, GO analysis revealed enrichment in “peptide antigen processing and MHC protein complex” pathways, indicating high immune activity in this region (Hewitt 2003). The “positive regulation of macrophage migration” further suggests that this domain is a major site for immune cell infiltration, particularly macrophages, and is associated with immune escape and tumor progression (Huang et al. 2024). GO analysis of spatial domain 2 showed enrichment in pathways related to cell migration and apoptosis regulation, both of which are closely associated with the metastatic potential of HER2-positive breast cancer. The notable enrichment of apoptosis-related processes suggests that this region may contribute to tumor cell survival and resistance to cell death (Wani et al. 2023; He et al. 2024). For space domain 3, GO enrichment analysis again highlighted immune-related pathways such as “B cell receptor signaling pathway” and “antigen receptor-mediated signaling pathway,” emphasizing its involvement in immune response. In HER2-positive breast cancer, immune evasion is a critical factor in tumor progression (Gil Del Alcazar et al. 2020). The enrichment of “immunoglobulin-mediated immune responses” further supports the idea that this region may contribute to immune evasion or responses to immunotherapy (Wang et al. 2020a; Zhang and Kim 2024). Overall, the GO enrichment analysis of the four space domains is consistent with the conclusions drawn from the cell type enrichment/depletion analysis, further validating the functional features of these domains and providing valuable biological insights into the tumor microenvironment.
Overall, this case study demonstrates the potential of STMSC to reconstruct 3D tissue architecture through multislice integration, enabling a comprehensive and biologically meaningful interpretation of complex tumor structures.
Discussion
The advent of ST technologies has revolutionized the understanding of the complex organization and functions of tissues, providing novel insights into cellular architecture within intricate biological systems (Berglund et al. 2020; Piwecka et al. 2023). In this study, STMSC, a novel multislice joint analysis framework with a precorrection mechanism, was introduced to overcome the limitations of traditional methods in identifying 3D spatial domains. This framework advances the field by incorporating H&E image data to aid in reconstructing 3D tissue structures. It leverages the reconstructed cellular landscape to fill gaps in microlevel information. Additionally, it introduces a precorrection mechanism combined with a GAE, which efficiently balances multilevel data and captures multileveled biological heterogeneity. These innovations offer a more precise understanding of tissue heterogeneity and disease pathology.
Experiments demonstrated the superiority of STMSC in 3D spatial domain identification within the human cerebral cortex. The framework produced clear and coherent spatial domain stratifications that align well with the known characteristics of the human cortex, validating the effectiveness of the multislice alignment method, microenvironment deconstruction task, and precorrection mechanism. This capability highlights STMSC's potential to enhance our understanding of complex tissue structures. In the mouse brain coronal data set, STMSC accurately identified and distinguished fine spatial structures, showcasing advantages in spatial region segmentation accuracy and gene expression pattern analysis. High-precision gene expression analysis further revealed the roles of various genes in neural development and dysfunction across different brain regions. This approach effectively uses fine-grained, cell-level information extracted from the reconstructed cellular landscape and insights into the heterogeneity of cell type distribution. These strategies enhance spatial domain delineation and provide deeper insights into neurodevelopment and function. Further exploration of breast cancer data sets highlighted the heterogeneity of cancer tissues, with STMSC achieving superior accuracy in spatial domain identification compared with other methods. The identified gene expression patterns were highly consistent with pathological annotations. Differentially expressed gene and GO enrichment analyses revealed specific functional characteristics of spatial domains. Complex tumor microenvironment analysis further indicated that STMSC provides deeper insights into complex cancer environments. It effectively identifies and refines the boundaries between tumor and healthy tissues, providing crucial guidance for future biological and clinical research. Overall, STMSC shows great promise in studying tissue microstructures and complex diseases. Its ability to align multislice data, compensate for the lack of SC resolution, and integrate information across different levels provides a robust framework for advancing biological and disease research. In clinical pathology, STMSC has the potential to assist in tumor classification and prognosis by analyzing spatial heterogeneity in the microenvironment. In personalized medicine, it may help identify region-specific therapeutic targets, offering insights for spatially informed treatment strategies. These findings highlight its potential impact on ST and related fields.
Although STMSC effectively integrates spatial and molecular information across tissue sections, challenges remain in handling batch effects, particularly when analyzing data from different biological conditions or technological platforms. Currently, STMSC mitigates batch-related variability implicitly through deep learning mechanisms, rather than applying explicit batch correction. Although this approach helps balance multisource data, batch biases may still persist in large-scale or cross-study applications. Future work will focus on developing systematic batch correction strategies and exploring the coordinated relationships between cell type–specific gene expression and spatially driven gene interactions to enhance the framework's biological interpretability and robustness in complex tissue architectures.
Methods
Preprocessing
To ensure reproducibility in data analysis, STMSC implemented routine preprocessing of both ST and SC data sets using the SCANPY package (Wolf et al. 2018). The preprocessing protocol involves several key steps: Initially, mitochondrial-encoded genes are removed, and gene identifiers are standardized. Common genes shared by the ST and SC data sets are retained and normalized to mitigate systemic sample biases. Subsequently, STMSC selects the top 500 highly variable genes (HVGs) from the SC data set, which exhibit expression variability and provide crucial biological insights. Based on these HVGs, the average expression values for each cell type are calculated, forming the final data set, Xsc. In this data set, rows represent specific cell types, columns represent genes, and denotes the average expression level of a gene j within a particular cell type i.
In extracting information from H&E images, STMSC employed a pixel coordinate-based mapping strategy to align specific spots with H&E images, in which the average RGB value (rm, gm, bm) of the pixels in the 50 × 50 windows around the coordinate point is used to determine specific pixel coordinates.
Slice registration
Traditional spatial coordinate-based alignment algorithms, which typically rely on defining edge spots for slice alignment, often prove inadequate when dealing with samples characterized by irregular tissue margins or complex internal structures (Wang et al. 2023). Additionally, the reliance on point-to-point matching algorithms based solely on coordinate data renders these methods particularly vulnerable to interference from outliers, errors that frequently stem from the inherent limitations of sequencing technologies. Such inaccuracies can compromise alignment precision. To overcome these challenges, the STMSC model introduces a multislice alignment module that integrates spatial coordinates (xpc, ypc) with histological features (rm, gm, bm) from H&E images. This approach initially utilizes spatial coordinate data from multiple slices as input and applies the iterative closest point (ICP) (Arun et al. 1987) algorithm for initial alignment. The method then enhances this alignment by incorporating histological image features, treating them as a third dimension alongside the coordinate data (Hu et al. 2021), and refines the alignment using the ICP algorithm again. In contrast to atlas-based alignment frameworks, such as the Allen Common Coordinate Framework (CCFv3) (Wang et al. 2020b), a high-resolution 3D brain atlas commonly used for standardized registration in brain studies, STMSC adopts a template-free alignment strategy. This design choice reflects the practical need to accommodate human and cancer tissue samples, which are incompatible with CCFv3 owing to species- and organ-specific differences. By leveraging intrinsic spatial and histological features, STMSC offers a generalizable framework applicable across a wide range of tissue types, especially in contexts in which standardized anatomical references are unavailable.
To incorporate the RGB image information from H&E staining as 3D information, we convert the 3D RGB data into a single-dimensional value through a weighted sum. The conversion formula is as follows:
The multislice alignment step takes into account more complex biological characteristics and histological differences, thereby identifying and correcting regions that cannot be accurately aligned based solely on coordinate information. This ensures that matched points are not only spatially proximate but also histologically similar. The final alignment result is
Microenvironment deconstruction
By integrating SC data, STMSC effectively deconstructs the spot-level microenvironments, transforming coarse-grained information into a fine-grained representation at the cellular level. This enhanced granularity is achieved through a nonaugmented contrastive learning model that accurately deconvolutes the distribution of cell types within each spot. As a result, STMSC effectively reconstructs the cellular landscape, providing a more detailed and accurate view of the tissue microenvironment. Specifically, STMSC constructed a mapping matrix M of dimensions Ncelltype × Nspot to map the probability of cell type within a spot. Each element mij in this matrix signifies the probability of mapping the ith cell type to spot j. The mapping matrix M is learned through the equation
The contrastive loss component emphasizes maximizing the similarity of positive relations between spatially adjacent spots while minimizing the similarity of negative relations between nonadjacent spots. The reconstruction loss component ensures alignment between predicted and reconstructed gene expression profiles. Regulatory factors α and β (set to α, β ∈ [0, 1], α + β = 1) are introduced to finely balance the weights of contrastive and reconstruction losses, optimizing overall model performance.
Construction and correction of 3D neighborhood graphs
The STMSC model leverages the aligned spatial positional information by employing Euclidean distance to compute the distances between points, thereby generating a distance matrix D. The values within D represent the strength of relationships between two spots. A suitable threshold s is set for different data sets, such that if dij < s, the spots i and j are considered physically close.
The microenvironment deconstruction module in STMSC constructs the cellular landscape, which then serves as input for the precorrection mechanism. These fine-grained data are crucial for correcting graph structures, leading to a more detailed understanding of the relationships between spots. Enhanced granularity improves the identification of spatial domains, ultimately advancing our comprehension of tissue architecture and function. To achieve this, the model incorporates fine-grained information M obtained from microenvironment deconstruction for correction. This allows for the consideration of cellular composition and heterogeneous states within microenvironments. For example, if physically proximate spots exhibit differences in cellular states or composition, the connections in D may be downweighed or redefined to accurately reflect actual biological differences.
Based on the corrected distance matrix D*, an initial 3D neighborhood graph is constructed, in which nodes represent individual spots and edge weights are determined by the threshold s. If , it indicates that spot i and spot j are neighbors in 3D space, and hence, aij = 1; otherwise, aij = 0.
Network structures
Within the STMSC framework, an autoencoder is engineered to learn complex biological information derived from 3D biological landscapes. The encoding network within the autoencoder is designated as Fen(Xst, A). To enhance the model's capabilities, we incorporate a graph attention network (Veličković et al. 2018) that consists of graph attention layers and dense layers. The attention mechanism enables dynamic weighting of the influence of one spot on another, based on the spatial and molecular context of each spot. This integration enhances the model's capacity to interpret and capture complex spatial relationships among spots. Compared to CGNs, GAT enables adaptive weighting of neighboring nodes, which is better suited for the heterogeneous spatial context of transcriptomic data. In addition, it offers improved scalability and generalization over transformer-based models, especially on small or noisy data sets. The input to the encoding network Fen includes a 3D global adjacency matrix, A, and preprocessed ST gene expressions, Xst. The output dimension of the graph attention layer is set at 512. Subsequently, the dense layer in Fen receives these 512-dimensional hidden vectors and outputs 128-dimensional latent representations, Z. Similarly, the decoder Fde(Z) of the autoencoder in the STMSC framework utilizes a construction analogous to the encoder, featuring a single-layer dense network and a graph attention network with a hidden dimensionality of 512. This network takes the latent representations, Z, as input and ultimately reconstructs the gene expression matrix through a dense layer.
The loss function of this GAE is denoted as
Clusters
The output Z from the hidden layer of the GAE serves as input for clustering algorithms tailored to delineate biologically meaningful spatial domains. The choice of clustering strategy depends on the availability of prior information regarding the number of spatial domains. Specifically, for data sets with known domain counts, a Gaussian mixture model (GMM) (McNicholas and Murphy 2010) is employed for clustering. Conversely, in the absence of such information, the Louvain algorithm (Blondel et al. 2008) is utilized. The accuracy of clustering outcomes is assessed using the ARI (Hubert and Arabie 1985):
Hyperparameter settings
To ensure a fair and rigorous comparison, the hyperparameter settings for each benchmarked method were carefully selected based on the guidelines and strategies provided in the official tutorials and code repositories by the respective method authors. By adhering closely to these recommended settings, we aimed to minimize bias and maximize the validity of our experimental results, thereby ensuring that each method was evaluated under optimal and comparable conditions:
Flexibility of the framework
STMSC is designed as a flexible framework that can be adapted to different data characteristics and analysis needs. Rather than being constrained to a specific deconvolution module, STMSC allows users to integrate suitable deconvolution methods based on the properties of their data sets. This adaptability ensures that the framework remains applicable across diverse ST studies, accommodating variations in tissue complexity, and technological platforms. By enabling modular customization, STMSC encourages further exploration and refinement, making it a versatile tool for spatial domain identification and downstream biological analysis.
Data sets
The ST and scRNA-seq data sets used in this study are publicly accessible. The DLPFC data set can be obtained from http://research.libd.org/spatialLIBD/ (Maynard et al. 2021). The mouse coronal brain data set from the 10x Visium platform is available at https://squidpy.readthedocs.io/en/latest/notebooks/tutorials/tutorial_visium_hne.html (Palla et al. 2022), whereas the human breast cancer data set from the 10x Visium platform can be accessed at https://support.10xgenomics.com/spatial-gene-expression/datasets/1.1.0. For the scRNA-seq data, the human DLPFC data set, analyzed using the 10x Genomics Chromium platform, is available from the NCBI Gene Expression Omnibus (GEO; https://www.ncbi.nlm.nih.gov/geo/) under accession number GSE144136 (Nagy et al. 2020). The mouse brain data set, also analyzed using the 10x Genomics Chromium platform, can be found in the ArrayExpress database (https://www.ebi.ac.uk/biostudies/arrayexpress) under accession number E-MTAB-11115 (Kleshchevnikov et al. 2022). Additionally, the SC transcriptomic data for human breast cancer is accessible at https://singlecell.broadinstitute.org/single_cell/study/SCP1039 (Wu et al. 2021). The HER2-positive breast tumor data set (Andersson et al. 2021) was profiled by ST platform (https://doi.org/10.5281/zenodo.4751624); the HER2-positive breast tumor data set (Wu et al. 2021) was profiled by 10x Genomics Chromium platform37 (GEO; GSE176078).
Software availability
The STMSC framework is available as an open-source project on GitHub (https://github.com/bliulab/STMSC) and as Supplemental Code. It is also freely accessible via the project website (http://bliulab.net/STMSC).
Competing interest statement
The authors declare no competing interests.
Acknowledgments
This work was supported by the National Natural Science Foundation of China (62325202 and U22A2039) and Zhongguancun Academy (20240101).
Author contributions: D.Z. and B.L. conceived the idea. D.Z. developed the method. B.L. and R.Q. supervised the project. D.Z. designed the experiments, performed the analyses and wrote the paper. B.L., R.Q., and X.L. provided critical feedback during the study and helped revise the manuscript.
Notes
[1] Supplementary material [Supplemental material is available for this article.]
[2] Article published online before print. Article, supplemental material, and publication date are at https://www.genome.org/cgi/doi/10.1101/gr.280281.124.
References
- ↵Akam T, Oren I, Mantoan L, Ferenczi E, Kullmann DM. 2012. Oscillatory dynamics in the hippocampus support dentate gyrus–CA3 coupling. Nat Neurosci 15: 763–768. 10.1038/nn.3081
- ↵Alizadeh AA, Aranda V, Bardelli A, Blanpain C, Bock C, Borowski C, Caldas C, Califano A, Doherty M, Elsner M, 2015. Toward understanding and exploiting tumor heterogeneity. Nat Med 21: 846–853. 10.1038/nm.3915
- ↵Andersson A, Larsson L, Stenbeck L, Salmén F, Ehinger A, Wu SZ, Al-Eryani G, Roden D, Swarbrick A, Borg Å, 2021. Spatial deconvolution of HER2-positive breast cancer delineates tumor-associated cell type interactions. Nat Commun 12: 6012. 10.1038/s41467-021-26271-2
- ↵Arun KS, Huang TS, Blostein SD. 1987. Least-squares fitting of two 3-D point sets. IEEE Trans Pattern Anal Mach Intell PAMI-9: 698–700. 10.1109/TPAMI.1987.4767965
- ↵Ash JT, Darnell G, Munro D, Engelhardt BE. 2021. Joint analysis of expression levels and histological images identifies genes associated with tissue morphology. Nat Commun 12: 1609. 10.1038/s41467-021-21727-x
- ↵Badea L, Stănescu E. 2020. Identifying transcriptomic correlates of histology using deep learning. PLoS One 15: e0242858. 10.1371/journal.pone.0242858
- ↵Benjamin K, Bhandari A, Kepple JD, Qi R, Shang Z, Xing Y, An Y, Zhang N, Hou Y, Crockford TL, 2024. Multiscale topology classifies cells in subcellular spatial transcriptomics. Nature 630: 943–949. 10.1038/s41586-024-07563-1
- ↵Berglund E, Saarenpää S, Jemt A, Gruselius J, Larsson L, Bergenstråhle L, Lundeberg J, Giacomello S. 2020. Automation of spatial transcriptomics library preparation to enable rapid and robust insights into spatial organization of tissues. BMC Genomics 21: 298. 10.1186/s12864-020-6631-z
- ↵Bergmann S, Penfold CA, Slatery E, Siriwardena D, Drummer C, Clark S, Strawbridge SE, Kishimoto K, Vickers A, Tewary M, 2022. Spatial profiling of early primate gastrulation in utero. Nature 609: 136–143. 10.1038/s41586-022-04953-1
- ↵Biancalani T, Scalia G, Buffoni L, Avasthi R, Lu Z, Sanger A, Tokcan N, Vanderburg CR, Segerstolpe Å, Zhang M, 2021. Deep learning and alignment of spatially resolved single-cell transcriptomes with Tangram. Nat Methods 18: 1352–1362. 10.1038/s41592-021-01264-7
- ↵Blondel VD, Guillaume J-L, Lambiotte R, Lefebvre E. 2008. Fast unfolding of communities in large networks. J Stat Mech Theory Exp 2008: P10008. 10.1088/1742-5468/2008/10/P10008
- ↵Cambier S, Gouwy M, Proost P. 2023. The chemokines CXCL8 and CXCL12: molecular and functional properties, role in disease and efforts towards pharmacological intervention. Cell Mol Immunol 20: 217–251. 10.1038/s41423-023-00974-6
- ↵Chaiyasoot K, Khumkhana N, Deekum W, Chaichana C, Taweerutchana V, Srisuworanan N, Pramyothin P. 2023. Alteration of BDNF, SPARC, FGF-21, and GDF-15 circulating levels after 1 year of anti-obesity treatments and their association with 1-year weight loss. Endocrine 82: 57–68. 10.1007/s12020-023-03435-2
- ↵Chen A, Liao S, Cheng M, Ma K, Wu L, Lai Y, Qiu X, Yang J, Xu J, Hao S, 2022. Spatiotemporal transcriptomic atlas of mouse organogenesis using DNA nanoball-patterned arrays. Cell 185: 1777–1792.e21. 10.1016/j.cell.2022.04.003
- ↵Cho C-S, Xi J, Si Y, Park S-R, Hsu J-E, Kim M, Jun G, Kang HM, Lee JH. 2021. Microscopic examination of spatial transcriptome using Seq-Scope. Cell 184: 3559–3572.e22. 10.1016/j.cell.2021.05.010
- ↵Codeluppi S, Borm LE, Zeisel A, La Manno G, van Lunteren JA, Svensson CI, Linnarsson S. 2018. Spatial organization of the somatosensory cortex revealed by osmFISH. Nat Methods 15: 932–935. 10.1038/s41592-018-0175-z
- ↵de Oliveira RC, dos Reis SP, Cavalcante GC. 2023. Mutations in structural genes of the mitochondrial complex IV May influence breast cancer. Genes (Basel) 14: 1465. 10.3390/genes14071465
- ↵Ding L, Weygant N, Ding C, Lai Y, Li H. 2023. DCLK1 and tuft cells: immune-related functions and implications for cancer immunotherapy. Crit Rev Oncol Hematol 191: 104118. 10.1016/j.critrevonc.2023.104118
- ↵Dong K, Zhang S. 2022. Deciphering spatial domains from spatially resolved transcriptomics with an adaptive graph attention auto-encoder. Nat Commun 13: 1739. 10.1038/s41467-022-29439-6
- ↵Duro-Sánchez S, Alonso MR, Arribas J. 2023. Immunotherapies against HER2-positive breast cancer. Cancers (Basel) 15: 1069. 10.3390/cancers15041069
- ↵Erickson A, He M, Berglund E, Marklund M, Mirzazadeh R, Schultz N, Kvastad L, Andersson A, Bergenstråhle L, Bergenstråhle J, 2022. Spatially resolved clonal copy number alterations in benign and malignant tissue. Nature 608: 360–367. 10.1038/s41586-022-05023-2
- ↵Fu X, Sun L, Dong R, Chen JY, Silakit R, Condon LF, Lin Y, Lin S, Palmiter RD, Gu L. 2022. Polony gels enable amplifiable DNA stamping and spatial transcriptomics of chronic pain. Cell 185: 4621–4633.e17. 10.1016/j.cell.2022.10.021
- ↵Gil Del Alcazar CR, Alečković M, Polyak K. 2020. Immune escape during breast tumor progression. Cancer Immunol Res 8: 422–427. 10.1158/2326-6066.CIR-19-0786
- ↵Gilmore EC, Herrup K. 1997. Cortical development: layers of complexity. Curr Biol 7: R231–R234. 10.1016/S0960-9822(06)00108-4
- ↵Godfrey DI, MacDonald HR, Kronenberg M, Smyth MJ, Kaer LV. 2004. NKT cells: What's in a name? Nat Rev Immunol 4: 231–237. 10.1038/nri1309
- ↵Haghverdi L, Büttner M, Wolf FA, Buettner F, Theis FJ. 2016. Diffusion pseudotime robustly reconstructs lineage branching. Nat Methods 13: 845–848. 10.1038/nmeth.3971
- ↵Hara T, Tanegashima K. 2012. Pleiotropic functions of the CXC-type chemokine CXCL14 in mammals. J Biochem 151: 469–476. 10.1093/jb/mvs030
- ↵He S, Bhatt R, Brown C, Brown EA, Buhr DL, Chantranuvatana K, Danaher P, Dunaway D, Garrison RG, Geiss G, 2022. High-plex imaging of RNA and proteins at subcellular resolution in fixed tissue by spatial molecular imaging. Nat Biotechnol 40: 1794–1806. 10.1038/s41587-022-01483-z
- ↵He R, Liu Y, Fu W, He X, Liu S, Xiao D, Tao Y. 2024. Mechanisms and cross-talk of regulated cell death and their epigenetic modifications in tumor progression. Mol Cancer 23: 267. 10.1186/s12943-024-02172-y
- ↵Hewitt EW. 2003. The MHC class I antigen presentation pathway: strategies for viral immune evasion. Immunology 110: 163–169. 10.1046/j.1365-2567.2003.01738.x
- ↵Hu J, Li X, Coleman K, Schroeder A, Ma N, Irwin DJ, Lee EB, Shinohara RT, Li M. 2021. SpaGCN: integrating gene expression, spatial location and histology to identify spatial domains and spatially variable genes by graph convolutional network. Nat Methods 18: 1342–1351. 10.1038/s41592-021-01255-8
- ↵Huang R, Kang T, Chen S. 2024. The role of tumor-associated macrophages in tumor immune evasion. J Cancer Res Clin Oncol 150: 238. 10.1007/s00432-024-05777-4
- ↵Hubert L, Arabie P. 1985. Comparing partitions. J Classif 2: 193–218. 10.1007/BF01908075
- ↵Kalita-de Croft P, Sadeghi Rad H, Gasper H, O'Byrne K, Lakhani SR, Kulasinghe A. 2021. Spatial profiling technologies and applications for brain cancers. Expert Rev Mol Diagn 21: 323–332. 10.1080/14737159.2021.1900735
- ↵Kleshchevnikov V, Shmatko A, Dann E, Aivazidis A, King HW, Li T, Elmentaite R, Lomakin A, Kedlian V, Gayoso A, 2022. Cell2location maps fine-grained cell types in spatial transcriptomics. Nat Biotechnol 40: 661–671. 10.1038/s41587-021-01139-4
- ↵Kuppe C, Ramirez Flores RO, Li Z, Hayat S, Levinson RT, Liao X, Hannani MT, Tanevski J, Wünnemann F, Nagai JS, 2022. Spatial multi-omic map of human myocardial infarction. Nature 608: 766–777. 10.1038/s41586-022-05060-x
- ↵Lewis SM, Asselin-Labat M-L, Nguyen Q, Berthelet J, Tan X, Wimmer VC, Merino D, Rogers KL, Naik SH. 2021. Spatial omics and multiplexed imaging to explore cancer biology. Nat Methods 18: 997–1012. 10.1038/s41592-021-01203-6
- ↵Li Y-X, Ji C-X, Hu J-X, Lu D-X, Chen X-H. 2016. Expression of pituitary tumor transforming gene-1 proto-oncogene is upregulated in the brain of neuronal-specific neural salient serine/arginine rich protein-1 gene knockout mice. J Biomater Tissue Eng 6: 943–951. 10.1166/jbt.2016.1524
- ↵Li W-K, Zhang S-Q, Peng W-L, Shi Y-H, Yuan B, Yuan Y-T, Xue Z-Y, Wang J-C, Han W-J, Chen Z-F, 2024. Whole-brain in vivo base editing reverses behavioral changes in Mef2c-mutant mice. Nat Neurosci 27: 116–128. 10.1038/s41593-023-01499-x
- ↵Lipiec MA, Bem J, Koziński K, Chakraborty C, Urban-Ciećko J, Zajkowski T, Dąbrowski M, Szewczyk ŁM, Toval A, Ferran JL, 2020. TCF7L2 regulates postmitotic differentiation programmes and excitability patterns in the thalamus. Development 147: dev190181. 10.1242/dev.190181
- ↵Long Y, Ang KS, Li M, Chong KLK, Sethi R, Zhong C, Xu H, Ong Z, Sachaphibulkij K, Chen A, 2023. Spatially informed clustering, integration, and deconvolution of spatial transcriptomics with GraphST. Nat Commun 14: 1155. 10.1038/s41467-023-36796-3
- ↵Lopez R, Li B, Keren-Shaul H, Boyeau P, Kedmi M, Pilzer D, Jelinski A, Yofe I, David E, Wagner A, 2022. DestVI identifies continuums of cell types in spatial transcriptomics data. Nat Biotechnol 40: 1360–1369. 10.1038/s41587-022-01272-8
- ↵Lu C, Liu Y, Ali NM, Zhang B, Cui X. 2023. The role of innate immune cells in the tumor microenvironment and research progress in anti-tumor therapy. Front Immunol 13: 1039260. 10.3389/fimmu.2022.1039260
- ↵Maia A, Schöllhorn A, Schuhmacher J, Gouttefangeas C. 2023. CAF-immune cell crosstalk and its impact in immunotherapy. Semin Immunopathol 45: 203–214. 10.1007/s00281-022-00977-x
- ↵Mao H, Pan F, Wu Z, Wang Z, Zhou Y, Zhang P, Gou M, Dai G. 2017. Colorectal tumors are enriched with regulatory plasmablasts with capacity in suppressing T cell inflammation. Int Immunopharmacol 49: 95–101. 10.1016/j.intimp.2017.05.018
- ↵Maynard KR, Collado-Torres L, Weber LM, Uytingco C, Barry BK, Williams SR, Catallini JL, Tran MN, Besich Z, Tippani M, 2021. Transcriptome-scale spatial gene expression in the human dorsolateral prefrontal cortex. Nat Neurosci 24: 425–436. 10.1038/s41593-020-00787-0
- ↵McNicholas PD, Murphy TB. 2010. Model-based clustering of microarray expression data via latent Gaussian mixture models. Bioinformatics 26: 2705–2712. 10.1093/bioinformatics/btq498
- ↵Mercapide J, Zhang SY, Fan X, Furió-Bacete V, Schneider J, López de la Osa I, Patchefsky AS, Klein-Szanto AJ, Castresana JS. 2002. CCND1- and ERBB2-gene deregulation and PTEN mutation analyses in invasive lobular carcinoma of the breast. Mol Carcinog 35: 6–12. 10.1002/mc.10069
- ↵Nagao M, Ogata T, Sawada Y, Gotoh Y. 2016. Zbtb20 promotes astrocytogenesis during neocortical development. Nat Commun 7: 11102. 10.1038/ncomms11102
- ↵Nagendran M, Sapida J, Arthur J, Yin Y, Tuncer SD, Anaparthy N, Gupta A, Serra M, Patterson D, Tentori A. 2023. 1457Visium HD enables spatially resolved, single-cell scale resolution mapping of FFPE human breast cancer tissue. J Immunother Cancer 11: A1620–A1620. 10.1136/jitc-2023-SITC2023.1457
- ↵Nagy C, Maitra M, Tanti A, Suderman M, Théroux J-F, Davoli MA, Perlman K, Yerko V, Wang YC, Tripathy SJ, 2020. Single-nucleus transcriptomics of the prefrontal cortex in major depressive disorder implicates oligodendrocyte precursor cells and excitatory neurons. Nat Neurosci 23: 771–781. 10.1038/s41593-020-0621-y
- ↵Nguyen PHD, Ma S, Phua CZJ, Kaya NA, Lai HLH, Lim CJ, Lim JQ, Wasser M, Lai L, Tam WL, 2021. Intratumoural immune heterogeneity as a hallmark of tumour evolution and progression in hepatocellular carcinoma. Nat Commun 12: 227. 10.1038/s41467-020-20171-7
- ↵Nielsen JV, Thomassen M, Møllgård K, Noraberg J, Jensen NA. 2014. Zbtb20 defines a hippocampal neuronal identity through direct repression of genes that control projection neuron development in the isocortex. Cerebral Cortex 24: 1216–1229. 10.1093/cercor/bhs400
- ↵Palla G, Spitzer H, Klein M, Fischer D, Schaar AC, Kuemmerle LB, Rybakov S, Ibarra IL, Holmberg O, Virshup I, 2022. Squidpy: a scalable framework for spatial omics analysis. Nat Methods 19: 171–178. 10.1038/s41592-021-01358-2
- ↵Pareja F, Brown DN, Lee JY, Da Cruz Paula A, Selenica P, Bi R, Geyer FC, Gazzo A, da Silva EM, Vahdatinia M, 2020. Whole-exome sequencing analysis of the progression from non–low-grade ductal carcinoma in situ to invasive ductal carcinoma. Clin Cancer Res 26: 3682–3693. 10.1158/1078-0432.CCR-19-2563
- ↵Pelka K, Hofree M, Chen JH, Sarkizova S, Pirl JD, Jorgji V, Bejnood A, Dionne D, Ge WH, Xu KH, 2021. Spatially organized multicellular immune hubs in human colorectal cancer. Cell 184: 4734–4752.e20. 10.1016/j.cell.2021.08.003
- ↵Pham D, Tan X, Balderson B, Xu J, Grice LF, Yoon S, Willis EF, Tran M, Lam PY, Raghubar A, 2023. Robust mapping of spatiotemporal trajectories and cell–cell interactions in healthy and diseased tissues. Nat Commun 14: 7739. 10.1038/s41467-023-43120-6
- ↵Piwecka M, Rajewsky N, Rybak-Wolf A. 2023. Single-cell and spatial transcriptomics: deciphering brain complexity in health and disease. Nat Rev Neurol 19: 346–362. 10.1038/s41582-023-00809-y
- ↵Portella L, Bello AM, Scala S. 2021. CXCL12 signaling in the tumor microenvironment. In Tumor microenvironment: the role of chemokines, part B (ed. Birbrair A), pp. 51–70. Springer International Publishing, Cham, Switzerland. 10.1007/978-3-030-62658-7_5
- ↵Quinn JP, Warburton A, Myers P, Savage AL, Bubb VJ. 2013. Polymorphic variation as a driver of differential neuropeptide gene expression. Neuropeptides 47: 395–400. 10.1016/j.npep.2013.10.003
- ↵Rao A, Barkley D, França GS, Yanai I. 2021. Exploring tissue architecture using spatial transcriptomics. Nature 596: 211–220. 10.1038/s41586-021-03634-9
- ↵Rodriques SG, Stickels RR, Goeva A, Martin CA, Murray E, Vanderburg CR, Welch J, Chen LM, Chen F, Macosko EZ. 2019. Slide-seq: a scalable technology for measuring genome-wide expression at high spatial resolution. Science 363: 1463–1467. 10.1126/science.aaw1219
- ↵Schmauch B, Romagnoni A, Pronier E, Saillard C, Maillé P, Calderaro J, Kamoun A, Sefta M, Toldo S, Zaslavskiy M, 2020. A deep learning model to predict RNA-Seq expression of tumours from whole slide images. Nat Commun 11: 3877. 10.1038/s41467-020-17678-4
- ↵Shah S, Lubeck E, Zhou W, Cai L. 2016. In situ transcription profiling of single cells reveals spatial organization of cells in the mouse hippocampus. Neuron 92: 342–357. 10.1016/j.neuron.2016.10.001
- ↵Shehata M, Teschendorff A, Sharp G, Novcic N, Russell IA, Avril S, Prater M, Eirew P, Caldas C, Watson CJ, 2012. Phenotypic and functional characterisation of the luminal cell hierarchy of the mammary gland. Breast Cancer Res 14: R134. 10.1186/bcr3334
- ↵Skeide MA, Kraft I, Müller B, Schaadt G, Neef NE, Brauer J, Wilcke A, Kirsten H, Boltze J, Friederici AD. 2016. NRSN1 associated grey matter volume of the visual word form area reveals dyslexia before school. Brain 139: 2792–2803. 10.1093/brain/aww153
- ↵Speiser DE, Chijioke O, Schaeuble K, Münz C. 2023. CD4+ T cells in cancer. Nat Cancer 4: 317–329. 10.1038/s43018-023-00521-2
- ↵Srivatsan SR, Regier MC, Barkan E, Franks JM, Packer JS, Grosjean P, Duran M, Saxton S, Ladd JJ, Spielmann M, 2021. Embryo-scale, single-cell spatial transcriptomics. Science 373: 111–117. 10.1126/science.abb9536
- ↵Stickels RR, Murray E, Kumar P, Li J, Marshall JL, Di Bella DJ, Arlotta P, Macosko EZ, Chen F. 2021. Highly sensitive spatial transcriptomics at near-cellular resolution with Slide-seqV2. Nat Biotechnol 39: 313–319. 10.1038/s41587-020-0739-1
- ↵Strioga M, Pasukoniene V, Characiejus D. 2011. CD8+ CD28− and CD8+ CD57+ T cells and their role in health and disease. Immunology 134: 17–32. 10.1111/j.1365-2567.2011.03470.x
- ↵Tajiri R, Inokuchi M, Sawada-Kitamura S, Kawashima H, Nakamura R, Oyama T, Dobashi Y, Ooi A. 2014. Clonal profiling of mixed lobular and ductal carcinoma revealed by multiplex ligation-dependent probe amplification and fluorescence in situ hybridization. Pathol Int 64: 231–236. 10.1111/pin.12158
- ↵Thakkar AD, Raj H, Chakrabarti D, Ravishankar, Saravanan N, Muthuvelan B, Balakrishnan A, Padigaru M. 2010. Identification of gene expression signature in estrogen receptor positive breast carcinoma. Biomark Cancer 2: BIC.S3793. 10.4137/BIC.S3793
- ↵Tsoumakidou M. 2023. The advent of immune stimulating CAFs in cancer. Nat Rev Cancer 23: 258–269. 10.1038/s41568-023-00549-7
- ↵Uttam S, Stern AM, Sevinsky CJ, Furman S, Pullara F, Spagnolo D, Nguyen L, Gough A, Ginty F, Lansing Taylor D, 2020. Spatial domain analysis predicts risk of colorectal cancer recurrence and infers associated tumor microenvironment networks. Nat Commun 11: 3515. 10.1038/s41467-020-17083-x
- ↵Veličković P, Cucurull G, Casanova A, Romero A, Liò P, Bengio Y. 2018. Graph attention networks. In ICLR 2018: The Sixth International Conference on Learning Representations, Vancouver, Canada.
- ↵Wang H, Xu Q, Zhao C, Zhu Z, Zhu X, Zhou J, Zhang S, Yang T, Zhang B, Li J, 2020a. An immune evasion mechanism with IgG4 playing an essential role in cancer and implication for immunotherapy. J Immunother Cancer 8: e000661. 10.1136/jitc-2020-000661
- ↵Wang Q, Ding S-L, Li Y, Royall J, Feng D, Lesnar P, Graddis N, Naeemi M, Facer B, Ho A, 2020b. The Allen mouse brain common coordinate framework: a 3D reference atlas. Cell 181: 936–953.e20. 10.1016/j.cell.2020.04.007
- ↵Wang G, Zhao J, Yan Y, Wang Y, Wu AR, Yang C. 2023. Construction of a 3D whole organism spatial atlas by joint modelling of multiple slices with deep neural networks. Nat Mach Intell 5: 1200–1213. 10.1038/s42256-023-00734-1
- ↵Wang G, Wen P, Xue T, Huang Y, Shao Q, Zhang N, Qu F, Wang J, Wang N, Zeng X. 2024. Her2 promotes early dissemination of breast cancer by inhibiting the p38 pathway through the downregulation of MAP3K4. Cell Commun Signal 22: 611. 10.1186/s12964-024-02000-2
- ↵Wani AK, Akhtar N, Mir TUG, Singh R, Jha PK, Mallik SK, Sinha S, Tripathi SK, Jain A, Jha A, 2023. Targeting apoptotic pathway of cancer cells with phytochemicals and plant-based nanomaterials. Biomolecules 13: 194. 10.3390/biom13020194
- ↵Wolf FA, Angerer P, Theis FJ. 2018. SCANPY: large-scale single-cell gene expression data analysis. Genome Biol 19: 15. 10.1186/s13059-017-1382-0
- ↵Wolf FA, Hamey FK, Plass M, Solana J, Dahlin JS, Göttgens B, Rajewsky N, Simon L, Theis FJ. 2019. PAGA: graph abstraction reconciles clustering with trajectory inference through a topology preserving map of single cells. Genome Biol 20: 59. 10.1186/s13059-019-1663-x
- ↵Wouters MCA, Nelson BH. 2018. Prognostic significance of tumor-infiltrating B cells and plasma cells in human cancer. Clin Cancer Res 24: 6125–6135. 10.1158/1078-0432.CCR-18-1481
- ↵Wu SZ, Al-Eryani G, Roden DL, Junankar S, Harvey K, Andersson A, Thennavan A, Wang C, Torpy JR, Bartonicek N, 2021. A single-cell and spatially resolved atlas of human breast cancers. Nat Genet 53: 1334–1347. 10.1038/s41588-021-00911-1
- ↵Xu H, Wang S, Fang M, Luo S, Chen C, Wan S, Wang R, Tang M, Xue T, Li B, 2023. SPACEL: deep learning-based characterization of spatial transcriptome architectures. Nat Commun 14: 7603. 10.1038/s41467-023-43220-3
- ↵Xu H, Fu H, Long Y, Ang KS, Sethi R, Chong K, Li M, Uddamvathanak R, Lee HK, Ling J, 2024. Unsupervised spatially embedded deep representation of spatial transcriptomics. Genome Med 16: 12. 10.1186/s13073-024-01283-x
- ↵You Y, Fu Y, Li L, Zhang Z, Jia S, Lu S, Ren W, Liu Y, Xu Y, Liu X, 2024. Systematic comparison of sequencing-based spatial transcriptomic methods. Nat Methods 21: 1743–1754. 10.1038/s41592-024-02325-3
- ↵Zeisel A, Muñoz-Manchado AB, Codeluppi S, Lönnerberg P, La Manno G, Juréus A, Marques S, Munguba H, He L, Betsholtz C, 2015. Cell types in the mouse cortex and hippocampus revealed by single-cell RNA-seq. Science 347: 1138–1142. 10.1126/science.aaa1934
- ↵Zhang RJ, Kim TK. 2024. VISTA-mediated immune evasion in cancer. Exp Mol Med 56: 2348–2356. 10.1038/s12276-024-01336-6
- ↵Zhang Z, Zhao Y. 2022. Progress on the roles of MEF2C in neuropsychiatric diseases. Mol Brain 15: 8. 10.1186/s13041-021-00892-6
- ↵Zhang M, Eichhorn SW, Zingg B, Yao Z, Cotter K, Zeng H, Dong H, Zhuang X. 2021. Spatially resolved cell atlas of the mouse primary motor cortex by MERFISH. Nature 598: 137–143. 10.1038/s41586-021-03705-x
- ↵Zhao E, Stone MR, Ren X, Guenthoer J, Smythe KS, Pulliam T, Williams SR, Uytingco CR, Taylor SEB, Nghiem P, 2021. Spatial transcriptomics at subspot resolution with BayesSpace. Nat Biotechnol 39: 1375–1384. 10.1038/s41587-021-00935-2
- ↵Zheng P, Zhang N, Ren D, Yu C, Zhao B, Zhang Y. 2023. Integrated spatial transcriptome and metabolism study reveals metabolic heterogeneity in human injured brain. Cell Rep Med 4: 101057. 10.1016/j.xcrm.2023.101057
- ↵Zhong Z, Hou J, Yao Z, Dong L, Liu F, Yue J, Wu T, Zheng J, Ouyang G, Yang C, 2024. Domain generalization enables general cancer cell annotation in single-cell and spatial transcriptomics. Nat Commun 15: 1929. 10.1038/s41467-024-46413-6
- ↵Zhou X, Dong K, Zhang S. 2023. Integrating spatial transcriptomics data across different conditions, technologies and developmental stages. Nat Comput Sci 3: 894–906. 10.1038/s43588-023-00528-w