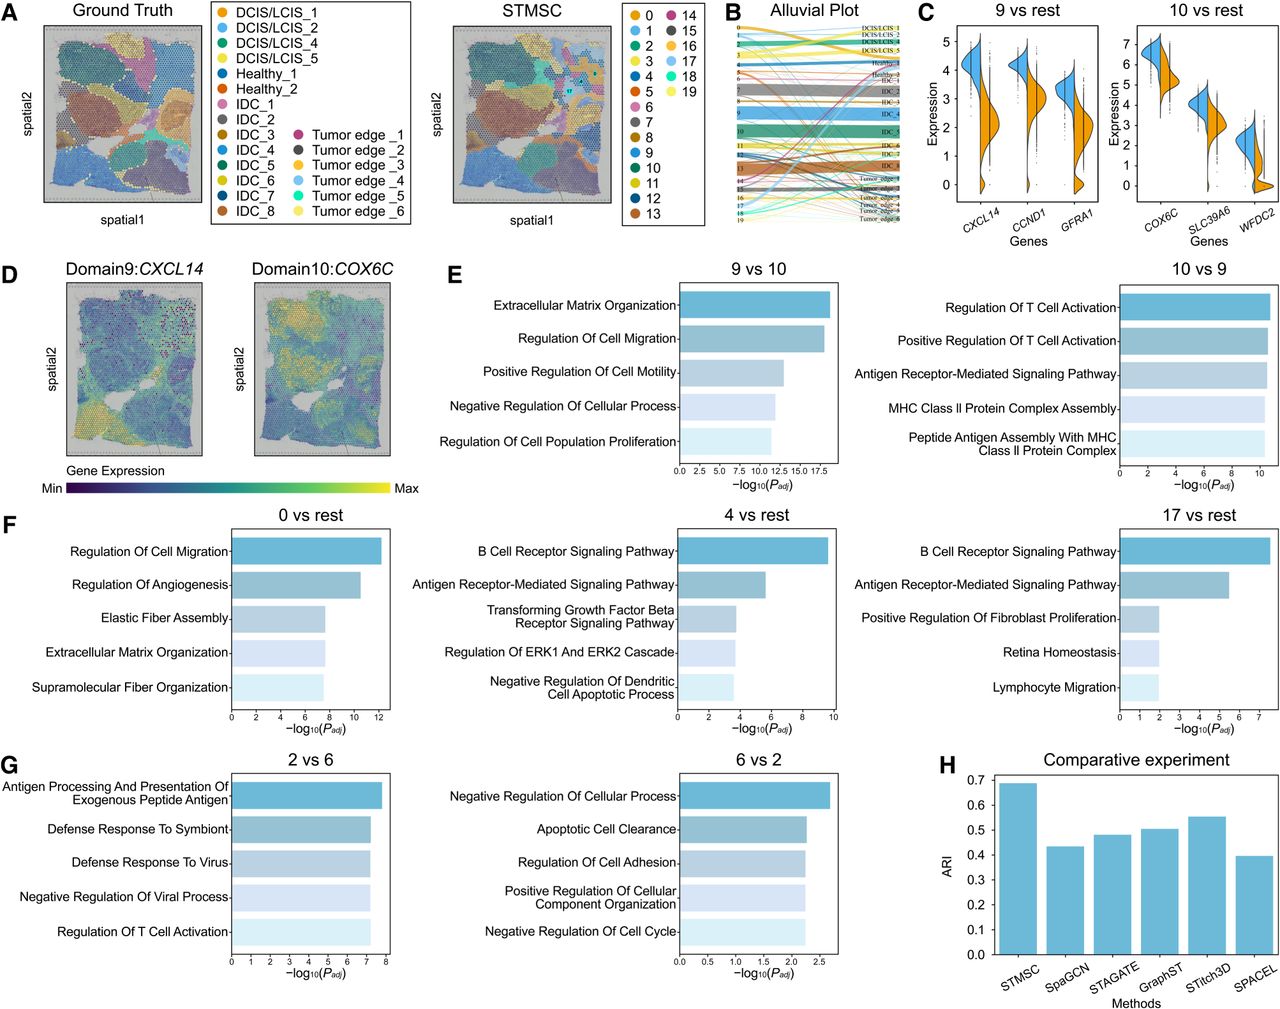
Figure 4.
Human breast cancer data set analysis results. (A) 2D visualization of STMSC spatial domain identification compared with true labels. (B) Alluvial plot showing correspondence between STMSC domains and manual annotations (ground truth). (C) Differential gene expression analysis for spatial domains 9 and 10. (D) Spatial expression visualization of CXCL14 and COX6C in spatial domains 9 and 10. (E) GO enrichment analysis with spatial domains 9 and 10 cross-referenced to each other. (F) GO enrichment analysis for spatial domains 0, 4, and 17. (G) GO enrichment analysis with spatial domains 2 and 6 cross-referenced to each other. (H) Comparison of ARI clustering evaluation metric for STMSC.