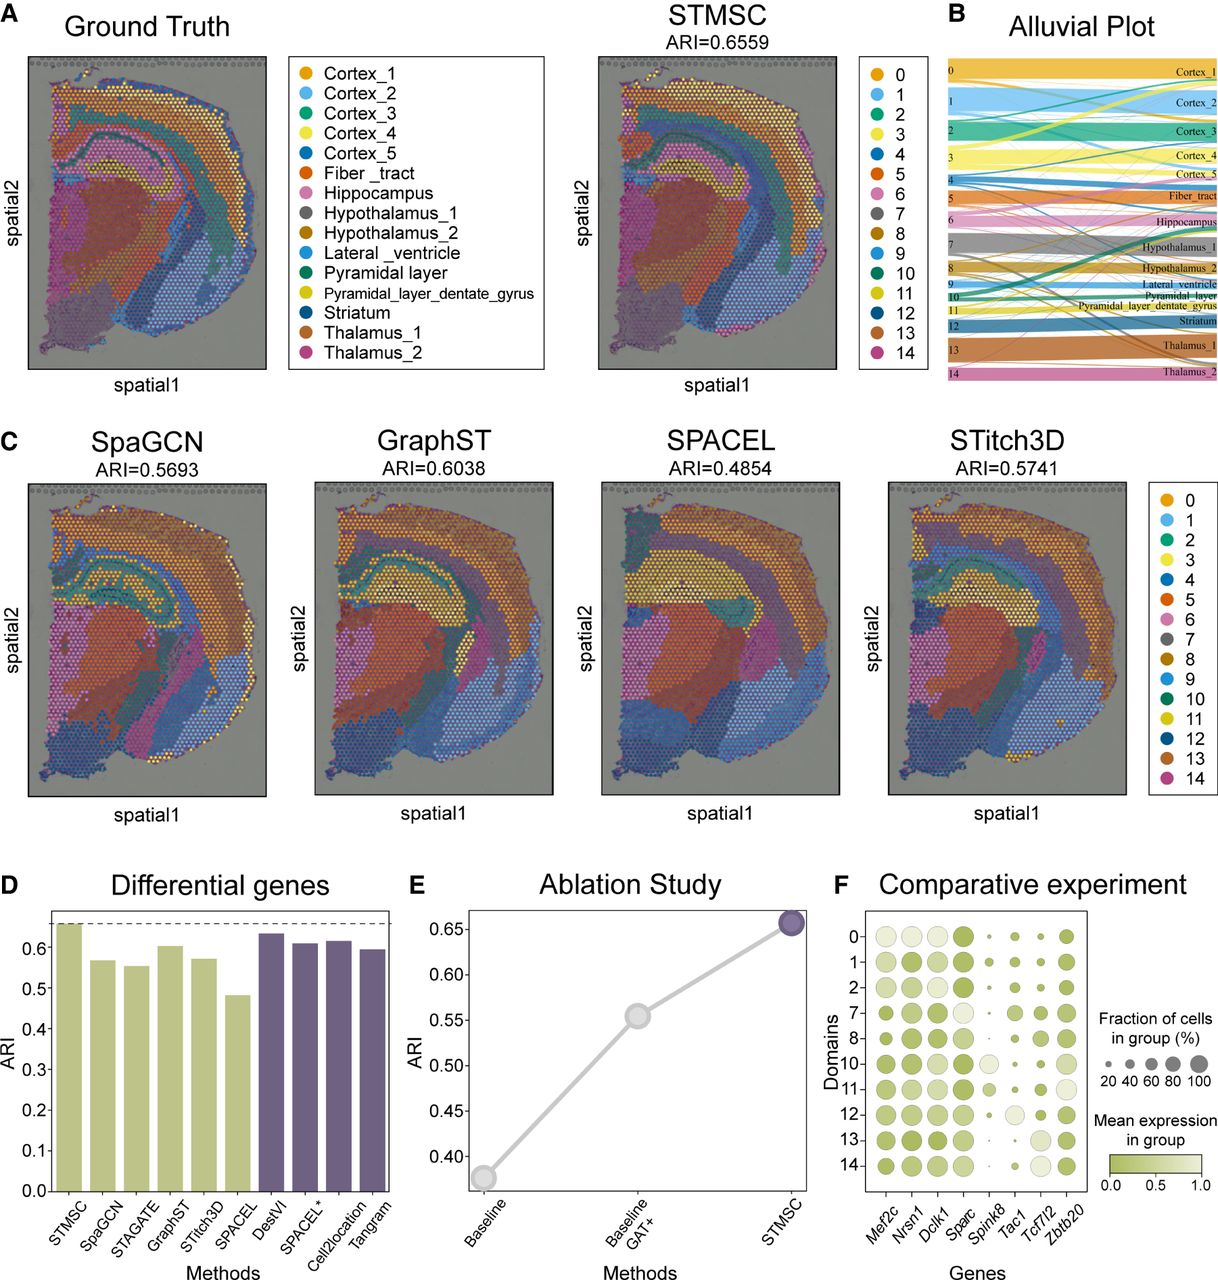
Figure 3.
Analysis of the mouse coronal brain data set. (A) 2D visualization of STMSC spatial domain identification versus true labels. (B) Alluvial plot showing correspondence between STMSC domains and manual annotations (ground truth). (C) 2D visualization of spatial domain identification by other methods. (D) ARI comparison of clustering on the mouse prefrontal cortex. (E) Ablation study results. (F) Dotplot of spatially differentially expressed genes.