
Abstract
Cell type annotation is a critical and essential task in single-cell data analysis. Various reference-based methods have provided rapid annotation for diverse single-cell data. However, selection of the optimal references and methods is often overlooked. To this end, we present a cross–data set cell type annotation methodology with a universal reference data and method selection strategy (CAMUS) to achieve highly accurate and efficient annotations. We demonstrate the advantages of CAMUS by conducting comprehensive analyses on 672 pairs of cross-species scRNA-seq data sets. The annotation results with references selected by CAMUS achieves substantial accuracy gains (25.0%–124.7%) over random selection strategies across five reference-based methods. CAMUS achieves high accuracy in choosing the best reference–method pair among 3360 pairs (49.1%). Moreover, CAMUS shows high accuracy in selecting the best methods on the 80 scST data sets (82.5%) and five scATAC-seq data sets (100.0%), illustrating its universal applicability. In addition, we utilize the CAMUS score with other metrics to predict the annotation accuracy, providing direct guidance on whether to accept current annotation results.
Single-cell technologies such as single-cell RNA sequencing (scRNA-seq) (Kharchenko 2021), single-cell spatial transcriptomics (scST) (Longo et al. 2021), and single-cell assay for transposase-accessible chromatin using sequencing (scATAC-seq) (Fang et al. 2021) have revolutionized our understanding of cellular diversity and complexity. These technologies enable researchers to investigate the transcriptomic, spatial, and epigenomic landscapes at single-cell resolution, offering unprecedented insights into understanding organismal development, physiological responses, and disease progression (Jia et al. 2018; Longo et al. 2021; Srivatsan et al. 2021).
One critical task in single-cell data analysis is cell type annotation (or cell typing) (Clarke et al. 2021; Brbić et al. 2022), allowing researchers to decipher cell heterogeneity and their functions within the tissue microenvironment. The prevalent manual annotation approach groups single cells into several clusters and annotates them based on unique molecular signatures (Clarke et al. 2021). This process needs prior biological knowledge and is time-consuming. However, as scRNA-seq can profile all genes (typically numbering in the tens of thousands), the clustering results from well-profiled scRNA-seq data are relatively distinct, resulting in high accuracy of cell type annotation. Recently, as extensive scRNA-seq data sets are generated and annotated, reference-based annotation methods have gained prominence (Clarke et al. 2021). These methods effectively transfer cell labels from the reference data set to the query one by leveraging the well-annotated scRNA-seq data sets. Reference-based methods such as CAME (Liu et al. 2023b), Seurat (Hao et al. 2024), SciBet (Li et al. 2020), scmap (Kiselev et al. 2018), and SCN (Tan and Cahan 2019) have demonstrated rapid cell annotation capabilities without needing prior biological knowledge. These methods potentially enable the cell type identification that may be overlooked or difficult to ascertain through manual annotation and have been successfully extended to various scenarios, encompassing different conditions, technologies, and species (Liu et al. 2023b; Hao et al. 2024).
Cell type annotation for scST data presents even more challenges, as spatial technologies such as seqFISH (Shah et al. 2018), STARmap (Wang et al. 2018), and MERFISH (Zhang et al. 2021) typically profile only hundreds of genes. This limitation results in blurred cluster boundaries and difficulties in manual annotation (Shen et al. 2025). Therefore, most scST studies utilize scRNA-seq data sets as a reference to help annotate scST data sets. For example, scANVI was employed to annotate MERFISH data derived from the kidney and liver (Xu et al. 2021; Liu et al. 2023a); RCTD was used on Slide-seq v2 data collected from the cerebellum and hippocampus (Cable et al. 2022); Tangram was applied to STARmap and MERFISH data originating from the cortex (Biancalani et al. 2021); and STAMapper was evaluated under scST data sets collected from eight scST technologies and five tissues (Shen et al. 2025).
Regarding scATAC-seq data, their extreme sparsity often constrains the performance of cell type annotation (Lin et al. 2022). This limitation necessitates the development of more sophisticated reference-based computational methods to assist cell typing. For instance, GLUE (Cao and Gao 2022), scJoint (Lin et al. 2022), and scDART (Zhang et al. 2022) learn a joint cell embedding from scRNA-seq and scATAC-seq data, which aids in annotating the scATAC-seq data.
Although we have well-designed reference-based cell type annotation methods for various omics data sets, no single method consistently achieves optimal performance across all omics types. Furthermore, for any given tissue or disease, numerous well-annotated scRNA-seq data sets are available as references. The choice of reference can significantly impact the annotation results. For single-cell assays, some cell types may be lost, underrepresented, or annotated incorrectly (Garmire et al. 2024). Naturally, reference and method selection are critical considerations. Without a solid understanding of biological context, users cannot assess the accuracy of algorithmic annotations. Estimating the accuracy of these annotations can also guide users directly in deciding whether to accept a particular annotation. However, to the best of our knowledge, there are currently no specific reference selection tools or method-agnostic optimizers designed for single-cell omics analysis. Although several annotation tools perform method-specific tuning, they do not provide a general-purpose framework that can assess and compare multiple reference–method pairs in a consistent and data-driven manner.
To this end, we present a cross–data set annotation methodology with a universal reference data and method selection strategy (CAMUS) for reference-based single-cell annotation methods. CAMUS prioritizes the annotation performance of reference-based methods by comparing the concordance between the annotation results and the per-clustered labels based on adjusted mutual information (AMI), we refer to this metric as the CAMUS score.
Results
Overview of CAMUS
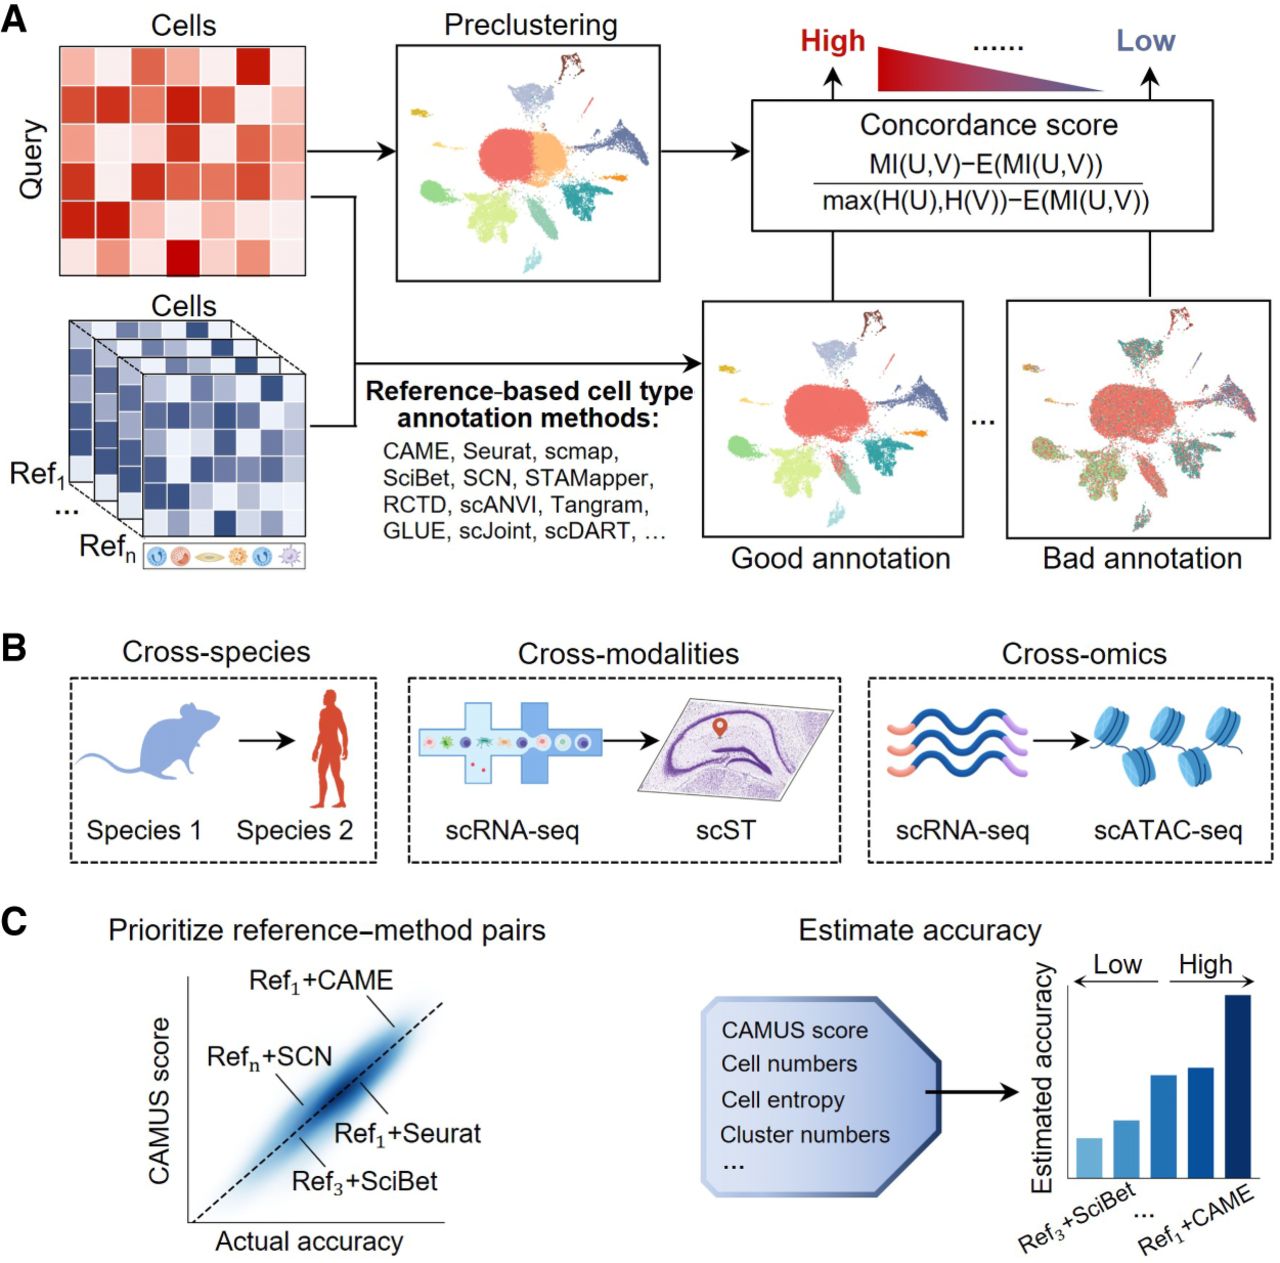
CAMUS aims to prioritize reference–method pairs and select the optimal one, ensuring the highest accuracy for a reference-based single-cell annotation task. CAMUS utilizes the single-cell expression profiles from the query data and the annotation results of various reference–method pairs as inputs (Methods) (Fig. 1A). It initially preclusters cells from query data into several distinct clusters (Fig. 1A) to approximate the cell type composition of the query data. It compares the concordance score between the preclustering and annotation results with various methods and references. A higher CAMUS score indicates a potentially higher annotation accuracy (Methods). CAMUS can be applied to three distinct cell type annotation scenarios: (1) cross-species (including species from human, mouse, zebrafish, chick, lizard, turtle, and macaque), (2) cross-modalities (from scRNA-seq data set to scST data set), and (3) cross-omics (from scRNA-seq data set to scATAC-seq data set) (Fig. 1B). CAMUS effectively prioritizes reference–method pairs with rankings highly correlated with the actual annotation accuracy. Furthermore, CAMUS precisely estimates annotation accuracy by utilizing the CAMUS score and additional cellular indices as predictors (Methods), offering users reliable guidance (Fig. 1C).
Overview of CAMUS. (A) CAMUS first preclusters single-cell data into several distinct clusters and then combines diverse reference data sets and reference-based annotation methods to annotate the query data set. CAMUS compares the concordance score between the preclustering and the various annotation results. A higher CAMUS score indicates a potentially higher annotation accuracy. (B) CAMUS is applied to three cell type annotation scenarios: (1) cross-species (including species from human, mouse, zebrafish, chick, lizard, turtle, and macaque), (2) cross-modalities (from scRNA-seq data set to scST data set),; and (3) cross-omics (from scRNA-seq data set to scATAC-seq data set). (C) CAMUS helps to define the rank of reference–method pairs, which is positively correlated with the corresponding actual accuracy. The CAMUS score serves as a predictor to estimate annotation accuracy for users.
CAMUS enables highly accurate reference selection for cross-species annotation
To demonstrate the effectiveness of CAMUS in prioritizing the reference data sets, we gathered 672 pairs of cross-species data sets from seven species and five tissues, each pair accompanied by manual annotations serving as the ground truth (Methods) (Supplemental Table S1). There are 53 distinct query data sets, 47 of which have three or more reference data sets. We applied five reference-based annotation methods to all data pairs: CAME (Liu et al. 2023b), Seurat (Hao et al. 2024), SciBet (Li et al. 2020), scmap (Kiselev et al. 2018), and SCN (Tan and Cahan 2019).
Across all 3360 data pairs, CAMUS scores demonstrated significant positive correlations with annotation accuracy for the five methods (Fig. 2A). In ∼99% of cases, references with higher CAMUS scores produced more accurate annotation results (Supplemental Fig. S1A). A closer look at four cross-species retinal data sets (about 30 references each) confirmed that the references ranked first by CAMUS always yield the best (or second-best) annotations, regardless of the annotation method used (Fig. 2B–E). Specifically, the optimal references selected by CAMUS consistently showed high accuracy, particularly for the better-performing annotation methods CAME and Seurat. Specifically, in the human Menon microfluidics data set, CAME was 0.9555, Seurat 0.9048, SciBet 0.7637, scmap 0.8215, and SCN 0.7890; in the mouse NMDA 12 h data set, CAME was 0.9800, Seurat 0.9389, SciBet 0.8776, scmap 0.8582, and SCN 0.6386; in the Chick P10 data set, CAME was 0.9323, Seurat 0.8402, SciBet 0.7310, scmap 0.6988, and SCN 0.5832; and in the zebrafish LD 4 h data set, CAME was 0.7747, Seurat 0.6109, SciBet 0.4363, scmap 0.5022, and SCN 0.3499. Furthermore, the reference selection has a substantial impact on annotation accuracy. The best reference can improve it by >150% compared with the worst (Fig. 2C), highlighting the importance of reference selection.
Application of CAMUS for reference selection in cross-species cell type annotation. (A–E) Scatter plot showing the significant positive correlation between the CAMUS score and annotation accuracy in all cross-species data pairs (n = 672; A), and specific query data sets from humans, mice, chicks, and zebrafish (B–E) for five cell annotation methods: CAME, Seurat, SciBet, scmap, and SCN. (F) Box plot indicating the accuracy of cell type annotation. The references are selected by CAMUS or randomly. For the random selection, we performed five independent replicates for each setting and report the average values. The P-value was calculated using the paired t-test. The data following the red arrow represent the percentage improvement for the median value relative to random selection. (G) Dot plot showing the top-one, top-two, and top-three accuracies of selecting the best reference by CAMUS or randomly.
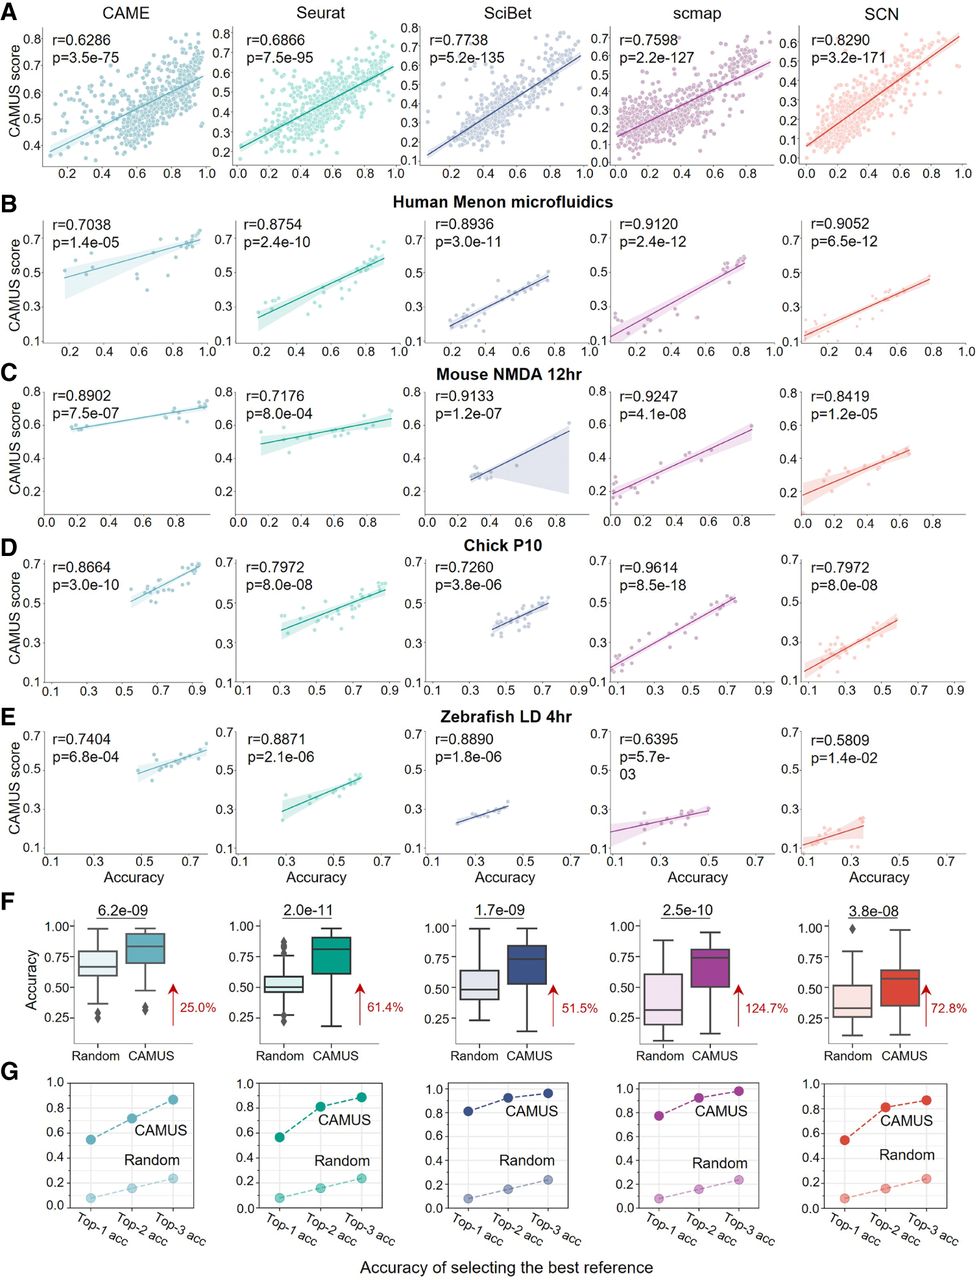
Next, we quantitatively evaluated the improvements by selecting references using CAMUS. For five distinct methods, the annotation accuracy improves over random selection strategies, ranging from 25.0% to 124.7% (Fig. 2F) using the best reference selected by CAMUS compared with random selection for all 672 data pairs. Substantial gains were also observed in both macro F1 score (12.1%–99.0%) and weighted F1 score (24.3%–127.8%) (Supplemental Fig. S1B,C). To quantify the impact of reference-set size on CAMUS, we subsampled the original reference data to 50% and evaluated the accuracy of both CAMUS and random sampling. The performance of CAMUS still significantly outperforms random selection (Supplemental Fig. S1D). This implies that reference data selection can enhance annotation accuracy and rare cell type identification. Furthermore, we observed significant variation in the dependence on references among different annotation methods. For instance, under the random selection strategy, CAME achieved significantly higher accuracy than Seurat (median 0.6671 vs. 0.5021, P = 2.2 × 10⁻¹²). However, this gap was greatly reduced when the reference selection was guided by the CAMUS score (median 0.8341 vs. 0.8101, P = 7.5 × 10⁻⁴), and the annotation accuracy improved significantly (Fig. 2F). This phenomenon was similarly reflected in other methods. That is to say, prioritizing the reference data sets is essential for more accurate annotation of a given query data. CAMUS significantly outperforms random selection in consistently identifying the top one to three references with much higher accuracy (Fig. 2G). Moreover, CAMUS demonstrates strong robustness in selecting the best reference across different clustering resolutions and various clustering methods and achieved stable top-one accuracy in selecting the best reference (∼55% for CAME, Seurat, and SCN, ∼80% for SciBet and scmap) (Supplemental Fig. S2A,B). Additionally, we divided the query data sets into those with fewer than 11 cell types (n = 23) and those with more than 11 cell types (n = 31). CAMUS consistently maintained robust performance across varying numbers of cell types, as well as under different clustering strategies and parameter settings (Supplemental Fig. S2C).
In single-cell data, when the number of the annotated cell types and the preclustering differ substantially (e.g., the reference-based annotation methods annotate cell subtypes whereas the preclustering only recovers major cell types), we want the CAMUS score to remain relatively high. We provide a formal theoretical justification for the superiority of the AMI over the adjusted Rand index (ARI) and the Fowlkes–Mallows index (FMI) (Supplemental Note 2; Supplemental Table S5). Therefore, we choose the AMI as part of the CAMUS framework. The real-world experiments on cross-species tasks further confirmed these results, in which the correlation between the AMI and the accuracy consistently outperformed that of the FMI and ARI across all five methods (Supplemental Fig. S3).
CAMUS enables highly accurate method selection for cross-species annotation
For all the 672 pairs of cross-species data sets considered, the average correlation between the CAMUS score and the annotation accuracy across five methods stands at 0.8807, suggesting that higher CAMUS scores are typically associated with more accurate annotations by the methods. Specifically, for the retina data (Supplemental Table S1), 595 out of the 598 data pairs demonstrated a positive correlation between the CAMUS score and the accuracy of the five annotation methods. It showed an average correlation of more than 0.74 across all query data sets (Fig. 3A). Moreover, for all the 672 pairs of cross-species data sets, CAMUS achieved an accuracy of more than 0.82 in selecting the best methods (Fig. 3B). Using methods selected by CAMUS, we observed a median of 51.3% increase in accuracy, a 49.4% increase in macro F1 score, and a 57.3% increase in weighted F1 score compared with the random selection (Fig. 3C).
Application of CAMUS for method selection in 672 pairs of cross-species cell type annotations. (A) Dot plot showing the correlation between the accuracy of five cell annotation methods (i.e., CAME, Seurat, SciBet, scmap, and SCN) and the corresponding CAMUS score for retina data collected from zebrafishes, mice, humans, and chicks. For each dot, color represents a positive correlation, and gray represents a negative correlation. Each cross-species pair has corresponding reference–query combinations, whereas same-species pairs do not. (B) Bar plot showing the top-one, top-two, and top-three accuracies of selecting the best methods by CAMUS or randomly. (C) Box plot indicating the accuracy, macro F1 score, and weighted F1 score of cell type annotation for methods selected by CAMUS or randomly. The data following the red arrow represent the percentage improvement for the median value relative to random selection. (D) Pearson correlation between the CAMUS score and cell type annotation accuracy, in which each point represents a reference–method pair. (E) UMAP plots of mouse retina cells from the Macosko data set; cells are colored according to the manual annotation, and the annotations of CAME using the Menon Seqwell, Menon microfluidics, and Chick P10 as references (top panels). Here, ACC refers to accuracy. Bar plots showing the cell ratio of the corresponding data set (bottom panels).
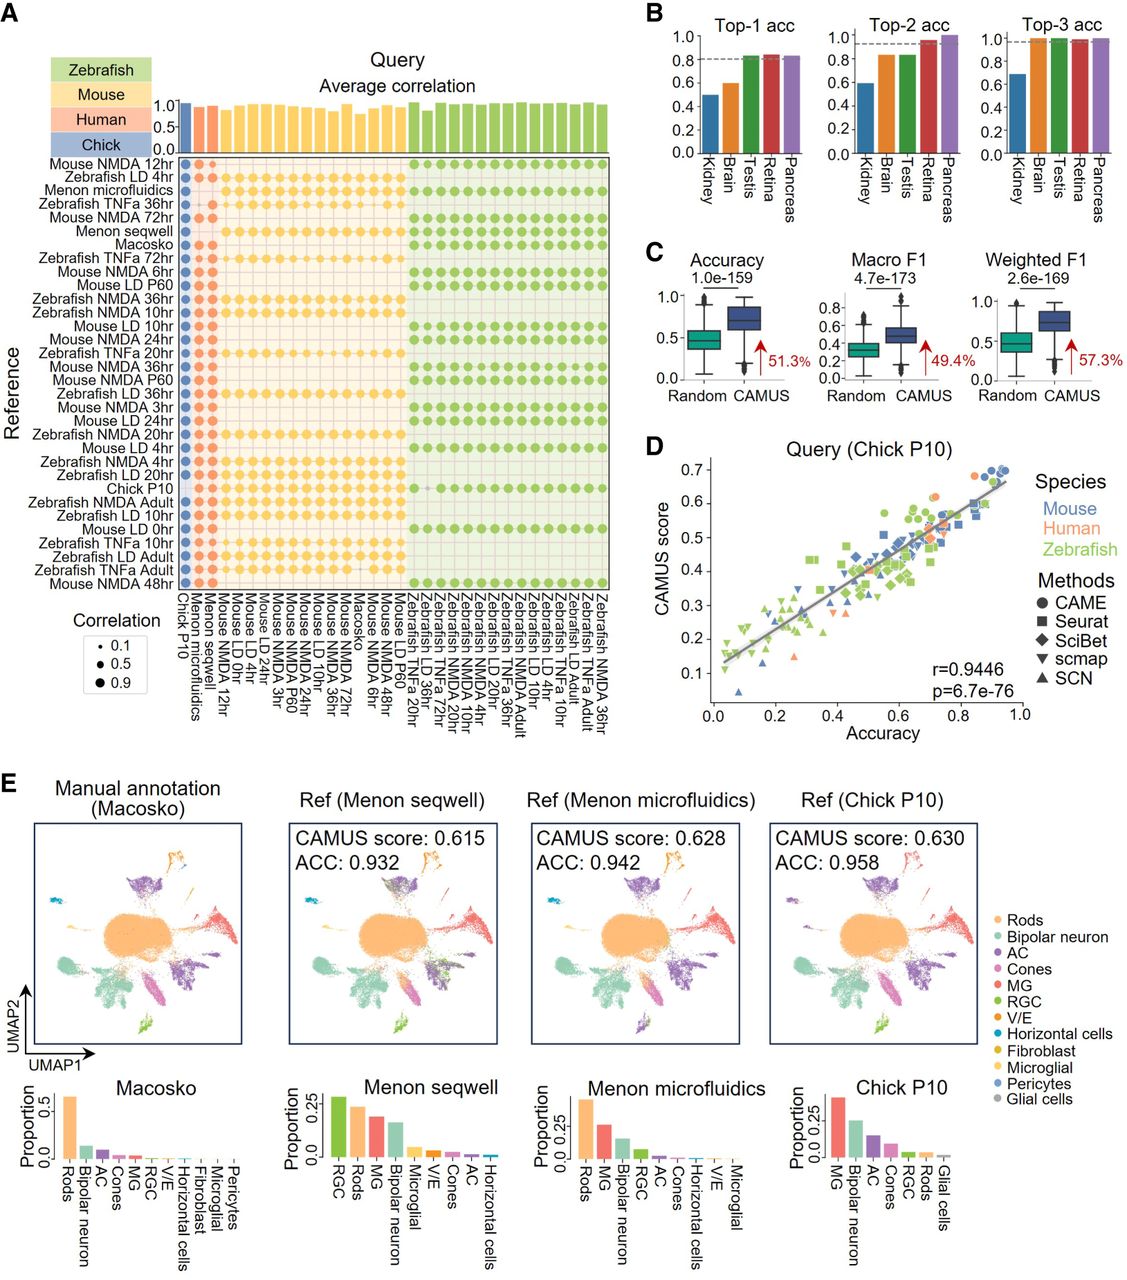
Having confirmed that CAMUS can accurately select reference data and methods separately, we next examined the relationship between annotation accuracy and CAMUS scores for all reference–method pairs. For all the 3360 reference–method pairs, we achieved high accuracy in selecting the optimal pair for each query data. Specifically, we attained 49.06% for top-one accuracy, 63.78% for top-two accuracy, and 71.70% for top-three accuracy. These results represented a significant improvement compared with random selection (Supplemental Fig. S4A). Using the Chick P10 data set (Macosko et al. 2015) as the query and 31 mouse, human, and zebrafish data sets as references (Fig. 3A), we again observed a strong positive association between the CAMUS score and annotation accuracy across all reference–method pairs (r = 0.9446, P = 6.7 × 10−76). Notably, the reference–method pairs that CAMUS ranked highest also produced the most accurate annotations (Fig. 3D). Meanwhile, in annotating the Macosko data set using zebrafish Tnfa adult as the reference, the annotation accuracy of the five methods exhibited a slight negative correlation with the CAMUS scores (Fig. 3A). Additionally, all methods demonstrated relatively poor annotation accuracy, ranging from 0.1642 to 0.3237 (Supplemental Table S2). To evaluate the cause, we carefully examined the cell proportions and the annotation quality between the reference and query data sets. We identified issues with the annotation of rod cells in the reference data, in which some bipolar neurons also expressed the gene rho, which is the marker of the rod cell (Supplemental Fig. S4B,C; Hoang et al. 2020). Rod cells happen to be the most prevalent cell type in the Macosko data set (Fig. 3E). This indicates that reference quality is a critical factor in the process of reference-based annotation. We found that our clustering of the Macosko data set resulted in 17 groups, significantly more than the 11 existing cell types (Fig. 3E; Supplemental Fig. S4D). However, the prioritization of methods based on CAMUS scores still effectively reflected the performance of the annotations. We also discovered that a closer match in cell type proportions between the reference and query data does not necessarily lead to better annotation (Fig. 3E). Furthermore, the reference data Chick P10, which performed the best with CAME, was not the optimal choice for Seurat (Supplemental Fig. S4E). This indicates that different methods have different preferences for the reference data. Therefore, the optimal data set should be reselected for each.
CAMUS achieves additional enhancements when incorporated with reference-integrated strategies
Because of limited reference data sets, we may encounter situations in which the annotation may be unsatisfactory even with the best reference–method pair selection. This issue often arises because some references may lack distinctive cell types or be underrepresented or because some cells are mislabeled. Integrating multiple references should, in principle, widen cell type coverage and mitigate the impacts of annotation errors in any single data set. The central question is how to combine multiple references effectively and whether this strategy indeed improves query annotation. To explore this, we collected 3522 pairs of cross-species data sets, in which each query datum has two distinct references (named reference 1 and 2, respectively; Methods).
We employed the ensemble and multireference (multi-ref) strategies to integrate these references. We did not apply the ensemble strategy with SciBet and scmap because they do not provide probability-based results (Methods). For most methods, employing a multi-ref strategy yields less than a 50% probability of outperforming both single references; that is, CAME had 42.5% (n = 1496), Seurat 39.3% (n = 1384), SCN 37.8% (n = 1333), SciBet 53.8% (n = 1896), and scmap 26.5% (n = 934). We can observe analogous results under an ensemble strategy; that is, CAME had 45.5% (n = 1602), Seurat 42.6% (n = 1499), and SCN 25.9% (n = 911) (Supplemental Fig. S5A). Moreover, these two strategies ensure that in the majority of instances (∼80% for multi-ref and ∼95% for ensemble), the accuracy will surpass the inferior single reference. In other words, these two strategies enhance annotation accuracy by moderately raising the upper limit and significantly ensuring the lower limit. That is why multi-ref and ensemble strategies likely yield superior performances compared with randomly selecting a reference (Supplemental Fig. S5B). Besides integrating the reference data, another simple approach is to achieve the best-performing reference selection using CAMUS. CAMUS ensures a higher probability that the selected result will surpass any single reference; that is, CAME had 74.2% (n = 2613), Seurat 76.3% (n = 2689), SCN 74.2% (n = 2617), SciBet 72.4% (n = 2550), and scmap 73.9% (n = 2604). CAMUS significantly raises the lower limit of annotation results (Supplemental Fig. S5A). We also combined the above three strategies, namely, using CAMUS to select the best among multi-ref, ensemble, and two single references. We found that this combined approach could yield improvements ranging from 9.3% to 39.3% compared with randomly selecting from the two individual references (Supplemental Fig. S5C).
Next, we annotated the mouse NMDA P60 retinal data (Hoang et al. 2020) using the zebrafish LD 10 h retinal data (reference 1) (Hoang et al. 2020), zebrafish Tnfa 72 h retinal data (reference 2) (Hoang et al. 2020), and the two integrating strategies (Supplemental Fig. S5D). Using references 1 and 2 individually led to annotation errors for bipolar neurons and rod cells, respectively. The ensemble and multi-ref strategies leveraged the advantages of both reference data sets, thereby correcting the misannotated cell types. Moreover, CAMUS perfectly aligned the ranking of these four scenarios (i.e., reference 1 only, reference 2 only, ensemble, and multi-ref) with their actual annotation performance. Additionally, when the two integrating strategies do not yield improvements, CAMUS can also assist us in rejecting them (Supplemental Fig. S5E).
In short, CAMUS can help us to determine whether reference integration strategies offer improvements over single references and to select the better-performing one (Supplemental Fig. S5B). When reference data are limited, CAMUS can incorporate reference-integrated approaches, namely, the multi-ref and ensemble, to achieve better annotations.
CAMUS enables highly accurate method selection for scST and scATAC-seq data
We further applied CAMUS to 80 scST and five scATAC-seq data sets as the query data to assess its applicability to other complex scenarios (Methods). The scST data sets were derived from the brain (Shah et al. 2017; Codeluppi et al. 2018; Moffitt et al. 2018; Eng et al. 2019; Zhang et al. 2021; Zeng et al. 2023; Russell et al. 2024), embryo (Lohoff et al. 2022), retina (Choi et al. 2023), kidney (Liu et al. 2023a), and liver (Liu et al. 2023a) profiled by six distinct spatial technologies (Methods) (Supplemental Table S3), and the five scATAC-seq data sets were obtained from peripheral blood mononuclear cells (PBMCs; https://www.10xgenomics.com/cn/datasets/pbmc-from-a-healthy-donor-no-cell-sorting-10-k-1-standard-2-0-0), bone marrow mononuclear cells (BMMCs) (Luecken et al. 2021), cortex (Chen et al. 2019), skin (Ma et al. 2020), and primary motor cortex (Mop) (Yao et al. 2021). Each query data set pairs with a well-annotated scRNA-seq data set as a reference (Methods) (Supplemental Table S4). The CAMUS score and annotation accuracy in 78 scST data sets showed distinct positive correlations. The two exceptions come from the smFISH embryo 1 and 2 data owing to their limited 33 genes (Supplemental Fig. S6A; Supplemental Table S3). CAMUS achieved a median probability of 0.8250 to select the best methods (Fig. 4A). Even with significant adjustments in clustering resolution (from 0.2 to 0.6), CAMUS consistently maintained robust top-one accuracy ranging from 82.50% to 86.25% (Supplemental Fig. S6B), highlighting its robustness to clustering parameters and underscoring its versatility and reliability in various biological scenarios. It is worth noting that, for the clustering of scST data, the limited number of genes measured may lead to blurry clustering boundaries or different cell types being wrongly mixed into a single cluster. Specifically, we focused on the mouse hypothalamic region scST data set containing 11 cell types (Moffitt et al. 2018). With only 161 profiled genes, the clustering method cannot clearly distinguish excitatory and inhibitory neurons (Supplemental Fig. S7A,B). However, this does not affect the efficacy of CAMUS, which still provides method prioritizations that align perfectly with annotation accuracy (Fig. 4B).
Application of CAMUS to select annotation methods in cross-modalities and in cross-omics cell annotation scenarios. (A) Bar plot showing the top-one accuracy of selecting the best methods by CAMUS for annotating scST data sets. (B) UMAP plots of mouse hypothalamic region scST data set; cells are colored by manual annotation, the annotation of STAMapper, scANVI, RCTD, and Tangram, respectively. (Astro) Astrocytes, (Endo) endothelial cells, (Ep) ependymal cells, (Exc) excitatory neurons, (Inh) inhibitory neurons, and (OD) oligodendrocyte. Here, ACC refers to accuracy. (C) Dot plot showing the positive relationship between CAMUS score and ACC. (PBMC) Peripheral blood mononuclear cells, (BMMC) bone marrow mononuclear cells, (Mop) primary motor cortex. (D) UMAP plots of PBMC scATAC-seq data set; cells are colored according to manual annotations and the annotations by GLUE, Seurat, scJoint, scANVI, and scDART, respectively.
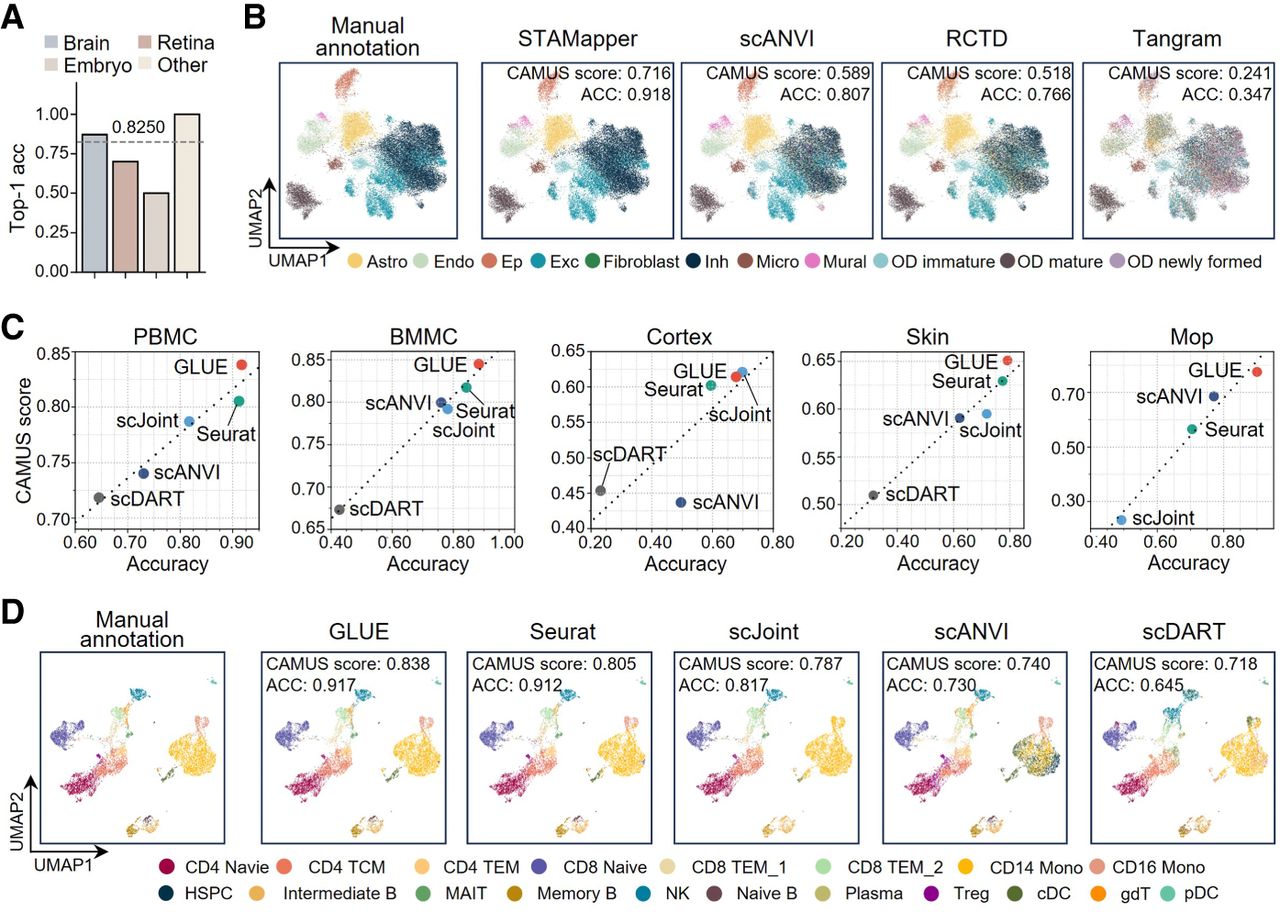
For the scATAC-seq data sets, we applied a higher resolution for the clustering method because their annotations were at the subtype level. Notably, we did not employ scDART for the Mop data owing to its runtime exceeding a week (Methods). We found that, in most cases, GLUE outperformed other methods, which was consistent with its CAMUS score. scJoint achieved slightly higher accuracy on the cortex data. CAMUS successfully captured this and selected scJoint as the optimal method (Fig. 4C). CAMUS exhibited perfect top-one accuracy and stable performance with varied clustering resolution (Supplemental Fig. S7D). To further assess CAMUS's performance at the cellular subtype resolution, we carefully analyzed the PBMC data, which comprises 19 subpopulations. Although CAMUS preclustered the data into only 12 clusters, showing a distinct mismatch with the original number of subpopulations, it still achieved perfect consistency with annotation accuracy (Fig. 4D; Supplemental Fig. S7C). Specifically, GLUE and Seurat exhibited comparable accuracy (0.917 vs. 0.912), whereas GLUE achieved the higher CAMUS score, as expected (0.838 vs. 0.805). In contrast, scJoint mistakenly annotated CD16 Mono cells as CD14 Mono cells, resulting in lower accuracy (0.817) and CAMUS score (0.787). scANVI misclassified a subset of CD8 TEM_2 cells as gdT cells and part of the CD14 Mono cells as cDC and HSPC cells, leading to a reduced accuracy (0.730) and CAMUS score (0.740). scDART produced nearly entirely incorrect annotations for CD8 TEM_2 cells, CD16 Mono cells, and gdT cells, yielding the lowest accuracy (0.718) and CAMUS score (0.645).
From a theoretical perspective, both GLUE and Seurat successfully annotated nearly all existing cell types, with discrepancies from the clustering results occurring only in a few rare cell types. Consequently, they achieved the highest CAMUS scores. scJoint, despite misclassifying only one minor subtype (CD16 Mono), still showed a moderate drop in CAMUS score, ranking just behind GLUE and Seurat. On the other hand, scANVI and scDART produced multiple misannotations, sharply reducing both accuracy and CAMUS score. For example, scANVI annotated a large fraction of cells in the CD14 Mono population as cDC or HSPC cells, whereas scDART annotated several distinct cell types into NK cells. These errors followed a common pattern: either splitting a single major cell type into several incorrect annotations or merging multiple cell types into one. CAMUS can capture such common-pattern errors in misannotations, as they inherently conflict with the underlying clustering structure, thereby assisting researchers in identifying and avoiding them in practical analyses. We also applied CAMUS to four additional scATAC-seq data sets collected from the retina, Alzheimer's disease (AD) cortex, control cortex, and kidney (Morabito et al. 2021; Muto et al. 2021; Wang et al. 2022). CAMUS continues to select the best annotation method, confirming its robustness and generalizability in the scATAC-seq setting (Supplemental Fig. S7E).
CAMUS score helps predict the accuracy of cell type annotations
Although CAMUS facilitates the reference and method selection, users may not know whether the chosen reference–method pair can produce reliable annotations. For instance, if the best reference–method pair achieves a CAMUS score of 0.5, users cannot predict the corresponding annotation accuracy, which may range from ∼20% to ∼90% (Fig. 2A). When users lack relevant biological knowledge or when they are annotating data from a new species, it is exceedingly difficult for them to estimate the annotation accuracy. Even with relevant biological background knowledge, such as verifying the cell type annotations by examining the marker genes’ expression, a significant amount of time is required. Therefore, it becomes critical to provide an estimate of annotation accuracy rapidly.
Given that the CAMUS score significantly correlates with accuracy, it could serve as a powerful predictor. Other predictors, such as the cell number, the cluster number, and cell entropy under different clustering resolutions in the query data, also contribute to predicting the cell annotation accuracy (Methods). We adopted the recently published machine learning method AutoGluon (Erickson et al. 2020) and the median absolute error (MAE) between the estimated accuracy and the actual accuracy as the evaluation metric. We achieved an MAE of 0.0453 for the 10-fold cross-validation on 672 pairs of cross-species data encompassing all the cell annotation methods (Methods) (Supplemental Fig. S8A). Methods that performed better in annotation achieved even lower MAE values: CAME, 0.0375; Seurat, 0.0448; and SciBet, 0.0344 (Methods) (Supplemental Fig. S8A). Moreover, we validated the trained model on scST data, achieving an MAE of 0.0560 (Supplemental Fig. S8B). Our model exhibits low error across all transcriptomic data, potentially attributable to the similarity in their data types and the same normalization procedures. Despite the preprocessing and normalization methods for scATAC-seq data being entirely different from those of scRNA-seq, our model still achieved a low MAE (0.0557) (Supplemental Fig. S8C). Consistent with the conclusions drawn from cross-species data, for the best-performing method, GLUE, we achieved a lower MAE (0.0428). This indicated that for the best results obtained through CAMUS selection, we can expect even lower MAEs.
Discussion
Precise and rapid annotation of single-cell data with reference-based methods is essential for deciphering cell types and their complex interactions (Dimitrov et al. 2022). The selection of references and methods distinctly influences the outcomes of annotations (Figs. 2A, 3C). However, the critical selection process has not been seriously explored. In this study, we develop a universal reference and method selection method, CAMUS. CAMUS provides a score significantly correlated with annotation accuracy. It works by directly comparing data clustering results with its annotations, thus enabling a smooth expansion to any biologically structured single-cell data.
In real-world data sets, CAMUS demonstrated high accuracy in selecting references and methods for annotating scRNA-seq, scST, and scATAC-seq data. Extensive tests indicate that the clustering resolution has a minimal impact on the performance of CAMUS. Despite unclear boundaries or some errors in clustering, CAMUS consistently achieved high top-one accuracy. Even when there was a significant discrepancy between the number of clusters and the actual cell types, the performance of CAMUS was not compromised. CAMUS can also be employed for method selection when dealing with annotations of subtypes within the data. In many single-cell data sets, particularly in modalities such as scATAC-seq, ground-truth cell type annotations are either unavailable or uncertain. This limitation poses a challenge for objectively evaluating the reliability of computational annotation methods. Our results demonstrate that CAMUS scores are strongly and positively correlated with annotation accuracy when ground-truth labels are available, suggesting that CAMUS could serve as a proxy metric for annotation quality in settings in which such labels are lacking.
The reference data quality is critical for the reference-based annotation of single cells. Moreover, incorrect cell annotations can adversely affect the outcomes of annotation methods. Therefore, users should carefully evaluate the reference data quality and their annotations before employing reference-based methods. CAMUS is a powerful tool for assessing the effectiveness of the reference data for annotating query data. When the reference data are of high quality, the differences among methods diminish significantly. Thus, when sufficient reference data sets are available, users should prioritize selecting the appropriate references. When a specific new single-cell technique lacks mature annotation methods, collecting and selecting proper references through CAMUS can be highly beneficial. This also poses new demands for establishing databases to collect more high-quality data sets (e.g., SpatialDB [Fan et al. 2020] and PanglaoDB [Franzén et al. 2019]).
Recently, an AI-generated reference atlas launched by Synthesize Bio (https://app.synthesize.bio/datasets) has emerged as a promising resource for standardizing cell type annotations across studies. Although the current early-access release is limited to bulk RNA-seq data, the developers have announced that single-cell modalities are in active development. Once available, these synthetic single-cell data sets could provide abundant, cost-effective, bias-reduced cell type annotations as well as a reproducible reference framework. When integrated with CAMUS, these AI-generated reference atlases should markedly enhance the robustness and cross-study comparability.
One potential limitation of CAMUS is that it does not consider the prior biological knowledge inherent in the data, such as marker genes for its potential cell types, which could serve as an additional measure of annotation accuracy. Moreover, a diverse range of methods and cross-modality data sets should be collected, for instance, transcriptomics to proteomics or transcriptomics to metabolomics, to comprehensively evaluate and improve CAMUS. In the future, a dedicated database of data sets and methods should be established, integrating CAMUS to assist users in selecting reference data and annotation methods.
Methods
Data preprocessing
We processed the count matrices for scRNA-seq and scST data sets via SCANPY (Wolf et al. 2018) (https://scanpy.readthedocs.io/en/stable/index.html). We first normalized the library size for each cell, followed by a logarithmic transformation of the expression data with a pseudocount using the scanpy.pp.normalize_total() function and the scanpy.pp.log1p() function. Subsequently, we selected the top 3000 highly variable genes (HVGs) using the scanpy.pp.highly_variable_genes() function. In cases in which the scST data sets comprised fewer than 3000 genes, we used the entire gene set. The data were then scaled using the scanpy.pp.scale() function and subjected to principal component analysis (PCA) via the scanpy.tl.pca() function, in which the top 50 principal components were computed. A k-nearest neighbor (KNN) graph was then constructed using 10 neighbors and the first 40 principal components using the scanpy.pp.neighbors() function. Clustering was subsequently performed on the KNN graph using the Leiden algorithm (Traag et al. 2019) with the default resolution parameter set to 0.4 via the scanpy.tl.leiden() function for all data sets presented in Figure 4D. We used SnapATAC2 to preprocess the scATAC-seq data sets. Following its documentation (https://kzhang.org/SnapATAC2/index.html), we first imported data fragment files and the reference genome (hg38 for humans and mm10 for mice) using the snap.pp.import_fragments() function. We generated a cell-by-bin matrix containing insertion counts across genome-wide 500 bp bins using the snap.pp.add_tile_matrix() function. We then employed spectral embedding calculated on the top 250,000 features using the snap.tl.spectral() and snap.pp.select_features() functions. Finally, we clustered the data using the Leiden algorithm with a default resolution parameter of 0.7 and the snap.tl.leiden() function for data sets presented in Figure 4D. We also adjusted the clustering resolution for data sets presented in Supplemental Fig. S7E (0.1 for the kidney and retina data, 0.3 for the cortex data) (see section “Adjusting the clustering resolution in CAMUS”).
Benchmarking cell type annotations
Cross-species scRNA-seq data sets
We performed (1) CAME (Liu et al. 2023b) with its Python package, referred to its documentation (https://xingyanliu.github.io/CAME/tut_notebooks/getting_started_pipeline_un.html); (2) Seurat (Hao et al. 2024) with its R (R Core Team 2025) package detailed in its documentation (https://satijalab.org/seurat/articles/integration_mapping); (3) SciBet (Li et al. 2020) with its R package detailed in its documentation (http://scibet.cancer-pku.cn/); (4) scmap-cluster (Kiselev et al. 2018) with the R package scmap, following its documentation (https://bioconductor.org/packages/release/bioc/vignettes/scmap/inst/doc/scmap.html); and (5) SCN (Tan and Cahan 2019) with its R package SingleCellNet, following its documentation (https://github.com/CahanLab/singleCellNet?tab=readme-ov-file#introduction).
scST data sets
We performed (1) STAMapper with its Python package, referred to its documentation (https://github.com/zhanglabtools/STAMapper/tree/main/Tutorials); (2) scANVI (Xu et al. 2021) with the scVI Python package, referencing the “Integration and label transfer with Tabula Muris” section from its documentation (https://docs.scvi-tools.org/en/stable/tutorials/notebooks/scrna/tabula_muris.html); (3) RCTD (Cable et al. 2022) with the R package spacexr, utilizing its default workflow (https://raw.githack.com/dmcable/spacexr/master/vignettes/spatial-transcriptomics.html); and (4) Tangram (Biancalani et al. 2021) with its Python package, employing the cluster mode configuration detailed in its tutorial (https://tangram-sc.readthedocs.io/en/latest/tutorial_sq_link.html).
scATAC-seq data sets
We implemented (1) GLUE (Cao and Gao 2022) with its Python package scglue, referring to its documentation (https://scglue.readthedocs.io/en/latest/); (2) scJoint with its Python package detailed in its GitHub page (https://github.com/SydneyBioX/scJoint); (3) Seurat (Hao et al. 2024) with its R package, referring to its documentation (https://satijalab.org/seurat/articles/seurat5_atacseq_integration_vignette); (4) scANVI (Xu et al. 2021), referring to the documentation from SnapATAC2 (Zhang et al. 2024; https://scverse.org/SnapATAC2/tutorials/annotation.html); and (5) scDART (Zhang et al. 2022) with its Python package, following its documentation (https://github.com/PeterZZQ/scDART). Because GLUE and scDART only perform the data integration of scRNA-seq and scATAC-seq data, we trained a KNN classifier from the sklearn (Pedregosa et al. 2011) Python package with k = 10 on the integrated embeddings of scRNA-seq data to predict the cell labels from scATAC-seq data.
Calculation of CAMUS score
CAMUS takes the count matrix of query data and the annotation results generated by different references and methods as input. CAMUS consists of two parts; we first precluster the query data (section “Data preprocessing”). For query data with m cells, C = {c1, …, cm}, suppose we have the clustering results U = {U1, …, Us} with s clusters, where Ui denotes the ith cluster set and the annotation results are V = {V1, …, Vt} with t cell types, where Vi denotes the cell set of type i. It should be noted that for all i ≠ j:
We then define the concordance score between the two partitions U and V as the AMI (Vinh et al. 2009). Let matrix M = [nij], i = 1, …, s, j = 1, …, t, where nij denotes the number of shared cells for Ui and Vj. We calculate the probability of randomly picking a cell that belongs to Ui:
Finally, we defined the CAMUS concordance score between U and V as
Adjusting the clustering resolution in CAMUS
Conceptually, the performance of CAMUS is most reliable when the number of clusters is close to the number of annotated cell types, as the CAMUS score is fundamentally derived from the concordance between clustering results and annotations. To achieve this, we recommend adjusting the resolution parameter in CAMUS to align the granularity of the annotation level derived from reference-based methods. The resolution parameter influences the tendency of the preclustering step to generate finer or coarser partitions: Higher values encourage the formation of smaller, more detailed clusters, whereas lower values favor larger, more aggregated clusters.
Estimating the annotation accuracy
We used the number of total cells of the query data set as the first predictor. We also used the number of clusters, cell entropy, and CAMUS concordance score under the clustering resolution of 0.2, 0.4, 0.6, and 0.8 as other predictors. Suppose we have a data set of m cells, and clustering results U = {U1, …, Us}, where the number of cells in Ui is mi. To calculate the cell entropy, we first calculate the cell ratio for each cluster, , and then the cell entropy as
Reference-integrated strategies
Suppose we have a query data set with m cells and two reference data sets: reference 1 with n1 cells and p1 genes and reference 2 with n2 cells and p2 genes. Here, we propose two strategies to integrate these two references. For the references of the same species and tissue type, we extract all possible combinations of them, ultimately obtaining 3522 data triplets (reference 1, reference 2, query).
Ensemble
Suppose we have q1 distinct cell types for reference 1 and q2 distinct cell types for reference 2. Both references share q common cell types. Then, using reference 1 and query data sets as the input of the cell annotation method, we will have a probability matrix, , where each the row i and column j of P1 denotes the probability of the cell i belongs to cell type j. And we will have when using reference 2 and query data sets as the input. We denote as the probability matrix for the q shared cell types. Also, utilizing the annotation results from references 1 and 2, we can calculate the CAMUS scores u1 and u2, respectively. We then ensemble the two probability matrices:
We next incorporate the unique cell type probabilities to matrix P and assign the cell type with the highest probability to the corresponding cells.
Multi-ref
Here, we concatenate the two reference data sets. Assuming that reference 1 and 2 data sets share p genes, the resulting combined matrix consists of n1 + n2 cells and p genes. We used the combined matrix as a new reference to annotate the query data.
Data sets
All data sets analyzed in this study are publicly available from the links provided.
Cross-species scRNA-seq data sets
The cross-species scRNA-seq data sets are as follows:
Data sets 1–2: (pancreas, human, mouse), inDrop, GSE84133 in the NCBI Gene Expression Omnibus (GEO; https://www.ncbi.nlm.nih.gov/geo/).
Data set 3: (pancreas, human), CEL-Seq, CEL-Seq2, Fluidigm C1, and Smart-seq2; a mixed pancreas data set produced across four technologies, distributed in SeuratData package (https://satijalab.org/seurat/articles/integration_mapping).
Data set 4: (pancreas, mouse), Smart-seq2 (https://figshare.com/articles/dataset/Single-cell_RNA-seq_data_from_Smart-seq2_sequencing_of_FACS_sorted_cells_v2_/5829687/7).
Data sets 5–7: (testis, human, monkey, mouse), Drop-seq, GSE142585 in the GEO database.
Data set 8: (brain, human), snDrop-seq, GSE97942 in the GEO database.
Data set 9: (brain, mouse), Smart-seq2, GSE115746 in the GEO database.
Data set 10: (brain, mouse), Drop-seq, GSE93374 in the GEO database.
Data set 11: (brain, mouse), Smart-seq2 (https://figshare.com/articles/dataset/Single-cell_RNA-seq_data_from_Smart-seq2_sequencing_of_FACS_sorted_cells_v2_/5829687/7).
Data sets 12–13: (brain, lizard, turtle), Drop-seq (https://brain.mpg.de/research/laurent-department/software-techniques.html).
Data set 14: (kidney, mouse), Drop-seq, GSE94333 in the GEO database.
Data set 15: (kidney, mouse), Drop-seq, GSE111107 in the GEO database.
Data set 16: (kidney, mouse), 10x, GSE107585 in the GEO database.
Data set 17: (kidney, mouse), 10x (https://figshare.com/articles/dataset/Single-cell_RNA-seq_data_from_microfluidic_emulsion_v2_/5968960/2).
Data set 18: (kidney, human), 10x snRNA-seq, GSE118184 in the GEO database.
Data set 19: (kidney, human), 10x, EGAS00001002171, EGAS00001002486, EGAS00001002325, and EGAS00001002553 in European Genome-phenome Archive.
Data set 20: (kidney, human), 10x, GSE114530 in the GEO database.
Data set 21: (kidney, human), 10x, GSE109488 in the GEO database.
Data set 22: (retina, human), microfluidics, GSE137847 in the GEO database.
Data set 23: (retina, human), Seq-Well, GSE137847 in the GEO database.
Data set 24: (retina, mouse), Drop-seq, GSE63473 in the GEO database.
Data sets 25-54: (retina, mouse, zebrafish, chick), 10x scRNA-seq, are available at GitHub (https://github.com/jiewwwang/Single-cell-retinal-regeneration).
A detailed summary of the 672 reference-query pairs can be found in Supplemental Table S1.
Pairs of scRNA-seq and scST data sets
We collected 80 pairs of scRNA-seq and scST data sets from GitHub (https://github.com/zhanglabtools/STAMapper/). A human liver cancer data set profiled by NanoString was excluded owing to the absence of manual annotation.
Pairs of scRNA-seq and scATAC-seq data sets
The pairs of scRNA-seq and scATAC-seq data sets are as follows:
Data set 1 (PBMC, human), 10x Multiome (https://support.10xgenomics.com/single-cell-multiome-atac-gex/datasets/1.0.0/pbmc_granulocyte_sorted_10k?).
Data set 2 (BMMC, human), 10x Multiome, GSE194122 in the GEO database.
Data set 3 (cortex, mouse), SHARE-seq, GSE126074 in the GEO database.
Data set 4 (skin, mouse), SHARE-seq, GSE140203 in the GEO database.
Data set 5 (Mop, mouse), The 10x scRNA-seq and scATAC-seq data sets can be accessed from NeMO archive (https://assets.nemoarchive.org/dat-ch1nqb7). We used samples with ids CEMBA171206_3C, CEMBA171207_3C, CEMBA171213_4B, CEMBA180104_4B, CEMBA180409_2C, CEMBA180410_2C, and CEMBA180612_5D, CEMBA180618_5D.
Data set 6 (retina, human), 10x Multiome, GSE196235 in the GEO database.
Data set 7, 8 (normal and AD cortex, human), 10x scRNA-seq and single-nucleus ATAC-seq (snATAC-seq), GSE174367 in the GEO database.
Data set 9 (kidney, human), 10x snRNA-seq and scATAC-seq, GSE151302 in the GEO database.
Software availability
CAMUS is implemented in Python and is available at GitHub (https://github.com/zhanglabtools/CAMUS) and as Supplemental Code.
Competing interest statement
The authors declare no competing interests.
Acknowledgments
This work has been supported by the National Key Research and Development Program of China (no. 2021YFC2701601 to S.Q.Z.), the Science and Technology Commission of Shanghai Municipality (no. 23JC1401000 to S.Q.Z.), the National Natural Science Foundation of China (nos. 32341013, 12326614 to S.Z., and 12471350 to S.Q.Z.), the R&D project of Pazhou Laboratory (Huangpu; no. 2023K0602 to S.Z.), and the CAS Project for Young Scientists in Basic Research (no. YSBR-034 to S.Z.).
Author contributions: S.Z. conceived and supervised the project. Q.S. designed and implemented the CAMUS algorithm. Q.S. validated the study. Q.S., S.Q.Z., and S.Z. wrote the manuscript. All authors read and approved the final manuscript.
Notes
[1] Supplementary material [Supplemental material is available for this article.]
[2] Article published online before print. Article, supplemental material, and publication date are at https://www.genome.org/cgi/doi/10.1101/gr.280821.125.
References
- ↵Biancalani T, Scalia G, Buffoni L, Avasthi R, Lu Z, Sanger A, Tokcan N, Vanderburg CR, Segerstolpe Å, Zhang M, 2021. Deep learning and alignment of spatially resolved single-cell transcriptomes with Tangram. Nat Methods 18: 1352–1362. 10.1038/s41592-021-01264-7
- ↵Brbić M, Cao K, Hickey JW, Tan Y, Snyder MP, Nolan GP, Leskovec J. 2022. Annotation of spatially resolved single-cell data with STELLAR. Nat Methods 19: 1411–1418. 10.1038/s41592-022-01651-8
- ↵Cable DM, Murray E, Zou LS, Goeva A, Macosko EZ, Chen F, Irizarry RA. 2022. Robust decomposition of cell type mixtures in spatial transcriptomics. Nat Biotechnol 40: 517–526. 10.1038/s41587-021-00830-w
- ↵Cao Z-J, Gao G. 2022. Multi-omics single-cell data integration and regulatory inference with graph-linked embedding. Nat Biotechnol 40: 1458–1466. 10.1038/s41587-022-01284-4
- ↵Chen S, Lake BB, Zhang K. 2019. High-throughput sequencing of the transcriptome and chromatin accessibility in the same cell. Nat Biotechnol 37: 1452–1457. 10.1038/s41587-019-0290-0
- ↵Choi J, Li J, Ferdous S, Liang Q, Moffitt JR, Chen R. 2023. Spatial organization of the mouse retina at single cell resolution by MERFISH. Nat Commun 14: 4929. 10.1038/s41467-023-40674-3
- ↵Clarke ZA, Andrews TS, Atif J, Pouyabahar D, Innes BT, MacParland SA, Bader GD. 2021. Tutorial: guidelines for annotating single-cell transcriptomic maps using automated and manual methods. Nat Protoc 16: 2749–2764. 10.1038/s41596-021-00534-0
- ↵Codeluppi S, Borm LE, Zeisel A, La Manno G, van Lunteren JA, Svensson CI, Linnarsson S. 2018. Spatial organization of the somatosensory cortex revealed by osmFISH. Nat Methods 15: 932–935. 10.1038/s41592-018-0175-z
- ↵Dimitrov D, Türei D, Garrido-Rodriguez M, Burmedi PL, Nagai JS, Boys C, Ramirez Flores RO, Kim H, Szalai B, Costa IG, 2022. Comparison of methods and resources for cell-cell communication inference from single-cell RNA-seq data. Nat Commun 13: 3224. 10.1038/s41467-022-30755-0
- ↵Eng C-HL, Lawson M, Zhu Q, Dries R, Koulena N, Takei Y, Yun J, Cronin C, Karp C, Yuan G-C, 2019. Transcriptome-scale super-resolved imaging in tissues by RNA seqFISH+. Nature 568: 235–239. 10.1038/s41586-019-1049-y
- ↵Erickson N, Mueller J, Shirkov A, Zhang H, Larroy P, Li M, Smola A. 2020. AutoGluon-Tabular: robust and accurate AutoML for structured data. arXiv:2003.06505 [stat.ML]. 10.48550/arXiv.2003.06505
- ↵Fan Z, Chen R, Chen X. 2020. SpatialDB: a database for spatially resolved transcriptomes. Nucleic Acids Res 48: D233–D237. 10.1093/nar/gkz934
- ↵Fang R, Preissl S, Li Y, Hou X, Lucero J, Wang X, Motamedi A, Shiau AK, Zhou X, Xie F, 2021. Comprehensive analysis of single cell ATAC-seq data with SnapATAC. Nat Commun 12: 1337. 10.1038/s41467-021-21583-9
- ↵Franzén O, Gan L-M, Björkegren JL. 2019. PanglaoDB: a web server for exploration of mouse and human single-cell RNA sequencing data. Database 2019: baz046. 10.1093/database/baz046
- ↵Garmire LX, Li Y, Huang Q, Xu C, Teichmann SA, Kaminski N, Pellegrini M, Nguyen Q, Teschendorff AE. 2024. Challenges and perspectives in computational deconvolution of genomics data. Nat Methods 21: 391–400. 10.1038/s41592-023-02166-6
- ↵Hao Y, Stuart T, Kowalski MH, Choudhary S, Hoffman P, Hartman A, Srivastava A, Molla G, Madad S, Fernandez-Granda C, 2024. Dictionary learning for integrative, multimodal and scalable single-cell analysis. Nat Biotechnol 42: 293–304. 10.1038/s41587-023-01767-y
- ↵Hoang T, Wang J, Boyd P, Wang F, Santiago C, Jiang L, Yoo S, Lahne M, Todd LJ, Jia M, 2020. Gene regulatory networks controlling vertebrate retinal regeneration. Science 370: eabb8598. 10.1126/science.abb8598
- ↵Jia G, Preussner J, Chen X, Guenther S, Yuan X, Yekelchyk M, Kuenne C, Looso M, Zhou Y, Teichmann S, 2018. Single cell RNA-seq and ATAC-seq analysis of cardiac progenitor cell transition states and lineage settlement. Nat Commun 9: 4877. 10.1038/s41467-018-07307-6
- ↵Kharchenko PV. 2021. The triumphs and limitations of computational methods for scRNA-seq. Nat Methods 18: 723–732. 10.1038/s41592-021-01171-x
- ↵Kiselev VY, Yiu A, Hemberg M. 2018. scmap: projection of single-cell RNA-seq data across data sets. Nat Methods 15: 359–362. 10.1038/nmeth.4644
- ↵Li C, Liu B, Kang B, Liu Z, Liu Y, Chen C, Ren X, Zhang Z. 2020. SciBet as a portable and fast single cell type identifier. Nat Commun 11: 1818. 10.1038/s41467-020-15523-2
- ↵Lin Y, Wu T-Y, Wan S, Yang JY, Wong WH, Wang YR. 2022. scJoint integrates atlas-scale single-cell RNA-seq and ATAC-seq data with transfer learning. Nat Biotechnol 40: 703–710. 10.1038/s41587-021-01161-6
- ↵Liu J, Tran V, Vemuri VNP, Byrne A, Borja M, Kim YJ, Agarwal S, Wang R, Awayan K, Murti A. 2023a. Concordance of MERFISH spatial transcriptomics with bulk and single-cell RNA sequencing. Life Sci Alliance 6: e202201701. 10.26508/lsa.202201701
- ↵Liu X, Shen Q, Zhang S. 2023b. Cross-species cell-type assignment from single-cell RNA-seq data by a heterogeneous graph neural network. Genome Res 33: 96–111. 10.1101/gr.276868.122
- ↵Lohoff T, Ghazanfar S, Missarova A, Koulena N, Pierson N, Griffiths JA, Bardot ES, Eng C-H, Tyser RC, Argelaguet R, 2022. Integration of spatial and single-cell transcriptomic data elucidates mouse organogenesis. Nat Biotechnol 40: 74–85. 10.1038/s41587-021-01006-2
- ↵Longo SK, Guo MG, Ji AL, Khavari PA. 2021. Integrating single-cell and spatial transcriptomics to elucidate intercellular tissue dynamics. Nat Rev Genet 22: 627–644. 10.1038/s41576-021-00370-8
- ↵Luecken MD, Burkhardt DB, Cannoodt R, Lance C, Agrawal A, Aliee H, Chen AT, Deconinck L, Detweiler AM, Granados AA, 2021. A sandbox for prediction and integration of DNA, RNA, and proteins in single cells. In Thirty-fifth Conference on Neural Information Processing Systems Datasets and Benchmarks Track (Round 2). Neural Information Processing Systems Foundation (NeurIPS) (virtual conference).
- ↵Ma S, Zhang B, LaFave LM, Earl AS, Chiang Z, Hu Y, Ding J, Brack A, Kartha VK, Tay T, 2020. Chromatin potential identified by shared single-cell profiling of RNA and chromatin. Cell 183: 1103–1116.e20. 10.1016/j.cell.2020.09.056
- ↵Macosko EZ, Basu A, Satija R, Nemesh J, Shekhar K, Goldman M, Tirosh I, Bialas AR, Kamitaki N, Martersteck EM, 2015. Highly parallel genome-wide expression profiling of individual cells using nanoliter droplets. Cell 161: 1202–1214. 10.1016/j.cell.2015.05.002
- ↵Moffitt JR, Bambah-Mukku D, Eichhorn SW, Vaughn E, Shekhar K, Perez JD, Rubinstein ND, Hao J, Regev A, Dulac C, 2018. Molecular, spatial, and functional single-cell profiling of the hypothalamic preoptic region. Science 362: eaau5324. 10.1126/science.aau5324
- ↵Morabito S, Miyoshi E, Michael N, Shahin S, Martini AC, Head E, Silva J, Leavy K, Perez-Rosendahl M, Swarup V. 2021. Single-nucleus chromatin accessibility and transcriptomic characterization of Alzheimer's disease. Nat Genet 53: 1143–1155. 10.1038/s41588-021-00894-z
- ↵Muto Y, Wilson PC, Ledru N, Wu H, Dimke H, Waikar SS, Humphreys BD. 2021. Single cell transcriptional and chromatin accessibility profiling redefine cellular heterogeneity in the adult human kidney. Nat Commun 12: 2190. 10.1038/s41467-021-22368-w
- ↵Pedregosa F, Varoquaux G, Gramfort A, Michel V, Thirion B, Grisel O, Blondel M, Prettenhofer P, Weiss R, Dubourg V, 2011. Scikit-learn: machine learning in Python. J Mach Learn Res 12: 2825–2830.
- ↵R Core Team. 2025. R: a language and environment for statistical computing. R Foundation for Statistical Computing, Vienna. https://www.R-project.org/.
- ↵Russell AJ, Weir JA, Nadaf NM, Shabet M, Kumar V, Kambhampati S, Raichur R, Marrero GJ, Liu S, Balderrama KS, 2024. Slide-tags enables single-nucleus barcoding for multimodal spatial genomics. Nature 625: 101–109. 10.1038/s41586-023-06837-4
- ↵Shah S, Lubeck E, Zhou W, Cai L. 2017. seqFISH accurately detects transcripts in single cells and reveals robust spatial organization in the hippocampus. Neuron 94: 752–758.e1. 10.1016/j.neuron.2017.05.008
- ↵Shah S, Takei Y, Zhou W, Lubeck E, Yun J, Eng C-HL, Koulena N, Cronin C, Karp C, Liaw EJ, 2018. Dynamics and spatial genomics of the nascent transcriptome by intron seqFISH. Cell 174: 363–376.e16. 10.1016/j.cell.2018.05.035
- ↵Shen Q, Dong K, Zhang S, Zhang S. 2025. High-precision cell-type mapping and annotation of single-cell spatial transcriptomics with STAMapper. Genome Biol 26: 342. 10.1186/s13059-025-03773-6
- ↵Srivatsan SR, Regier MC, Barkan E, Franks JM, Packer JS, Grosjean P, Duran M, Saxton S, Ladd JJ, Spielmann M, 2021. Embryo-scale, single-cell spatial transcriptomics. Science 373: 111–117. 10.1126/science.abb9536
- ↵Tan Y, Cahan P. 2019. SingleCellNet: a computational tool to classify single cell RNA-Seq data across platforms and across species. Cell Syst 9: 207–213.e2. 10.1016/j.cels.2019.06.004
- ↵Traag VA, Waltman L, Van Eck NJ. 2019. From Louvain to Leiden: guaranteeing well-connected communities. Sci Rep 9: 5233. 10.1038/s41598-019-41695-z
- ↵Vinh NX, Epps J, Bailey J. 2009. Information theoretic measures for clusterings comparison: is a correction for chance necessary? In Proceedings of the 26th Annual International Conference on Machine Learning, Montreal, pp. 1073–1080. Association for Computing Machinery, New York.
- ↵Wang X, Allen WE, Wright MA, Sylwestrak EL, Samusik N, Vesuna S, Evans K, Liu C, Ramakrishnan C, Liu J, 2018. Three-dimensional intact-tissue sequencing of single-cell transcriptional states. Science 361: eaat5691. 10.1126/science.aat5691
- ↵Wang SK, Nair S, Li R, Kraft K, Pampari A, Patel A, Kang JB, Luong C, Kundaje A, Chang HY. 2022. Single-cell multiome of the human retina and deep learning nominate causal variants in complex eye diseases. Cell Genomics 2: 100164. 10.1016/j.xgen.2022.100164
- ↵Wolf FA, Angerer P, Theis FJ. 2018. SCANPY: large-scale single-cell gene expression data analysis. Genome Biol 19: 15. 10.1186/s13059-017-1382-0
- ↵Xu C, Lopez R, Mehlman E, Regier J, Jordan MI, Yosef N. 2021. Probabilistic harmonization and annotation of single-cell transcriptomics data with deep generative models. Mol Syst Biol 17: e9620. 10.15252/msb.20209620
- ↵Yao Z, Liu H, Xie F, Fischer S, Adkins RS, Aldridge AI, Ament SA, Bartlett A, Behrens MM, Van den Berge K, 2021. A transcriptomic and epigenomic cell atlas of the mouse primary motor cortex. Nature 598: 103–110. 10.1038/s41586-021-03500-8
- ↵Zeng H, Huang J, Zhou H, Meilandt WJ, Dejanovic B, Zhou Y, Bohlen CJ, Lee S-H, Ren J, Liu A, 2023. Integrative in situ mapping of single-cell transcriptional states and tissue histopathology in a mouse model of Alzheimer's disease. Nat Neurosci 26: 430–446. 10.1038/s41593-022-01251-x
- ↵Zhang M, Eichhorn SW, Zingg B, Yao Z, Cotter K, Zeng H, Dong H, Zhuang X. 2021. Spatially resolved cell atlas of the mouse primary motor cortex by MERFISH. Nature 598: 137–143. 10.1038/s41586-021-03705-x
- ↵Zhang Z, Yang C, Zhang X. 2022. scDART: integrating unmatched scRNA-seq and scATAC-seq data and learning cross-modality relationship simultaneously. Genome Biol 23: 139. 10.1186/s13059-022-02706-x
- ↵Zhang K, Zemke NR, Armand EJ, Ren B. 2024. A fast, scalable and versatile tool for analysis of single-cell omics data. Nat Methods 21: 217–227. 10.1038/s41592-023-02139-9