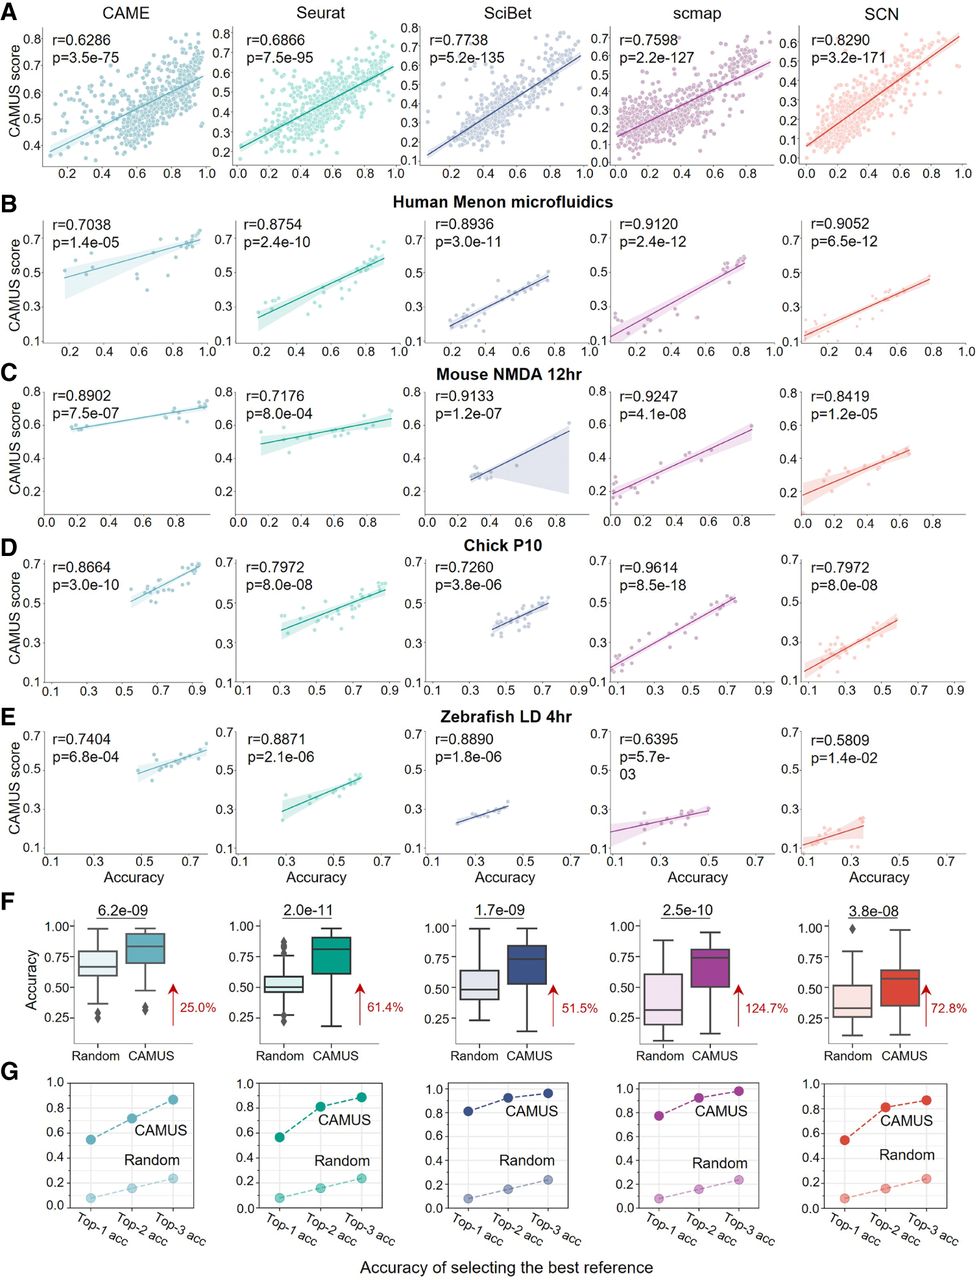
Application of CAMUS for reference selection in cross-species cell type annotation. (A–E) Scatter plot showing the significant positive correlation between the CAMUS score and annotation accuracy in all cross-species data pairs (n = 672; A), and specific query data sets from humans, mice, chicks, and zebrafish (B–E) for five cell annotation methods: CAME, Seurat, SciBet, scmap, and SCN. (F) Box plot indicating the accuracy of cell type annotation. The references are selected by CAMUS or randomly. For the random selection, we performed five independent replicates for each setting and report the average values. The P-value was calculated using the paired t-test. The data following the red arrow represent the percentage improvement for the median value relative to random selection. (G) Dot plot showing the top-one, top-two, and top-three accuracies of selecting the best reference by CAMUS or randomly.