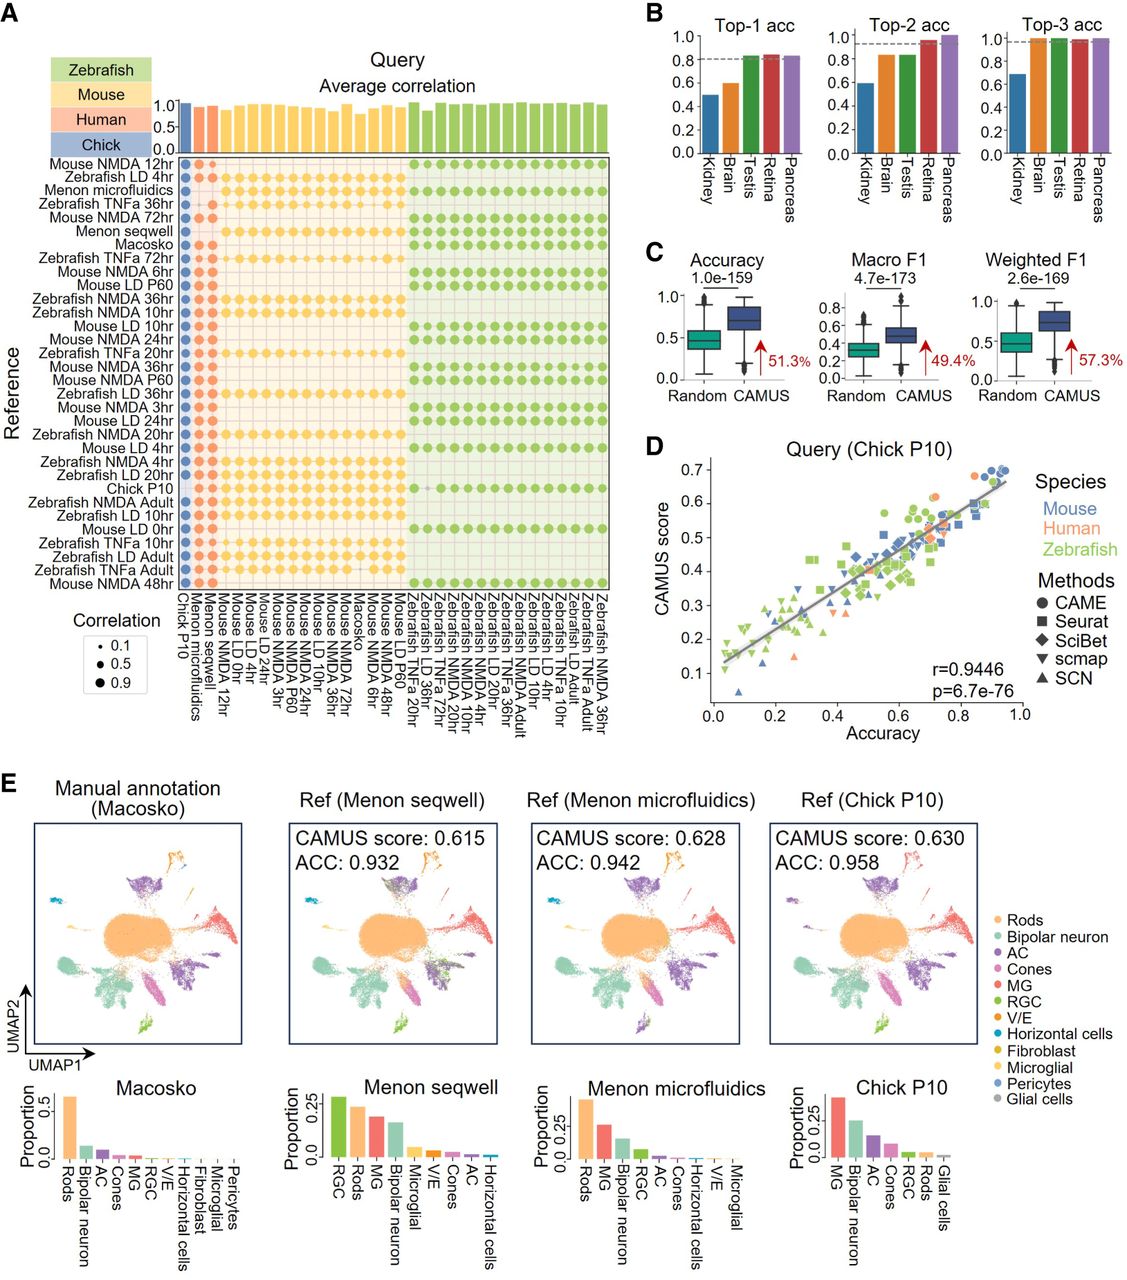
Application of CAMUS for method selection in 672 pairs of cross-species cell type annotations. (A) Dot plot showing the correlation between the accuracy of five cell annotation methods (i.e., CAME, Seurat, SciBet, scmap, and SCN) and the corresponding CAMUS score for retina data collected from zebrafishes, mice, humans, and chicks. For each dot, color represents a positive correlation, and gray represents a negative correlation. Each cross-species pair has corresponding reference–query combinations, whereas same-species pairs do not. (B) Bar plot showing the top-one, top-two, and top-three accuracies of selecting the best methods by CAMUS or randomly. (C) Box plot indicating the accuracy, macro F1 score, and weighted F1 score of cell type annotation for methods selected by CAMUS or randomly. The data following the red arrow represent the percentage improvement for the median value relative to random selection. (D) Pearson correlation between the CAMUS score and cell type annotation accuracy, in which each point represents a reference–method pair. (E) UMAP plots of mouse retina cells from the Macosko data set; cells are colored according to the manual annotation, and the annotations of CAME using the Menon Seqwell, Menon microfluidics, and Chick P10 as references (top panels). Here, ACC refers to accuracy. Bar plots showing the cell ratio of the corresponding data set (bottom panels).