
Abstract
Tandemly repeated satellite DNAs (satDNAs) are among the most abundant and fastest-evolving eukaryotic sequences, but the way they model genomes is still elusive. Here, we investigate the evolutionary dynamics of satDNAs in the extremely satDNA-rich genomes of two closely related Tribolium insects that produce sterile hybrids. In Tribolium freemani, we identify 135 satDNAs, accounting for 38.7% of the genome. Comparative analysis with the Tribolium castaneum satellitome reveals that the drastic difference occurs in their centromeric regions, which share orthologous organization characterized by totally different major satDNAs but related minor satDNAs. The T. freemani male sex chromosome, which lacks the major satDNA but contains a minor-like satDNA, further highlights the question of which satDNA is centromere-competent. By analyzing the long-range organization of the centromeric regions, we discover that both the major and minor satDNA arrays exhibit a strong tendency toward macro-dyad symmetry, suggesting that the secondary structures in the centromeres may be more important than the primary sequence itself. We find evidence that the centromeric satDNAs of T. freemani occur in extrachromosomal circular DNAs, which may contribute to their expansion and homogenization between nonhomologous chromosomes. We also identify numerous low-copy-number satDNAs that are orthologous between the siblings, some of which are associated with transposable elements, highlighting transposition as a mechanism of their spreading. The dynamic evolution of satDNAs has clearly influenced the differentiation of Tribolium genomes, but the question remains whether the differences in their satDNA profiles are a cause or consequence of speciation.
Satellite DNAs (satDNAs) are highly repetitive, tandemly organized DNA sequences whose contiguous arrays make up extensive regions in many eukaryotic genomes. The repetitive organization has hampered their study in the past and made them the most challenging regions to assemble in sequenced genomes. They were initially considered “junk DNA” due to their abundance and unclear function, but the accumulation of studies on numerous species began to change their unfavorable reputation over time. Because they frequently form heterochromatin blocks in the (peri)centromeric regions of many organisms, their most recognized role is attributed to the organization of functional centromeres (Hartley and O'Neill 2019; Talbert and Henikoff 2022), associated with proper chromosome segregation and genome stability (Flynn and Yamashita 2024). However, no satDNA function has been universally demonstrated across species.
satDNAs are among the most rapidly evolving eukaryotic sequences and can differ significantly in nucleotide sequence and copy number of their repeats even between related species. The main theories explaining the evolution of satDNAs were proposed at a time when, due to methodological limitations, only the most abundant satellites were discovered in genomes. In line with concerted evolution, greater sequence similarity of repeats of a given satDNA is found within species than between species (Elder and Turner 1995). In some cases, large differences between various satDNAs that cannot be explained by gradual degradation of the nucleotide sequence are explained by the satDNA library theory. The library theory implies a satellite collection of different satDNAs present in an ancestral genome, from which certain satDNAs significantly change the number of repeats by amplification or reduction, leading to different satellite profiles in descendant species (Fry and Salser 1977; Meštrović et al. 1998). Modern sequencing technologies and accompanying bioinformatics tools have improved the detectability of satDNAs, disclosing often more than one hundred satDNAs in different organisms (Boštjančić et al. 2021; João Da Silva et al. 2023). Consequently, high-throughput satellitome analyses broaden understanding of satDNA evolution and encourage the revision of previous evolutionary concepts (Belyayev et al. 2020). For these purposes, comparative analyses of related species are very informative (Camacho et al. 2022), whereby organisms with a high proportion of satDNAs are particularly useful.
The flour beetle Tribolium freemani belongs to the genus that includes some of the most important pests of stored agricultural products (Sokoloff 1972). The economically important Tribolium species are also an excellent platform for the study of satellite DNAs, which occupy up to 60% of their genomes (Mravinac and Plohl 2010). The representative of the genus, but also of the entire order Coleoptera, is Tribolium castaneum. It was the first beetle whose genome was sequenced in 2008 (Richards et al. 2008). The assembly has been refined and improved in the meantime (Herndon et al. 2020), with the latest assembly version TcasONT being substantially enhanced in the repetitive regions (Volarić et al. 2024). The satDNA studies have revealed that the T. castaneum genome contains at least 57 different satellites (Ugarković et al. 1996b; Feliciello et al. 2015; Pavlek et al. 2015; Gržan et al. 2023), of which the major satellite TCAST comprises 17% of the genome. The closest congener to T. castaneum is T. freemani. The two species are so closely related that they can hybridize but produce sterile offspring (Nakakita et al. 1981). We recently sequenced and assembled the T. freemani genome and found that the two siblings are very similar in their coding sequence (Volarić et al. 2022). Regarding satDNAs, it was discovered three decades ago that 31% of the T. freemani genome consists of one satDNA (Juan et al. 1993), whose sequence shows absolutely no similarity to the major satellite of T. castaneum. However, in both species, the major satellites, although clearly different in sequence, occupy the (peri)centromeric regions (Juan et al. 1993; Ugarković et al. 1996b; Gržan et al. 2020).
Understanding the evolutionary dynamics by which satDNAs mold genomes is necessary for the perception of genome versatility, and it may also be an essential step in unraveling the role of these functionally controversial sequences. Considering the extremely variable nature of satDNAs and the fact that T. freemani and T. castaneum produce infertile hybrid progeny, in this work we aim to investigate how compatible the two siblings are in their satellite profiles. Based on this comparison, we also draw conclusions about the genomic architecture, evolutionary dynamics, and the main molecular mechanisms that most significantly differentiated their satellitomes.
Results
Identification of T. freemani satDNAs
The first step was to characterize the T. freemani satellitome. For assembly-independent identification of satDNAs, we resequenced its genome using Illumina sequencing. The Illumina reads were processed by the TAREAN pipeline, which predicted satDNA candidates from short reads via graph-based clustering (Supplemental Table S1). The TAREAN-predicted sequences were mapped to the T. freemani reference genome assembly Tfree1.0 (Volarić et al. 2022). The candidate sequences that were mapped in five or more consecutive copies were classified as satDNAs. In this way, we identified 135 satDNAs, one already known from previous studies (Juan et al. 1993) and 134 new ones. We named them TfSat01-135 and listed their consensus sequences in the Supplemental Table S2.
Among the 135 satDNAs, we identified 11 that share partial sequence similarity (56.7%–73.0%), suggesting a related origin, so we grouped them into the four superfamilies, SF1–SF4 (Supplemental Fig. S1; Supplemental Table S3). The 135 satDNAs were also searched against the NCBI GenBank database (https://www.ncbi.nlm.nih.gov/genbank/) to find possible similarities with sequences from other organisms. The only similarity found for some satDNAs was with previously described satellites of the sibling species, T. castaneum (Supplemental Table S3). When compared with repetitive sequences from the Repbase collection, the 75 T. freemani satDNAs showed only segmental similarities with different mobile elements, mainly DNA transposons (Supplemental Table S3).
Analysis of the T. freemani satellitome revealed a biased DNA base composition, with 127 of 135 satDNAs showing an A+T content >60% (Fig. 1A; Supplemental Table S3). Regarding monomer length, the satDNAs range from 63 bp to 1106 bp (Supplemental Table S3) but with an evident preference for lengths between 140 and 180 bp (Fig. 1A). Five satDNAs turned out to be higher-order repeats (HORs), composed of two or three 90- to 188-bp subunits that share 63.0%–82.2% pairwise similarity (Supplemental Fig. S2).
The overview of the T. freemani satellitome comprising 135 satDNAs. (A) The genomic proportions of the three most abundant satDNAs and 132 low-copy-number satDNAs, along with their A+T content and monomer length distribution. The genomic proportions are based on the TAREAN estimates, whereas A+T content and monomer lengths are from individual satDNA data listed in Supplemental Table S3. (B) The presence of satDNA arrays with five or more consecutive copies mapped on the 10 T. freemani chromosomes, fLG2-fLGX, in the Tfree1.0 genome assembly. The number of annotated copies is color-coded according to the color scale. (C) UpSet plot showing the number of the T. freemani satDNAs with annotated genes, transposable elements (TEs), and/or satDNAs within 10-kb flanking regions, based on data in Supplemental Table S6.
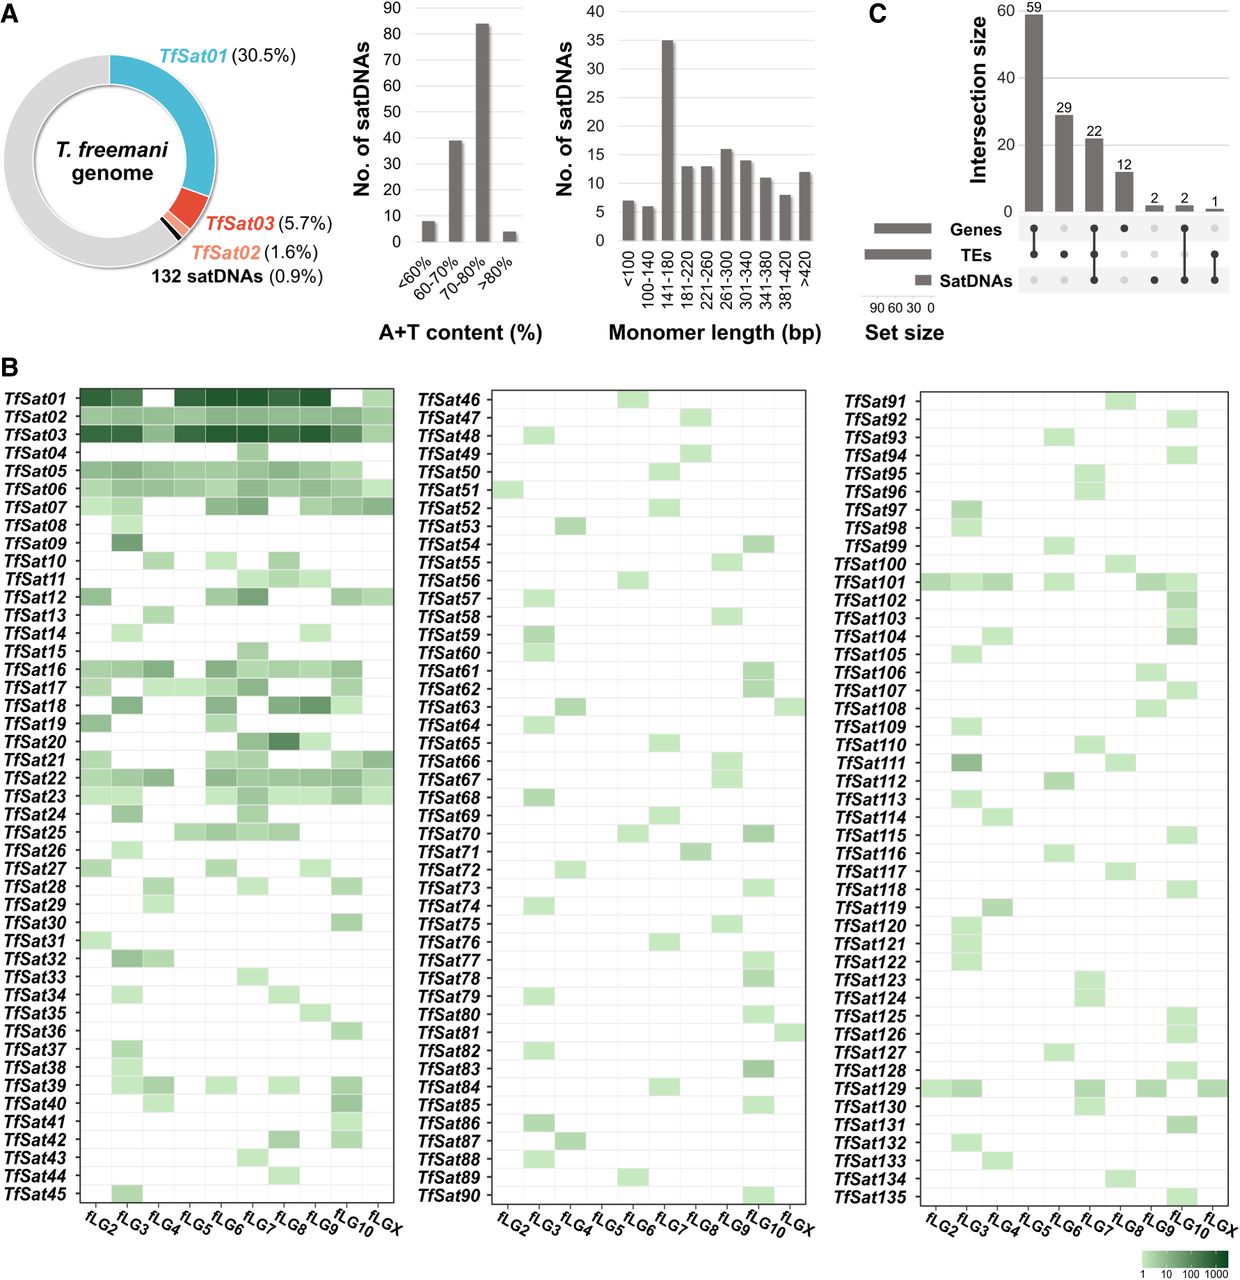
The 135 satDNAs comprise 38.7% of the T. freemani genome (Fig. 1A). The genome is dominated by a single, extremely abundant satDNA TfSat01, which makes up almost one third of the genome sequence. In addition, the two satDNAs, TfSat02 and TfSat03, are moderately represented (1.6% and 5.7%, respectively), whereas the remaining 132 satDNAs together account for only 0.9% of the genome and can be considered low-copy-number satellites (Fig. 1A; Supplemental Table S3).
Regarding the chromosomal distribution, the repeats of the three most abundant satDNAs were detected on almost all chromosomes, whereas the low-copy-number satDNAs showed different distribution patterns (Fig. 1B; Supplemental Fig. S3). The majority of satDNAs (101) were assigned to only one chromosome in the Tfree1.0 assembly, whereas fewer were mapped to multiple chromosomes (Fig. 1B). To verify the chromosomal distribution of the low-copy-number satellites obtained in silico, we experimentally analyzed six of them with a genome proportion between 0.01% and 0.05%. We found that satDNAs with a genome proportion higher than 0.02% had a broader chromosomal distribution (Supplemental Fig. S3A–C), whereas satDNAs with a lower genome proportion (<0.02%) revealed a distinct signal only on one chromosome pair (Supplemental Fig. S3D–F), which is generally consistent with the in silico analysis. In terms of monomer repetitiveness, 71 satDNAs were found exclusively in arrays of five or more consecutive repeats, whereas the remaining 64 also appeared in shorter arrays with fewer than five consecutive copies (Supplemental Table S4).
To examine whether the arrays of the T. freemani satDNAs are preferentially surrounded by a specific type of sequences, we analyzed their 10-kb flanking regions for the presence of other satDNAs, transposable elements (TEs), and genes annotated in the Tfree1.0 assembly. We found that 111 satDNAs have TEs, 95 have genes, and only 27 of them have other satellite sequences in their 10-kb vicinity (Fig. 1C; Supplemental Tables S5 and S6; Supplemental Fig. S4). TEs and genes are most frequently co-occurring (Fig. 1C), but similar average distances (4–5 kb) between satDNA arrays and the closest annotated element were observed for all three addressed sequence types (genes, satDNAs, TEs) (Supplemental Table S7).
Having obtained a general overview of the T. freemani satellitome, we next focused on the in-depth analyses of the most prominent satDNAs.
TfSat01, the main constituent of the T. freemani satellitome and centromere
We first reexamined the most abundant satDNA. The 166-bp sequence of TfSat01 matches the major satDNA earlier documented to comprise 31% of the genome (Juan et al. 1993), a finding also supported by our TAREAN analysis. Based on 228,060 repeats annotated in the Tfree1.0 assembly, we generated a refined consensus that differs by 5.4% from the older GenBank entry X58539 (Supplemental Fig. S5A). As detailed in the Methods, we consider that our consensus TfSat01 represents the major satellite more accurately, and we used it in all downstream analyses.
The major satDNA was previously reported to be located in centromeric regions (Juan et al. 1993). T. freemani has a typical coleopteran karyotype, 2n = 20, with nine autosome pairs and one pair of sex chromosomes (Shimeld 1989). Females have two Chromosomes X, whereas males carry an X and a small yp in a parachute-like Xyp association. To verify TfSat01 presence on all chromosomes, we performed fluorescence in situ hybridization (FISH) on female and male metaphase spreads (Fig. 2A). We indeed detected TfSat01 on all 20 chromosomes in females. In males, however, TfSat01 signals appeared on 18 autosomes and the X, but not on the male-specific yp, revealing that the sex Chromosome yp lacks the major satDNA TfSat01 (Fig. 2A).
Organization of the major satDNA TfSat01 in the T. freemani genome. (A) FISH localization of TfSat01 on female (2n = 18+XX) and male (2n = 18+Xyp) metaphase chromosomes. The first panels show black and white version of chromosomes to better visualize their contours, especially the male minute Chromosome yp. Chromosomes are DAPI-stained (blue), and TfSat01 signals are shown in red. A white arrow points to the yp Chromosome lacking the TfSat01 signal. Scale bar represents 3 µm. (B) Length distribution of TfSat01 arrays in the Tfree1.0 assembly. The median (11.8 kb) is marked by a solid red line, and the mean (14.8 kb) by a dashed line. (C) Box plot showing TfSat01 array length distribution across T. freemani chromosomes (fLGs). Medians are indicated by black lines within the boxes, and the number of arrays analyzed is shown in parentheses below a chromosome name. (D) Schematic illustrating the long-range organization of the multi-megabase-long regions containing TfSat01 arrays. Within TfSat01 arrays (blue rectangles), TfSat01 monomers (blue triangles) are organized into subarrays (black arrows) that differ in monomer orientation. Thus, the term “TfSat01 array” refers to an uninterrupted array of TfSat01 monomers, regardless of how many subarrays it includes. (E) Organization of inversion segments in which TfSat01 monomers change orientation within TfSat01 arrays. The graph shows the length distribution of the inversion segments from the 1793 TfSat01 arrays, with the six most frequent types indicated. The positions of truncated TfSat01 monomers in the most frequent inversion segments are shown in the schematic alignment. Detailed alignments can be found in Supplemental Figure S7A and Supplemental Data S1.
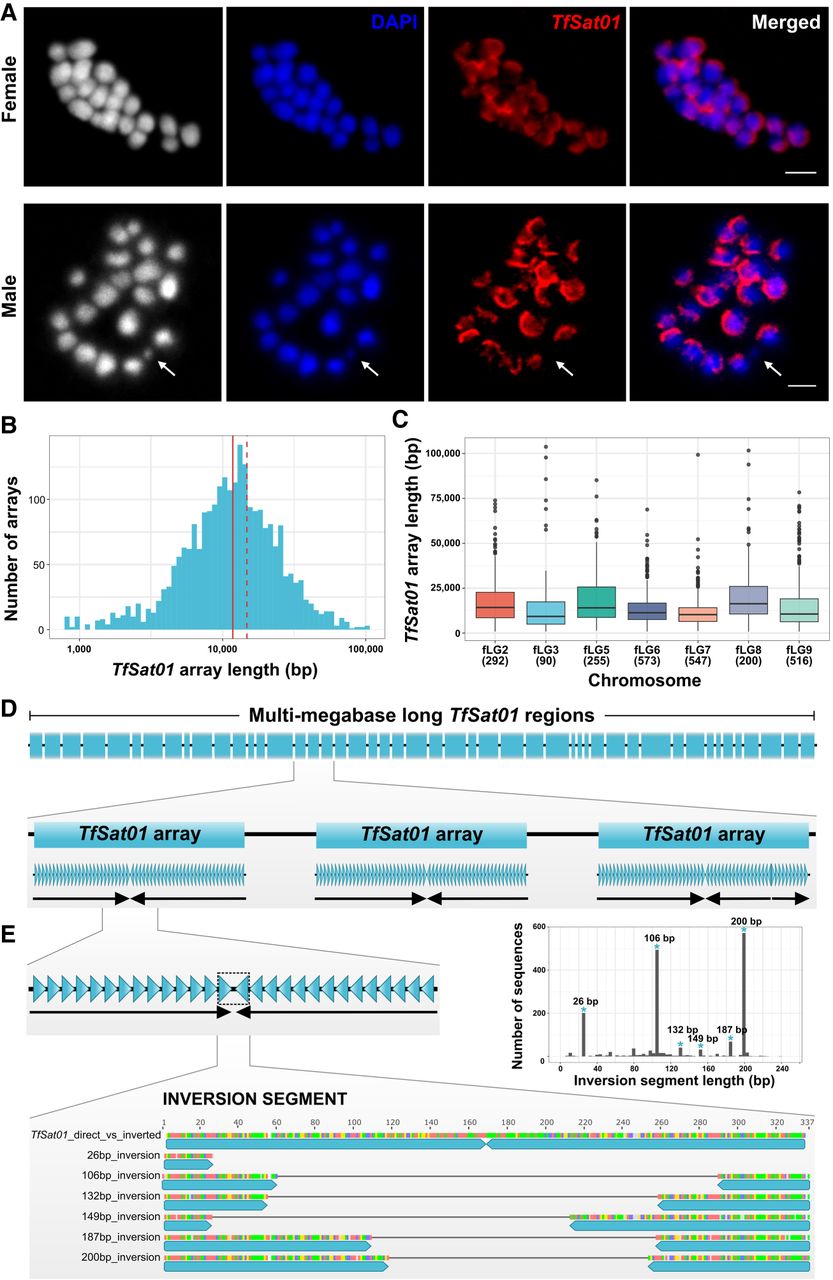
One of the main goals of this work was to uncover the long-range organization of the major satellite. The Tfree1.0 assembly is missing the assembled TfSat01 arrays on Chromosomes fLG4, fLG10, and fLGX, but TfSat01-containing multi-megabase regions are successfully assembled on seven other chromosomes (Volarić et al. 2022). Using the StainedGlass tool, we visualized these regions (Supplemental Fig. S6), spanning from 3.8 to 9.7 Mb (Supplemental Table S8). On average, the uninterrupted TfSat01 arrays within the multi-megabase regions have a median length of 11.8 kb (Fig. 2B). Although the number of mapped TfSat01 arrays varies up to 6.4-fold between different chromosomes, the median length of uninterrupted arrays remains rather consistent, ranging from 9.3 to 16.3 kb (Fig. 2C), suggesting a balanced array length across the genome.
The TfSat01 arrays revealed structural complexity extending beyond simple tandem repetition (Fig. 2D,E). We discovered that TfSat01 arrays typically consist of two or more subarrays that show inverted orientation of TfSat01 repeats (Fig. 2D). Arrays with two inversely oriented subarrays are the most numerous (71.8% of all mapped arrays), whereas, among the remaining arrays, those with an even number of inversely oriented subarrays predominate (Supplemental Table S9). The prevalence of an even number of subarrays suggests a tendency toward dyad symmetry, which could lead to the formation of a hairpin structure. We analyzed 1793 two-subarray arrays and found that the hypothetical hairpins exhibit some degree of asymmetry in their stems due to the varying number of TfSat01 monomers forming inversely oriented subarrays. The lack of perfect symmetry indicates flexibility in the organization of the subarrays.
Intrigued by the presence of dyad symmetries, we analyzed the segments where TfSat01 subarrays reverse orientation (Fig. 2E). The majority of these inversion segments fall into one of six conserved types, defined by specific lengths (26 bp, 106 bp, 132 bp, 149 bp, 187 bp, and 200 bp) (Fig. 2E). Each type consists of an abruptly terminated TfSat01 monomer followed by a reverse-oriented monomer truncated at a different position (Fig. 2E; Supplemental Fig. S7A). Despite different truncation sites, all six inversion types share two features: (1) No extraneous intervening sequences separate truncated TfSat01 copies; and (2) the reverse-oriented truncated copies show no increased sequence variability (Supplemental Fig. S7A). Being reverse complementary, truncated copies extend potential hairpin stems almost to the tip, ending in 9- to 27-bp loops (Supplemental Fig. S7B). Notably, all six inversion types are detected on three to seven chromosomes (Supplemental Table S10), and the sequences of each inversion type are highly conserved (95.0%–99.9%), with 100% identical copies present on nonhomologous chromosomes (Supplemental Data S1). These findings indicate that dyad symmetries within the TfSat01 arrays are a widespread and conserved feature of the T. freemani centromeric regions.
TfSat03 resides in the intercalary segments between TfSat01 arrays
Analysis of TfSat01 long-range organization revealed that TfSat01 arrays are separated by ∼4-kb intercalary segments (Fig. 3A,B), which predominantly harbor TfSat03, the second most abundant satDNA (Fig. 1A). We found that these intercalary segments are structured as “cassettes” (Fig. 3A), composed of: (1) a variable number of highly conserved TfSat03 copies, typically between 5 and 8 (Fig. 3C); (2) degenerate TfSat03 repeats that are truncated and/or show <80% similarity to the consensus; and (3) symmetrically arranged 200- to 300-bp outward-facing stretches abundant in (AAT)n microsatellite (Fig. 3A). It is noteworthy that these components together also form dyad symmetry within the intercalary segments (Fig. 3A).
Organization and relationships between TfSat03 and TfSat04 satDNAs. (A) Schematic representation of the intercalary segments between TfSat01 arrays, containing conserved and degenerate TfSat03 repeats and (AAT)n microsatellite arrays. The yellow rectangle marks the central region where degenerate TfSat03 copies change orientation. (B) Length distribution of intercalary segments containing TfSat03 repeats. (C) The number of conserved TfSat03 repeats per segment in the analyzed intercalary segments. (D) FISH colocalization of TfSat01 (green) and TfSat03 (red) on male metaphase chromosomes stained in DAPI (blue). An arrow points to the yp Chromosome lacking TfSat01 and TfSat03 signals. The bar represents 3 µm. (E) Schematic showing structural differences and pairwise similarities between the TfSat04 monomer and the three subunits of TfSat03. (F) PCA clustering of 159 TfSat04 monomer copies and TfSat03 subunits A, B, and C extracted from 300 randomly selected TfSat03 repeats. The monomers and subunits are represented by color-coded dots. (G) FISH colocalization of TfSat03 (red) and TfSat04 (green) satDNAs on male metaphase chromosomes stained in DAPI (blue). The arrow indicates the yp Chromosome, which lacks TfSat03 but shows a TfSat04 signal exclusive to this chromosome. The bar represents 3 µm.
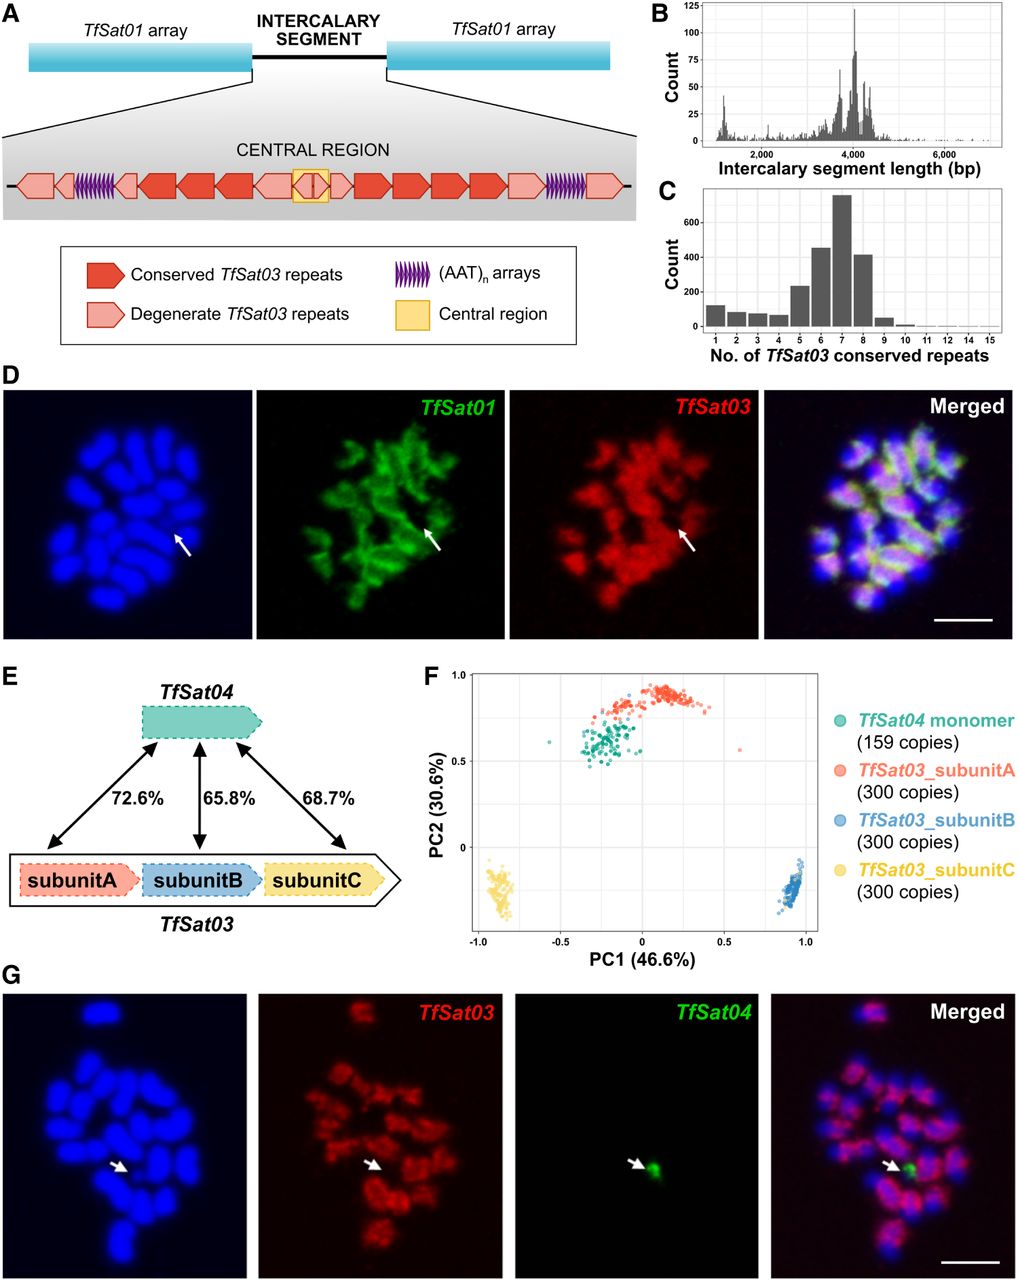
At the core of the “cassette,” in the midpoint of dyad symmetry, lies a ∼110-bp central region (yellow rectangle in Fig. 3A), where degenerate TfSat03 repeats change orientation, potentially forming a 13-bp loop (Supplemental Fig. S8). The sequence of the central region is so degenerate that the partial similarity to TfSat03 is barely recognizable, but the central region itself is highly conserved across intercalary segments throughout the genome, showing an average pairwise identity of 97.1% (Supplemental Data S2). By undirected graph networks, we visualized relationships between central regions of 1577 intercalary segments (Supplemental Fig. S9; Supplemental Data S3). Whereas some small chromosome-specific clusters were observed, the largest cluster with more than 200 completely identical sequences included intercalary segments from multiple chromosomes (Supplemental Fig. S9). This suggests that the ∼4-kb dyad symmetries of TfSat03-based intercalary segments, along with their preserved central region, are a recurring pattern. In other words, we discovered that the centromeric regions of T. freemani are composed of alternating arrays of TfSat01 and TfSat03 satDNAs, with the arrays of both satellites exhibiting a strong tendency towards macro-dyad symmetries.
To further corroborate the relationship between these two satDNAs in situ, we performed two-color FISH. FISH confirmed colocalization of TfSat01 and TfSat03 in broad regions of 19 T. freemani chromosomes in males (Fig. 3D). Smaller regions showing signals from only one satellite likely correspond to loci where that satellite forms longer uninterrupted arrays. Notably, neither TfSat01 nor TfSat03 signals were detected on the yp (Fig. 3D, marked by an arrow). The fact that the yp Chromosome lacks the two most abundant and widespread T. freemani satDNAs raises the question of the yp satellite profile.
TfSat04, the male sex chromosome-specific satDNA
TfSat03 belongs to the SF1 superfamily, which also includes satellite TfSat04 (Supplemental Table S3), so we next addressed the relationship between the two satDNAs. Unlike TfSat03, TfSat04 is a low-copy-number satellite that comprises only 0.07% of the genome. Beyond the 80-fold difference in genome abundance, the two satDNAs differ in the structure of their repeat units (Fig. 3E). TfSat03 is a 340-bp HOR whose three subunits, A, B, and C, are 113 to 114 bp long and share pairwise similarities of 65.8%–73.0% (Supplemental Fig. S2A), whereas TfSat04 is a 112-bp repeat that corresponds to TfSat03 subunits, sharing 65.8%–72.6% similarity with them (Fig. 3E; Supplemental Fig. S1A). The principal component analysis (PCA) of all 159 TfSat04 monomers mapped in the Tfree1.0 assembly and 300 randomly subsampled TfSat03 subunits separated the sequences into four distinct clusters, reflecting their provenance (Fig. 3F). According to the PCA, TfSat04 monomers are most closely related to TfSat03_subunitA.
We performed FISH to localize TfSat04 on chromosome spreads. Because the Tfree1.0 assembly contains only a single continuous TfSat04 array annotated on Chromosome fLG7, we expected FISH to detect it on one chromosome. Indeed, only one TfSat04 signal was obtained; however, it was unexpectedly located on the yp Chromosome. Two-color FISH confirmed that TfSat03 and TfSat04 occupy mutually exclusive positions: TfSat03 localized to 19 chromosomes but not to yp, whereas TfSat04 was exclusively present on yp (Fig. 3G). FISH on female chromosome spreads, where no TfSat04 signal was detected, confirmed that TfSat04 is specific to the male sex chromosome. The chromosomal localization of TfSat04 thus additionally underscored the diversification that the precursor sequence of the SF1 superfamily has undergone through the formation of TfSat03 and TfSat04 satellites.
The detection of TfSat04 on yp prompted us, as the authors of the Tfree1.0 assembly, to reexamine the original contigs. After revision (described in the Methods), we concluded that the TfSat04-containing contig, originally assigned to the end of Chromosome fLG7, belongs to the yp Chromosome. Based on this finding, we will update the assembly to version Tfree1.1, in which the 2.2-Mb end of fLG7 is reassigned as the yp Chromosome.
Orthologous satDNAs between T. freemani and T. castaneum
After addressing the long-range organization of the most prominent satellites, we focused on the evolutionary trends in the T. freemani satellitome. To this end, we included orthologous satDNAs from its sibling T. castaneum in our study.
The origin of the centromeric major satDNAs of the sibling species
Despite their close relationship, T. freemani and T. castaneum possess entirely different major satellites, TfSat01 and TCAST, respectively. TCAST has been formerly characterized as the primary centromeric component in T. castaneum (Ugarković et al. 1996b; Gržan et al. 2020). To better understand the divergence between TfSat01 and TCAST, we investigated their origin.
By analyzing TfSat01 in the Tfree1.0 assembly, we found that 93.3% of annotated copies show >90% similarity to the consensus (Supplemental Fig. S5B), indicating that TfSat01 is a homogeneous satellite. Nevertheless, there was a distinct subset of repeats showing 82% similarity to the consensus (indicated by the black arrow in Supplemental Fig. S5B). It turned out that these less similar copies were not tandemly organized TfSat01 repeats but parts of the 1106-bp repeat units of the satDNA TfSat02 (Fig. 4A; Supplemental Fig. S10). Notably, TfSat02 repeats, which constitute 1.6% of the genome, are located outside the TfSat01 areas, often far from centromeric regions (Fig. 4B). This opened up the question of the evolutionary relationship between TfSat01 and TfSat02, that is, which satDNA preceded the other: (1) Was TfSat01 an ancestral satDNA whose monomeric unit invaded the TfSat02 precursor sequence? or (2) Was a fragment of the TfSat02 sequence excised and amplified into tandem arrays of the present TfSat01?
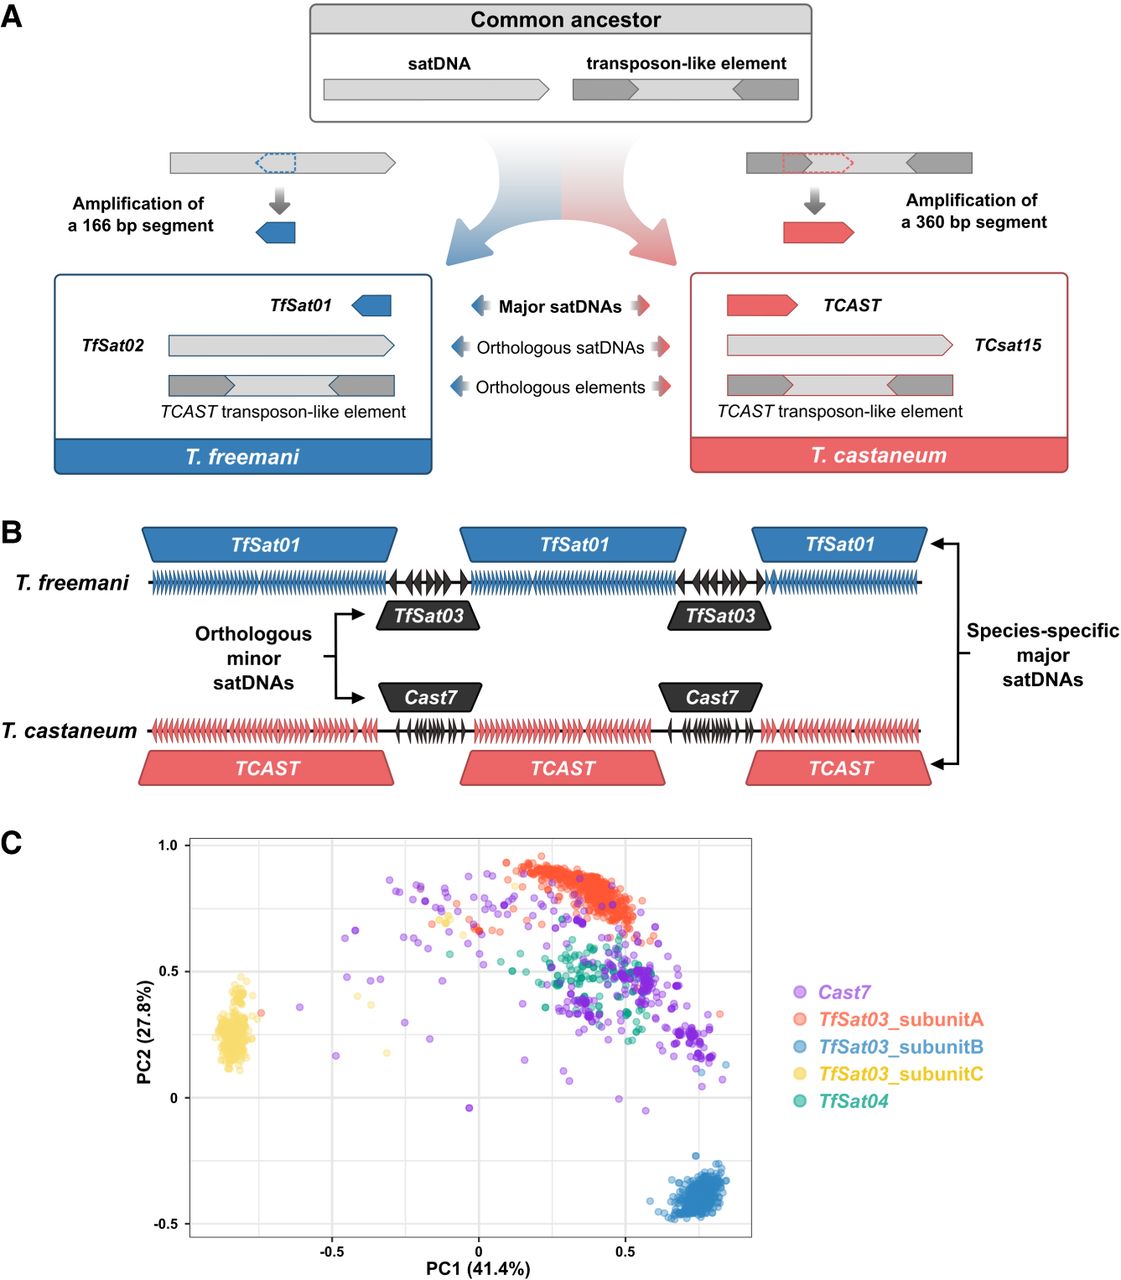
Relationship between the T. freemani satDNAs TfSat01 and TfSat02 and the T. castaneum satDNA TCsat15. (A) Schematic representation of the TfSat01, TfSat02, and TCsat15 repeat units. The blue arrow represents the TfSat01 monomer, and the red and green arrows within the TfSat02 and TCsat15 units, respectively, indicate 166-bp segments homologous to the TfSat01 monomer sequence. The percent sequence similarities are indicated. (B) Genomic distribution of TfSat01 and TfSat02 repeats along Chromosomes fLG2-fLGX in the Tfree1.0 assembly. (C) PCA clustering of TfSat01 monomers and 166-bp segments from TfSat02 and TCsat15. The analysis included 10,000 randomly selected TfSat01 monomers, 2237 TfSat02 segments from T. freemani, and 2788 TCsat15 segments from T. castaneum. Each dot represents a single sequence, and the colors indicate the repeat type.
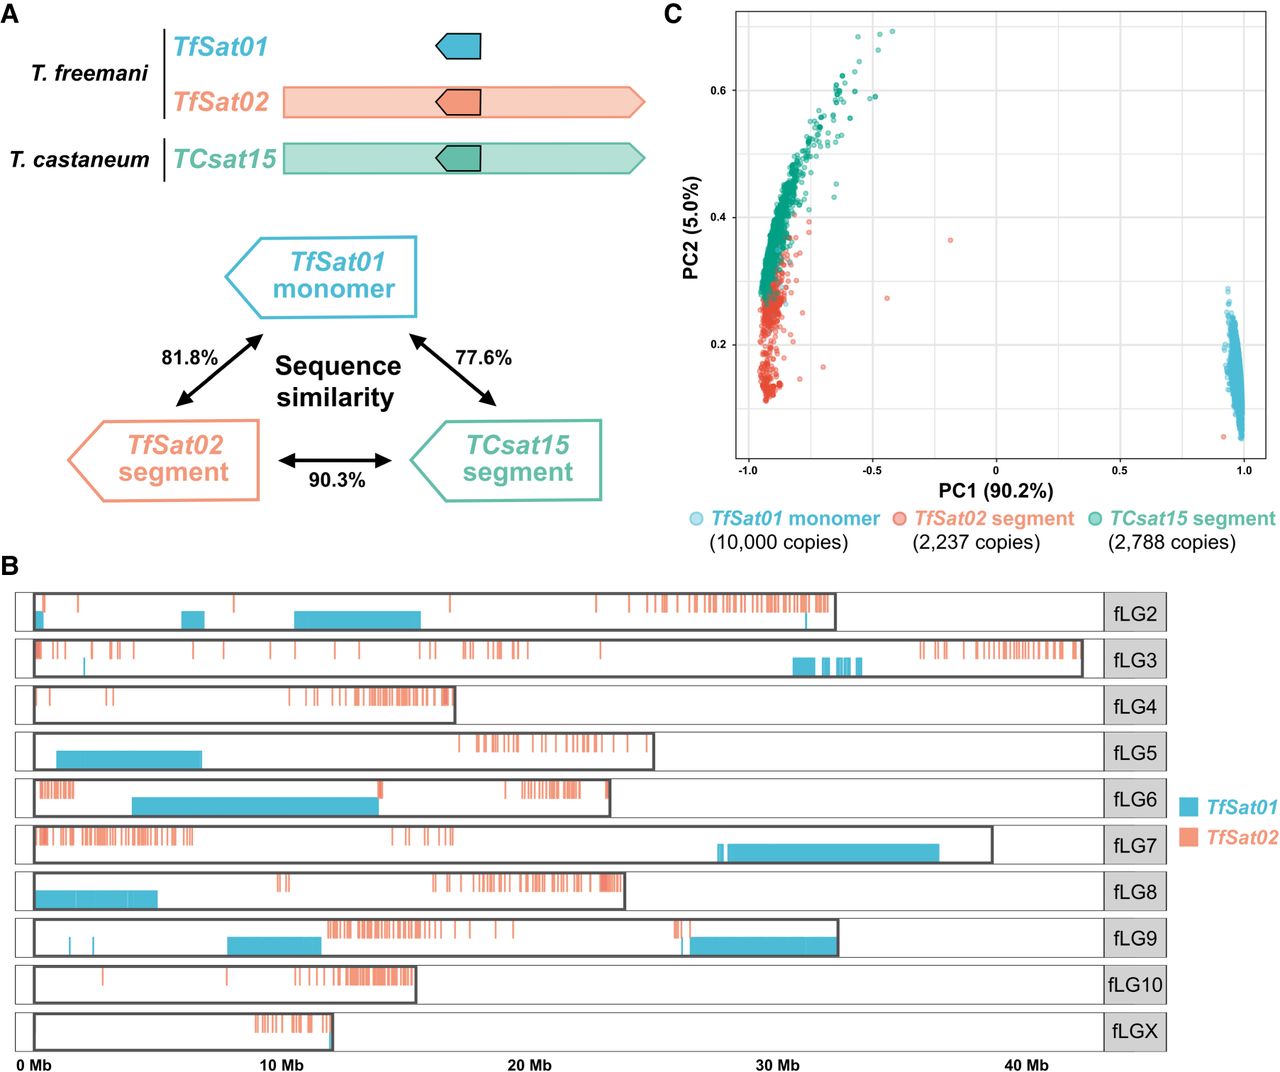
To resolve this, we searched the genome of T. castaneum for related sequences. No tandemized TfSat01-like copies were found, but we identified TCsat15, a previously characterized satDNA in T. castaneum (Gržan et al. 2023), as the ortholog of TfSat02, sharing 85.2% similarity across the entire 1106-bp monomer (Supplemental Fig. S10). Like TfSat02, TCsat15 also contains a 166-bp segment corresponding to the TfSat01 monomer (Fig. 4A; Supplemental Fig. S10), which implies that the TfSat01 sequence was embedded within the ancestral TfSat02/TCsat15 repeat. From this, we conclude that the major satellite TfSat01 is evolutionarily younger and that it emerged from TfSat02. A direct comparison of the TfSat01 consensus with the corresponding 166-bp segments of TfSat02 and TCsat15 showed that the TfSat02 and TCsat15 segments are more similar to each other than to TfSat01 (Fig. 4A). To verify this, we performed the PCA on 10,000 randomly subsampled TfSat01 monomers, all annotated 166-bp segments of TfSat02 in Tfree1.0, and all corresponding 166-bp segments of TCsat15 annotated in the T. castaneum TcasONT assembly. The PCA strongly grouped the TfSat01 monomers into a separate, distant cluster (Fig. 4C). Based on this result and the absence of tandemized TfSat01-like copies in T. castaneum, we conclude that TfSat01 was not present as a canonical satDNA in the common ancestor but rather represents a trait of the T. freemani genome (Fig. 5A).
Comparison of satDNAs in the centromeric regions of the sibling species T. freemani and T. castaneum. (A) Proposed origin of the major satDNAs TfSat01 and TCAST from an ancestral satellite DNA and a transposon-like element in T. freemani and T. castaneum, respectively. Blue and red boxes show the resulting repeats in each species. (B) Schematic of long-range organization of the species-specific major satDNAs TfSat01 and TCAST, intermingled with orthologous minor satDNAs TfSat03 and Cast7, respectively, in the centromeric regions of T. freemani and T. castaneum. (C) PCA clustering of the orthologous Cast7, TfSat03, and TfSat04 repeats. The analysis included 1000 randomly selected Cast7 monomers from the TcasONT assembly, together with subunits A, B, and C from 1000 randomly selected TfSat03 repeats and all 159 TfSat04 monomers annotated in the Tfree1.0 assembly. Dots represent individual sequences, color-coded by repeat type.
To decipher the origin of the T. castaneum major satDNA TCAST, we searched for its presence in T. freemani, but no tandemized TCAST copies were found in the Tfree1.0 assembly. Instead, we identified a TCAST transposon-like element previously reported in T. castaneum (Brajković et al. 2012). This 1093-bp element, resembling a DNA transposon, contains two segments that share 83% similarity with a TCAST monomer and its truncated version in reverse orientation, partially overlapping with ∼290-bp inverted termini (Supplemental Fig. S11A). We found this transposon-like element scattered on all chromosomes in both species, except for the T. castaneum X Chromosome (Supplemental Fig. S11B). Phylogenetic analysis showed that copies from T. castaneum and T. freemani generally separated in species-specific groups (Supplemental Fig. S11C). Considering the 80% sequence similarity and wide genomic distribution in both species, we hypothesize that the TCAST transposon-like element was present in the ancestral genome and gave rise to the 360-bp TCAST satDNA, the current major satellite of T. castaneum (Fig. 5A).
The orthologous centromeric minor satDNAs
As the T. freemani centromeric regions harbor not only TfSat01 but also TfSat03, we next searched for a possible TfSat03 ortholog in T. castaneum. It turned out to be Cast7, one of the most variable T. castaneum satDNA, comprising ∼0.2% of the genome (Pavlek et al. 2015; Volarić et al. 2024). Cast7 is based on ∼109- to 114-bp repeats, which correspond to the TfSat03 subunits with 67.2%–79.3% similarity (Supplemental Fig. S12). Even more striking is their orthologous organization: Both satellites are interspersed with their respective major satDNAs and exhibit a tendency toward dyad symmetry (Fig. 5B). Namely, in T. castaneum, Cast7 arrays are primarily located between TCAST arrays in the (peri)centromeric regions (Volarić et al. 2024), and we discovered that Cast7 and TCAST repeats display internal orientation switches within arrays, as observed in the T. freemani centromeric satDNAs. Whereas the TCAST-Cast7 arrangement in T. castaneum is more irregular than the TfSat01-TfSat03 pattern in T. freemani, the positional and organizational orthology of the minor satellites Cast7 and TfSat03 is evident, despite the divergence of their major satellites, TCAST and TfSat01 (Fig. 5B).
The previously established relatedness between TfSat03 and yp-specific TfSat04 prompted us to investigate their relationship to Cast7 by analyzing randomly selected individual monomer/subunit sequences. The PCA showed that Cast7 monomers intermingle with the clusters of TfSat04 monomers and TfSat03_subunitA (Fig. 5C), consistent with the highest similarity between their consensus sequences (Supplemental Fig. S12). This clustering may reflect ancestral sequence preservation but potentially also a certain functionality.
The orthologous low-copy-number satDNAs
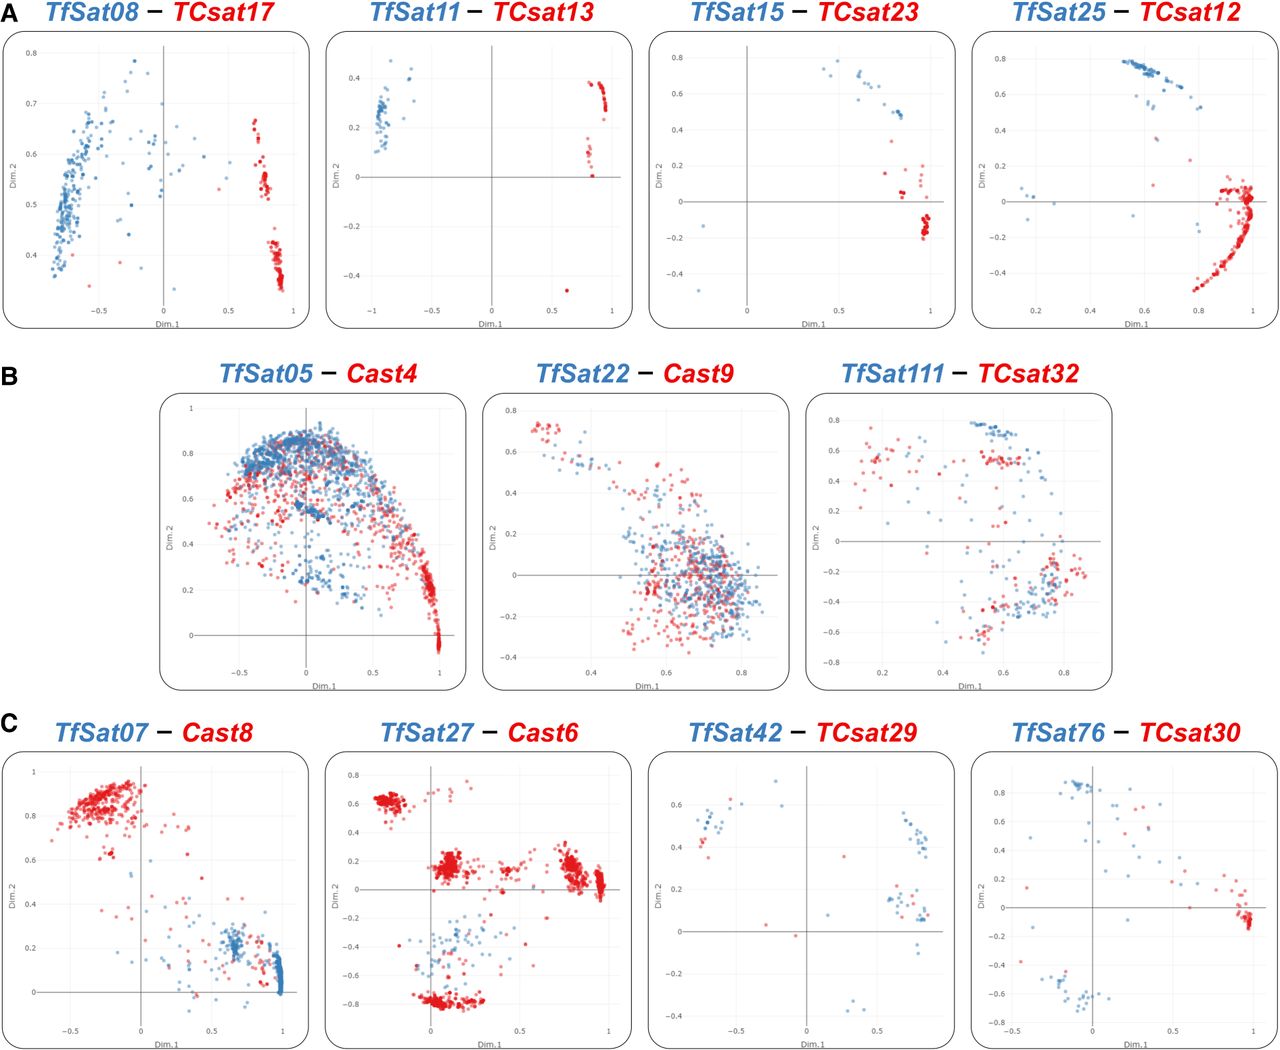
In addition to TfSat02, TfSat03, and TfSat04, we identified 11 more T. freemani satDNAs with orthologs among previously characterized T. castaneum satellites (Supplemental Table S3). The alignments of the species’ consensus sequences show pairwise similarities from 63.8% to 94.8% (Supplemental Fig. S13). To explore relationships between monomeric copies of orthologous satellites, we annotated the orthologous repeats in Tfree1.0 and TcasONT and analyzed their sequences (Supplemental Data S4). The PCA plots revealed three clustering patterns: (1) species-specific clustering (TfSat08, TfSat11, TfSat15, TfSat25) (Fig. 6A); (2) extensive mixing of repeats from both species (TfSat05, TfSat22, TfSat111) (Fig. 6B); and (3) segregation of repeats from one species into multiple clusters (TfSat07, TfSat27, TfSat42, TfSat76) (Fig. 6C).
PCA plots of the T. freemani satDNA (TfSat) repeats and their orthologs among known T. castaneum satDNAs (Cast, TCsat) showing: (A) species-specific clustering, (B) extensive interspecific mixing, (C) segregation of repeats from one species in more than one cluster. Names of satDNA orthologs are indicated above each plot. Dots represent monomer copies from the T. freemani Tfree1.0 (blue) and T. castaneum TcasONT (red) assemblies. PCA is based on alignments in Supplemental Data S4, and interactive plots can be found in Supplemental Data S5.
We hypothesized that some of the remaining 120 T. freemani satDNAs may have orthologous copies in T. castaneum not classified as satellites, due to either lack of tandemization or gaps in the Tcas5.2 assembly used to define the T. castaneum satellitome (Gržan et al. 2023). By searching the more complete TcasONT assembly with all T. freemani satDNAs as queries, we identified an additional 45 satellites recognizing related copies in T. castaneum. The PCA of their aligned copies (Supplemental Data S4, S5) showed that they also follow one of the three previously described patterns.
Mechanisms of satDNA propagation
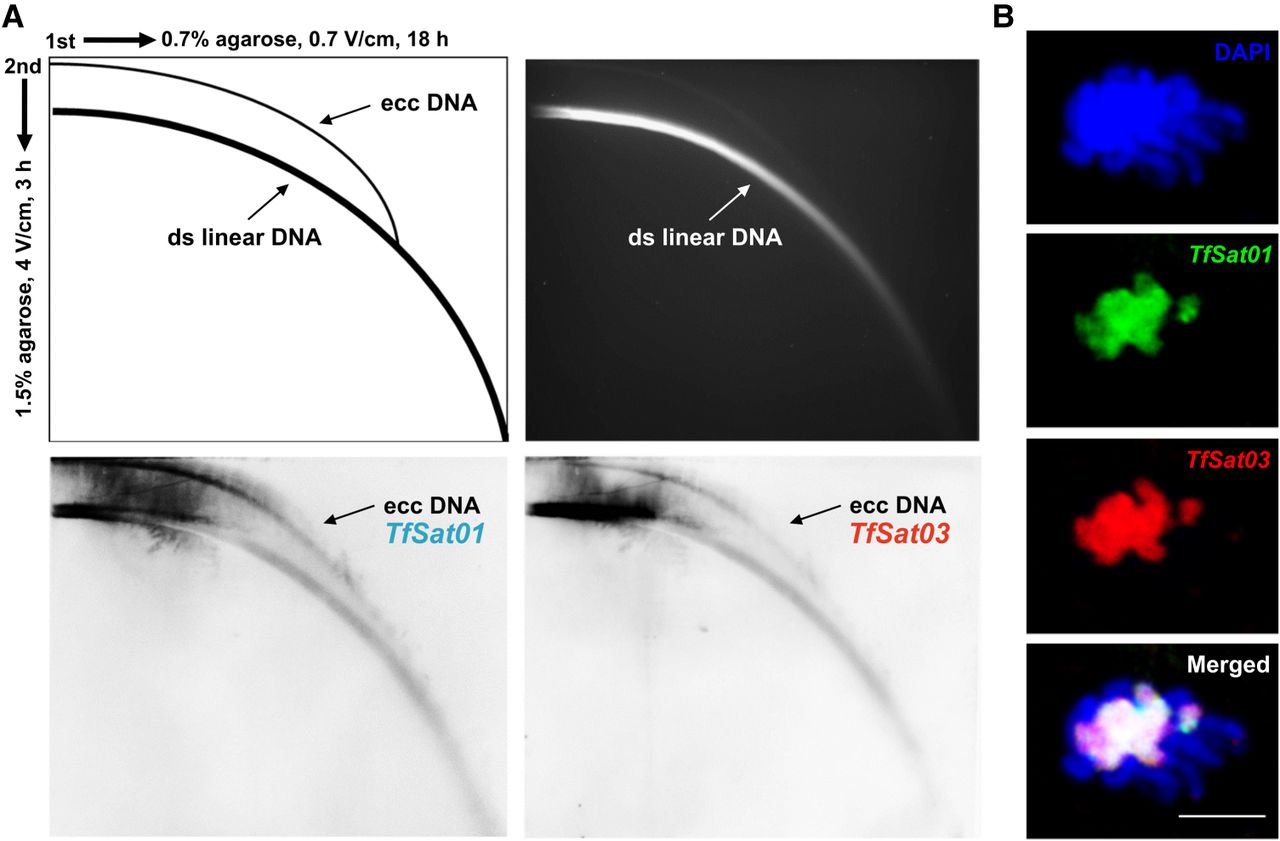
Being among the most variable sequences of eukaryotic genomes, satDNAs are subject to a very dynamic turnover. To understand the mechanisms shaping the T. freemani satellitome, we first focused on TfSat01 and TfSat03. Their intermingling across all chromosomes except the sex Chromosome yp suggests linked spreading. The conserved inversion points within their arrays, found on nonhomologous chromosomes, further imply a joint mechanism propagating these satellites. One possible mechanism for this collinear spread could be the expansion via extrachromosomal circular DNA molecules (eccDNAs) that contain the TfSat01/TfSat03 arrays and spread them by reintegration into nonhomologous chromosomes. To screen for TfSat01 and TfSat03 in the eccDNA fraction, we performed two-dimensional (2D) agarose gel electrophoresis of total genomic DNA, followed by Southern blotting with specific probes (Fig. 7A). Besides signals from linear chromosomal DNA, both satellites appeared at arc positions, confirming their presence in the eccDNAs. Another potential mechanism for the spread of these satellites across nonhomologous chromosomes involves 3D chromosomal interactions. Indeed, in meiotic prophase I, we occasionally observed the bouquet-like formations of nonhomologous chromosomes associated via (peri)centromeric heterochromatin. Two-color FISH confirmed the colocalization of TfSat01 and TfSat03 at these regions (Fig. 7B). We thus conclude that the concomitance of the two satellites at multi-megabase-long regions might be a consequence of the joint action of both mechanisms—(peri)centromeric 3D interactions in meiotic bouquet-like configurations and reintegration of eccDNAs.
Experimental evidence of TfSat01 and TfSat03 satDNA repeats in the extrachromosomal circular DNA (eccDNA) molecules and in prophase I associations of nonhomologous chromosomes. (A) 2D gel electrophoresis analysis of the eccDNAs in T. freemani. The schematic (top left) illustrates the migration patterns of linear and circular DNA forms in 2D gel electrophoresis. The ethidium bromide stained gel (top right) with 2D-electrophoretically separated T. freemani genomic DNA was Southern-blotted and hybridized with TfSat01 (bottom left) and TfSat03 (bottom right) probes. Arrows on the blots indicate eccDNAs signals. (B) Meiotic bouquet-like configurations showing heterochromatic associations of T. freemani nonhomologous chromosomes. DAPI-stained chromosomes (top) were analyzed by two-color FISH with TfSat01 (green) and TfSat03 (red) probes. An overlap of signals is shown below. The bar represents 5 µm.
Beyond TfSat01 and TfSat03, we observed evidence of expansion mechanisms in other satDNAs. Partial sequence similarities between some low-copy-number satDNAs and TEs (Supplemental Table S3) suggest that TEs contribute to their origin and spread. Orthologous satDNAs proved valuable insights, particularly those linked to the Rehavkus DNA transposons, characterized by inverted termini made of terminal inverted repeats (TIRs) and a variable number of subterminal tandem repeats. In Supplemental Figure S14, we highlight three cases. The first involves the orthologs TfSat15 and TCsat23, both of which form short arrays in the inverted termini of the Rehavkus-1_TC transposon and cluster predominantly in species-specific groups (Fig. 6A; Supplemental Fig. S14A). In the second example (Supplemental Fig. S14B), TfSat23 and its orthologous copies in T. castaneum also evolve in a concerted manner, as does the central part of their associated Rehavkus-3_TC transposon. However, the Rehavkus-3_TC copies in T. freemani typically contain 6–8 TfSat23 repeats, whereas T. castaneum Rehavkus-3_TC copies contain up to 50 repeats in inverted termini. The third and most illustrative example of how TE-integrated repeats can expand into notably long arrays is the TfSat25-TCsat12 orthologous pair (Supplemental Fig. S14C). In T. freemani, TfSat25 forms short arrays of 2–12 repeats within the inverted termini of Rehavkus-1_TC-like elements. In contrast, its T. castaneum ortholog, TCsat12, expanded into long arrays up to 80.5 kb (Supplemental Fig. S14C). Because T. freemani retains the repeats exclusively within Rehavkus-like elements, the expansion in T. castaneum likely occurred after the species diverged, supported also by species-specific PCA clustering of the repeats (Supplemental Fig. S14C).
We also observed concerted evolution in satDNAs not related to TEs. For example, the orthologous satDNAs TfSat08 and TCsat17 are located on Chromosome (f)LG3 in both species and form similarly sized arrays (339 repeats in T. freemani, 290 in T. castaneum). Synteny analysis revealed that these arrays are embedded in conserved genomic regions, with >90% similarity in the 10-kb flanking regions (Supplemental Fig. S15). However, the PCA showed species-specific clustering of repeats (Fig. 6A), suggesting that the ∼40-kb array was present in the common ancestor but diverged through gene conversion after the species split.
Some satDNAs, such as TfSat06, show intense interchromosomal homogenization, indicated by their presence on all T. freemani chromosomes without chromosome-specific clustering (Supplemental Fig. S16A). TfSat06 arrays are organized as long, sometimes >11 kb long, inverted termini of transposon-like elements resembling Rehavkus-1_TC (Supplemental Fig. S16B), suggesting transposition as a likely mechanism for their spread. Because only a single orthologous 20-repeat array was found in T. castaneum, we assume that the expansion and interchromosomal homogenization of TfSat06 in T. freemani occurred after species divergence. In contrast, TfSat22 and Cast9 exemplify a satellite that probably began interchromosomal homogenization in the ancestral genome. This is supported by a strong admixture of their orthologous copies between species, as well as interchromosomal mixing within each species (Supplemental Fig. S17).
Finally, some low-copy satDNAs show intra-array homogenization. For instance, TfSat54 on Chromosome fLG10 forms two short arrays with repeats clustered separately (Supplemental Fig. S18A). Similarly, TfSat97 shows an array-specific clustering of its repeats from two arrays on Chromosome fLG3 (Supplemental Fig. S18B). In both cases, the arrays of these very low-copy-number satDNAs do not exceed 20 tandem repeats, suggesting that they may represent early-stage satellite arrays with the potential for future amplification or loss.
Discussion
In this study, we identified 135 satDNAs comprising 38.7% of the flour beetle T. freemani genome, one of the most satellite-rich genomes described to date. Species with larger numbers of satDNAs have been reported, such as the frog Proceratophrys boiei, with 226 satellites (João Da Silva et al. 2023) or the crayfish Pontastacus leptodactylus, with 258 satDNAs (Boštjančić et al. 2021), but their genomes are 10–60 times larger than that of Tribolium. Whereas satDNA cataloging provides general information about the satellitome content, studying the long-range organization and structure of satDNA arrays is essential for understanding the evolutionary dynamics, which was the ultimate goal of our work. The high-quality T. freemani reference genome, combined with its close evolutionary relationship to the model species T. castaneum, provided a strong foundation for exploring both species-specific and conserved satDNA features in their exceptionally satDNA-abundant genomes. By offering evolutionary insights, this integrative approach also uncovered biologically meaningful structural patterns within elements that might otherwise appear to be purely repetitive.
The evolutionary aspects of Tribolium satellitomes
The origin of satDNAs, especially those that dominate genomes, is an intriguing but rarely answered question. Here, we revealed the origin of the genome-dominating and species-specific centromeric major satellites in the siblings T. freemani and T. castaneum. We discovered that the T. freemani major satDNA TfSat01 arose from a segment of another satellite, which is still present in both genomes. Apart from the fact that the primordial satellite still exists, it is equally intriguing why only 15% of its sequence length has evolved into the new satellite. The proliferation of a dominant satDNA from a segment of a repetitive sequence is also demonstrated by the T. castaneum major centromeric satDNA TCAST. Namely, a DNA transposon-like element harboring TCAST was found scattered in T. castaneum (Brajković et al. 2012), but we also detected the same DNA transposon-like element in T. freemani. The previous work on TCAST-like elements in T. castaneum also reported a CR1-3_TCa retrotransposon, which contains a segment of TCAST sequence (Brajković et al. 2012), and the authors pointed out that TCAST might be derived from this retrotransposon. However, we could not detect any CR1-3_TCa copies in T. freemani. Therefore, we believe that it is more likely that TCAST originated from the ancestrally present DNA transposon, whereas the CR1-3_TCa retrotransposon in T. castaneum might have captured part of the TCAST sequence by insertion into the TCAST satDNA array.
The T. freemani and T. castaneum major satDNAs apparently evolved from different types of repetitive sequences, TfSat01 from a satellite and TCAST from a DNA transposon (Fig. 5A). The common link between these source elements is their genome-wide distribution and presence on all autosomal chromosomes. We infer that the ancestral sequence TfSat02/TCsat15, from which TfSat01 arose, must have been widely scattered in the ancestral genome, because in today's genomes both widespread satellites, TfSat02 and TCsat15, often occur as short segments with just one or a few repeats (this work; Gržan et al. 2023). We hypothesize that wide genomic dispersal is, if not a prerequisite, at least a desirable property of sequences that have the potential to be the source of satDNAs. Under circumstances of high DNA turnover, dispersed elements may more easily distribute and exchange sequences with their counterparts from distant regions and/or nonhomologous chromosomes. Importantly, we found no tandemized copies of the T. freemani major satellite in T. castaneum, or vice versa. Therefore, we conclude that the proliferation of the major satDNAs in T. freemani and T. castaneum occurred simultaneously and possibly rapidly. The pronounced amplification of a sequence from the ancestor's genome into a dominant satDNA of the offspring can be explained by the satDNA library theory (Fry and Salser 1977), experimentally supported by different organisms (Meštrović et al. 1998; Silva et al. 2017). However, the satDNA library hypothesis assumes the propagation of the entire pre-existing repeat, whereas the relationship between TfSat01 and TfSat02 in T. freemani shows that it is possible that only a segment of a satellite monomer proliferates into a novel and highly abundant satDNA. This discovery expands the current understanding of the satDNA library concept. If more such examples are found in other organisms, this could eventually help to identify the features that predispose a sequence (or its segment) to proliferate and become the most copious satellite in a genome.
The low-copy-number satDNAs in the T. freemani satellitome show evolutionary statuses from species-specific to orthologous between the two siblings. In both groups, there is a large number of satellites that show partial similarities to TEs. Links between TEs and satDNAs have been observed for some time, and there is growing evidence that TEs are a prolific source of satellite sequences (for review, see Zattera and Bruschi 2022). High-quality genome assemblies of three Drosophila virilis group species showed that much of the divergence in genome composition between the sister species stems from Helitron TE-related tandem repeats (Flynn et al. 2024). Another TE-tandem repeat association in the virilis group involves satDNA repeats, which occur in large inverted termini of the foldback DNA transposon Tetris (Dias et al. 2014). TE-satDNA associations in T. freemani highlighted Rehavkus, the foldback DNA transposons that, like Tetris, carry tandem repeats at their inverted termini. An increased number of tandem repeats in the inverted termini of foldback elements enhances their transposition by strengthening transposase binding and increasing excision frequency (Liu and Wessler 2017). This may explain the benefit for foldback TEs to accommodate satellite repeats. Notably, orthologous satDNAs associated with Rehavkus in Tribolium undergo concerted evolution, but their evolutionary outcomes may differ significantly. Whereas some repeats remain cocooned in the inverted termini of TEs for a long time, some orthologs expanded from TE-residing repeats to satDNA arrays up to 80 kb in length.
TEs likely serve not only as a source of satDNAs but also as vectors for their propagation. Transposition may enable satellite sequences to spread across the genome, including euchromatic regions that were dogmatically thought to be deprived of satDNAs. In T. freemani, we found most low-copy-number satDNAs in the vicinity of genes and TEs, consistent with findings for the low-copy-number satDNAs in T. castaneum (Gržan et al. 2023). In T. castaneum, even more abundant satDNAs have spread into gene-rich regions (Volarić et al. 2024), resembling the euchromatic satDNA dynamics observed in Drosophila melanogaster and its close relatives (Sproul et al. 2020). A growing number of studies report satDNA arrays in euchromatic regions, indicating that euchromatin is not inhospitable to tandemly repetitive sequences (Cabral-de-Mello et al. 2023; Rico-Porras et al. 2024). However, functional studies are required to clarify whether the spread of satDNAs in euchromatin is functionally driven or whether these arrays are just tolerated scattered repetitive “seeds” with the potential to expand.
satDNA-rich centromeric regions in Tribolium
Consistent with the satellite-rich genomes, the centromeric regions of Tribolium abound in satellites. In T. castaneum, satDNA-rich and unusually extended centromeres, so-called metapolycentromeres, comprise almost half the length of individual chromosomes (Gržan et al. 2020), and FISH results in this work reveal a comparable situation in T. freemani. Such abundance raises questions about what enables a sequence to become a centromere-dominant satellite and whether a sequence or a structure is more important. In T. freemani, the long-range organization of (peri)centromeric satDNAs highlighted dyad symmetry as the most conspicuous feature. Dyad symmetries within satellite monomers can form secondary structures such as hairpins or cruciforms, and enrichment in predicted non-B-form DNA structures was found in centromeric repeats of diverse animal and plant species (Kasinathan and Henikoff 2018; Liu et al. 2023). It has been suggested that these structures may facilitate the loading of centromere-specific nucleosomes (Talbert and Henikoff 2022). In T. freemani and T. castaneum, short inverted repeats (<10 bp), potentially capable of forming non-B-form DNA, are present in monomers of major satDNAs (Juan et al. 1993; Ugarković et al. 1996b). In addition to short dyad symmetries, we revealed that T. freemani centromeric regions contain intermingled arrays of major TfSat01 and minor TfSat03 satDNA, both exhibiting striking macro-dyad symmetries based on their several kb long inverted subarrays. The high frequency and preservation of macro-dyad symmetries make one wonder about their biological significance. Because no stable secondary structures formed by multi-kilobase-long inverted satellite arrays have been reported so far, we hypothesize that segments in which satellite subarrays/monomers change orientation and possibly form DNA loops could be essential components of macro-dyad symmetries. The potential loops could contribute to the compaction of centromeric chromatin and/or possibly serve as centromere-specific protein-binding sites. The recent study on human centromeres has shown that the centromeric alpha satellite has an intrinsic tendency to form secondary structures, including hairpins, but also that the binding of the CENPB protein to the satellite repeats promotes formation of submicron-sized DNA loops important for centromere stability and its positioning (Chardon et al. 2022). The conserved inversion points in T. freemani centromeric satDNA arrays raise the possibility that TfSat01 and TfSat03 macro-dyad symmetries might have a similar functional role, although this remains to be tested.
Pronounced dyad symmetries also characterize the centromeric satDNAs of other Tribolium species, which have more complex monomer units. In Tribolium brevicornis, the 1061-bp major satellite comprises two ∼470-bp inverted subunits (Mravinac et al. 2005). In Tribolium madens, the 704-bp MAD2 satellite is also based on dyad symmetry (Ugarković et al. 1996a). Tribolium audax has an even more complex TAUD2 satellite with ∼700-bp-long inverted subrepeats (Mravinac and Plohl 2010). All these Tribolium major satellites span wide centromeric regions of all chromosomes. Therefore, we conclude that dyad symmetry may indeed be a structural imperative and that secondary structures in Tribolium centromeres may be more important than the primary structure. This could explain the lack of sequence similarity between the major centromeric satDNAs of congeneric species. Recent work on two closely related mouse species proposed that rapid evolution of (peri)centromeric DNAs does not obstruct chromatin packaging and chromosome segregation if the satellites adopt DNA shapes recognized by conserved architectural proteins (Dudka et al. 2025).
In mouse centromeres, a low frequency of direction changes in pericentromeric and centromeric satDNAs’ arrays has been attributed to inversion events (Packiaraj and Thakur 2024). In the T. freemani centromeres, however, the direction switches are too pervasive to be explained by inversion events alone. We believe that the frequent macro-dyad symmetries in the T. freemani centromeres may reflect not only a possible structural preference but also underlying mechanisms driving satellite proliferation. One such mechanism could involve eccDNAs, which may serve as a mobile reservoir of repeat sequences that reintegrate into the genome and promote the spread and homogenization of satellites. satDNA-derived eccDNAs have been found in various eukaryotes (Cohen et al. 2003, 2006; Navrátilová et al. 2008; Huang et al. 2021), including T. castaneum (Volarić et al. 2024). In T. freemani, we confirmed the centromeric major and minor satDNAs in the eccDNA fraction, so we suggest that the eccDNAs propagate adjacent arrays of the two satellites, promoting the dyad symmetries present therein. Our conclusion is additionally supported by preserved direction changes in both major and minor satDNA arrays, highly conserved even among nonhomologous chromosomes. In addition to eccDNAs, 3D spatial interactions in the nucleus among distant satellite arrays may facilitate satellite spread between remote loci (Sproul et al. 2020). In T. freemani, we detected clustering of satDNA-rich (peri)centromeric heterochromatin during meiotic prophase, also observed in other Tribolium species (Žinić et al. 2000; Mravinac and Plohl 2010). Nonhomologous centromere pairing during early meiosis has been documented in several organisms (Kurdzo and Dawson 2015), including associations between satDNA-rich centromeric regions of the X Chromosome and different autosomes in mouse (Spangenberg et al. 2021). In mice, high sequence identity of telocentric regions between nonhomologous chromosomes led to the conclusion that frequent recombinational exchange occurs between these chromosomes, likely facilitated by their close association during meiotic prophase (Kalitsis et al. 2006). The clustering of the nonhomologous centromeres of T. freemani in early meiosis and the conserved direction switches between satDNAs arrays at nonhomologous chromosomes could be viewed as supporting this interpretation.
Potential functional implications of dynamic satDNA evolution
From a functional standpoint, an important finding is that T. freemani and T. castaneum, despite different major satDNAs, share an orthologous centromeric organization. In addition to dyad symmetries, in both species, arrays of species-specific major satDNAs intermingle with orthologous minor satDNAs. The unrelated major satDNAs, alongside less abundant but similar minor satellites, challenge the intuitive assumption that the most abundant satDNAs are the critical sequences of functional centromeres. At this point, we hypothesize that the orthologous minor satDNAs (TfSat03 and TfSat04 in T. freemani and Cast7 in T. castaneum) may be centromere-competent. An analogy is drawn with the centromeres of Mus musculus, in which the more abundant major satellite forms the pericentromeric heterochromatin, whereas the less abundant minor satellite is centromeric (Joseph et al. 1989). Interestingly, the mouse Y Chromosome centromere is based on a highly diverged minor satellite-like sequence (Pertile et al. 2009). Likewise, the T. freemani sex Chromosome yp lacks the major satDNA and instead contains the yp-specific TfSat04, from the superfamily of minor satDNAs. We speculate that the yp-specific variant of the minor satellite may have evolved through intrachromosomal homogenization, potentially due to suppressed exchange with other chromosomes, also suggested by the absence of TfSat01/TfSat03 arrays on the yp Chromosome.
Functional centromeres are usually determined epigenetically by centromere-specific histone H3 variants, CENH3 (Mellone and Fachinetti 2021). In T. castaneum, major satDNA TCAST spans CENH3 metapolycentric domains but also extends beyond them (Gržan et al. 2020). Our preliminary testing of T. castaneum CENH3 antibodies in T. freemani indicates that T. freemani has its own species-specific CENH3, consistent with the centromere paradox hypothesis, which justifies the rapid evolution of centromeric DNA and protein components even among closely related species (Henikoff et al. 2001). Detailed studies of centromere-specific proteins, particularly CENH3, should help to decipher which of the T. freemani satDNAs, major or minor, are actually involved in centromere function.
T. freemani and T. castaneum separated 14 Mya and represent the youngest species within the >100-My-old genus (Hinton 1948; Ramesh et al. 2021). Although it is not known whether the two siblings coexist in the same habitats, they interbreed under laboratory conditions and produce infertile F1 hybrids (Nakakita et al. 1981), indicating postmating reproductive isolation (Wade and Johnson 1994). Given that the satDNAs are by far the most abundant sequences in their genomes and thus the largest source of genomic difference between the two species, we are tempted to speculate whether they may contribute to reproductive isolation. In two congeneric catfish species, genome-wide satDNA divergence between the parental species has been linked to hybrid sterility (Lisachov et al. 2024). In Drosophila hybrids, differences in satDNA composition between parental species impede the proper clustering of pericentromeric satDNAs into chromocenters in interphase nuclei, thereby promoting hybrid incompatibility (Jagannathan and Yamashita 2021). To determine whether satDNA discrepancies underlie the reproductive isolation between T. freemani and T. castaneum, functional studies similar to those in Drosophila are required, and the hybrids will play a key role in answering this question.
In conclusion, the comprehensive study of the T. freemani satellitome and the comparison with T. castaneum revealed a dynamic evolution of satDNAs that yielded the greatest differences between the siblings’ genomes. Dissimilar levels of conservation, organization, chromosomal locations, and abundances point to different evolutionary dynamics and mechanisms of propagation to which individual satellites within a genome are subject. As for the centromeric satDNAs, we deciphered the origin of the completely different major satellites and uncovered the orthologous organization of the centromeric regions, which show macro-dyad symmetries and related minor satDNAs as a commonality between the siblings. These findings provide a foundation for future work that will address the role of Tribolium’s most prominent satDNAs in the context of functionality and speciation, in which T. freemani-T. castaneum hybrids will be of great assistance. In addition, this work serves as a good reference point for satellitome analyses of other Tribolium species, which should further improve the understanding of satDNA evolution in satDNA-rich genomes. We propose that satellite-abundant nonmodel organisms such as Tribolium can be very useful in tackling questions about functional and evolutionary implications of satDNA behavior, and our further research will go in this direction.
Methods
Insect material
The T. freemani beetles, obtained from the USDA Agricultural Research Service in 2015, were reared in whole-wheat flour at 27°C and 50%–70% relative humidity.
Genome assemblies
Repeat annotation and satDNA array analyses were performed using the two high-quality chromosome-level genome assemblies that we recently generated: Tfree1.0 (NCBI GenBank [https://www.ncbi.nlm.nih.gov/genbank/] accession number GCA_939628115.1) and TcasONT (European Nucleotide Archive [ENA; https://www.ebi.ac.uk/ena/browser/home] accession number GCA_950066185.1). The T. freemani assembly Tfree1.0 (262.9 Mb), based on Pacific Biosciences (PacBio) HiFi reads (Volarić et al. 2022), is currently designated as the T. freemani NCBI reference genome. The T. castaneum assembly TcasONT (191 Mb), based on Nanopore long-read sequencing, is the latest T. castaneum assembly, significantly improved in repetitive regions (Volarić et al. 2024).
DNA isolation and whole-genome sequencing
Genomic DNA was extracted from 50 mg of snap-frozen adult T. freemani (10 pooled males and females) using the DNeasy Blood and Tissue kit (Qiagen). DNA quantity and quality were assessed with the Qubit 2.0 DNA HS Assay (Thermo Fisher Scientific) and the Tapestation Genomic DNA Assay (Agilent Technologies), respectively. DNA was sent to the sequencing service provider Admera Health, where library preparation was done using a KAPA Hyper Prep kit (Roche). Illumina 8-nt unique dual-indices were used to mitigate index hopping. Whole-genome sequencing (WGS) on an Illumina NovaSeq X Plus 10B platform (Illumina) generated 2 × 35,516,583 paired-end reads (2 × 151 nt), totaling 10.7 Gb (∼35 × genome coverage of T. freemani).
satDNA mining using graph-based clustering
T. freemani satDNAs were identified from unassembled Illumina reads using graph-based clustering with the TAREAN pipeline (Novák et al. 2017). Raw reads were quality-checked and preprocessed using RepeatExplorer2 tools on the Galaxy server (https://repeatexplorer-elixir.cerit-sc.cz/galaxy/). The interlaced reads were randomly subsampled to reduce the size of the input data set to achieve a low genome coverage required for TAREAN analyses. Six randomly subsampled read sets (175,000–1,500,000 reads; 0.02–0.7 × coverage) were used (Supplemental Table S1). As determined in the first test analysis, a high proportion of TfSat01 satDNA in the genome considerably limits the number of reads that can be processed with TAREAN (Supplemental Table S1, T1 analysis). Therefore, subsequent data sets excluded TfSat01-containing reads (T2–T6 analyses). A custom database was created from consensus sequences of high and low putative satDNAs from all six TAREAN analyses, and duplicates were removed via BLAST. Candidate satDNAs were mapped to the Tfree1.0 assembly, and sequences forming arrays of five or more consecutive monomers were classified as satDNAs. The satDNA consensus sequences were BLAST-searched against the NCBI GenBank (Clark et al. 2016) and screened with the CENSOR tool against GIRI Repbase (Bao et al. 2015).
satDNA bioinformatic analyses
Basic analyses of satellite repeats such as monomer length, A+T content, pairwise similarities, and potential secondary structures were performed using the Geneious Prime 2023.2.1 package (Biomatters Ltd.). All other analyses were conducted as described below, with all R scripts (v4.2.2; R Core Team 2022) available as Supplemental Code.
Repeat annotations
The T. freemani satDNA consensus sequences were annotated in the T. freemani Tfree1.0 and T. castaneum TcasONT genome assemblies using NCBI's stand-alone BLAST algorithm and the R programming language with the metablastr package (Benoit and Drost 2021). Filtering thresholds were set at 70% identity and 70% query coverage as a balanced criterion that reflects the sequence variability inherent to satDNAs, while still ensuring homology to reference monomers. Detected satDNA loci were converted to GFF files for visualization and extraction.
Identification of satDNA arrays
satDNA arrays were detected by sorting all hits for a given satDNA in the BLAST results table and checking whether another monomer of the same satDNA occurred within a genomic distance of one monomer length. If so, the array was extended, and the step was repeated until the array could no longer be extended (i.e., there were no repeats within a monomer length). This approach was used to detect both arrays with five or more consecutive repeats and scattered organization. The annotations of satDNA repeats and arrays are provided in Supplemental Data S6.
Genomic environment
After defining the arrays, 10-kb upstream and downstream flanking regions were analyzed for the presence of genes, transposable elements, and other satDNAs identified earlier. Gene and TE annotations were taken from the official T. freemani annotation set at Figshare (https://doi.org/10.6084/m9.figshare.19682400.v1), and satDNA annotations are provided in Supplemental Data S6.
Long-range organization of centromeric satDNAs
In analyzing the major satDNA TfSat01, we first revised its consensus sequence. Our consensus, obtained from TAREAN analysis of WGS reads (Supplemental Fig. S5A), differs by nine nucleotides from GenBank entry X58539, generated from five randomly cloned monomers (Juan et al. 1993). Several lines of evidence support our consensus as more representative: (1) BLAST searches against the Tfree1.0 assembly using ≥70% similarity criterion identified 4.6% more monomers with our consensus (228,060 TfSat01 vs. 218,083 X58539); (2) the distribution of similarities between the detected monomers and a query consensus was shifted toward higher values for our consensus (Supplemental Fig. S5B); and (3) 32 monomers in Tfree1.0 matched our consensus exactly, whereas none were 100% identical to X58539. We deposited the TfSat01 sequence as an updated consensus in the NCBI GenBank under accession number PQ553299.
To visualize the centromeric organization of TfSat01, we used StainedGlass software (Vollger et al. 2022) with default settings and manually extracted centromeric regions of T. freemani chromosomes. To detect inverted TfSat01 subarrays, the array detection step was repeated in a strand-dependent manner to create the “strand-specific” database. Subsequently, the “strand-specific” arrays were overlapped with total TfSat01 arrays (strand-independent) to determine the number of inversions per strand-independent array. Intercalary segments among TfSat01 arrays were identified and examined for the presence of TfSat03 satDNA using overlaps and existing TfSat03 annotations. Following the detection of TfSat03 monomers in the gaps of TfSat01 arrays, the central regions where the TfSat03 repeats change orientation were extracted and analyzed using graph networks as described below. The observed patterns of long-range organization of the two centromeric satellites, including the intermingled organization of the TfSat01 and TfSat03 arrays as well as the inversion points within the arrays for both satellites, were additionally verified and confirmed on the raw PacBio HiFi reads used to build the Tfree1.0 assembly (Volarić et al. 2022).
Sequence alignments and visualizations
All detected monomers of the 135 T. freemani satDNA were matched with the corresponding arrays to assign them unique IDs before extraction. To identify orthologs in the T. castaneum genome, the same processes of detection, array creation, and extraction were repeated for T. freemani satDNAs in the TcasONT assembly. Large multiple sequence alignments were generated using MAFFT (Katoh and Standley 2013). Genomic distance matrices were calculated using the dist.dna function with the “F81” genomic distance model from the ape package (Paradis and Schliep 2019). Principal component analysis was performed using the FactoMineR package (Lê et al. 2008). Static and dynamic plots were visualized with ggplot2 (https://ggplot2.tidyverse.org/) and plotly (https://plotly-r.com), respectively. Network visualizations were created from the distance matrices using the networkD3 package (available at https://cran.r-project.org/web/packages/networkD3/ index.html) by finding the five closest neighbors of each sequence in the alignment.
Revision of fLG7 chromosome sequence in the T. freemani genome assembly Tfree1.0
The T. freemani reference genome Tfree1.0 (GCA_939628115.1) includes nine autosomes (fLG2-fLG10) and the sex Chromosome X (fLGX), but the sex Chromosome yp remained unassembled (Volarić et al. 2022). Tfree1.0 places the satDNA TfSat04 at the end of Chromosome fLG7, but in this work, we established by FISH that TfSat04 is yp-specific (Fig. 3G). To resolve this discrepancy, we re-examined the contigs used in the Tfree1.0 assembly (Volarić et al. 2022). We found that the longest continuous TfSat04 array lies on the contig ptg000052l, located distally on Chromosome fLG7 and connected to the rest of the chromosome by an (N)100 assembly gap (Supplemental Fig. S19). The ptg000052l contig ends in TfSat04 repeats and has one of the lowest location confidence scores in the assembly (Supplemental Table S3 in Volarić et al. [2022]), so we hold that a slight similarity to TfSat03 caused the contig to be misaligned to Chromosome fLG7. After reviewing its sequence in detail, we conclude that the ptg000052l contig is a candidate for the nonassembled yp Chromosome and support this conclusion with several findings. First, in addition to the longest arrays of TfSat04, this contig also harbors the longest array of the low-copy-number satDNA TfSat07 (Supplemental Fig. S19), and by FISH, we indeed detected the strongest TfSat07 signal on the yp Chromosome (Supplemental Fig. S3C). Second, assemblies can be inaccurate in repetitive regions, so we examined the 24 Gb of the raw PacBio HiFi reads used for the Tfree1.0 assembly to analyze gene dosage. Gene dosages for 32 genes annotated on the ptg000052l contig and 2000 randomly selected genes annotated on different autosomes were estimated by mapping the genes at the raw reads with minimap2 (Li 2018). Notably, 32 genes annotated on the ptg000052l contig were represented in the raw reads, on average, two times less frequently compared to 2000 randomly selected genes (Supplemental Table S11). Third, regarding the contig ends, one side of ptg000052l terminates in an ∼18-kb TfSat04 array, and the other in a 1.2-kb (TCAGG)243 array (Supplemental Fig. S19), matching the Tribolium telomeric sequence (Mravinac et al. 2011). The repetitive endings suggest that the repeats at both ends extend further, but the ptg000052l contig with its size of 2.2 Mb probably accounts for the majority of the yp sequence, the smallest chromosome of T. freemani.
satDNA probes
To localize satDNAs on T. freemani chromosomes or to confirm their presence in eccDNA, specific DNA probes were generated. satDNA fragments were PCR-amplified from genomic DNA using primers designed with Primer3 2.3.7 in Geneious Prime and cloned into the pGEM-T Easy vector (Promega). Primer sequences and annealing temperatures are listed in Supplemental Table S12. Recombinant plasmids were transformed into Escherichia coli XL10-Gold Ultracompetent Cells (Agilent Technologies) following the manufacturer's protocol. Positive clones were selected by blue-white color screening and confirmed by Sanger sequencing (Macrogen Europe BV). Probes were PCR-labeled with biotin-16-(5-aminoallyl)-dUTP or aminoallyl-dUTP-Cy3 (Jena Bioscience), with a dUTP:dTTP ratio of 1:2, using specific primers and cloned inserts as a template.
Chromosome preparations, fluorescence in situ hybridization, and confocal microscopy
Chromosome spreads were prepared from freshly dissected T. freemani pupal gonads using the squash method. Chromosome preparations and FISH were performed as described previously (Gržan et al. 2020). Slides were examined with a Leica TCS SP8 X confocal laser scanning microscope with a HC PL APO CS2 63/1.40 oil objective, a 405-nm diode laser, and a supercontinuum excitation laser (Leica Microsystems). Fluorescence signals were captured separately for each fluorochrome and processed using LASX Office 1.4.7 28921 (Leica Microsystems), ImageJ (Schneider et al. 2012), and Adobe Photoshop CS5 (Adobe Systems), using only functions affecting an entire image equally. For each satDNA, a minimum of 10 metaphase spreads from 3 to 10 independent experiments were analyzed.
Extrachromosomal circular DNA isolation, 2D agarose gel electrophoresis, and Southern blot hybridization
To detect satDNAs in extrachromosomal circular DNA, total genomic DNA was extracted from 920 mg of T. freemani larvae and adults as previously described (Volarić et al. 2021). DNA concentration was measured using a Qubit 4 fluorometer and the Qubit dsDNA BR Assay kit (Invitrogen). To eliminate linear double-stranded DNA (dsDNA) from the isolated DNA, 20 µg of DNA were sheared by passing 30 times through a 0.33-mm syringe needle. The sample was then treated with 200 U of Exonuclease V (NEB) at 37°C overnight, which digests linear dsDNA but leaves circular DNA intact. The reaction was stopped with 11 mM EDTA [pH 8.0] and incubation at 70°C for 30 min. DNA was then purified using the Monarch PCR & DNA Cleanup kit (NEB).
For two-dimensional agarose gel electrophoresis, the first dimension was run in a 0.7% ethidium bromide (EtBr)-free agarose gel in 1 × TBE buffer at 0.7 V/cm for 18 h. The gel was then stained in 1 × TBE with 0.3 µg/mL EtBr for 1 h. A gel strip containing DNA of interest was excised, placed at a 90° angle to the direction of electrophoresis on a casting tray, and poured with 1.5% agarose containing 0.3 µg/mL EtBr. The second-dimension electrophoresis was run at 4 V/cm for 3 h in 1 × TBE with 0.3 µg/mL EtBr. Both electrophoreses were conducted at room temperature.
After 2D electrophoresis, the gel was treated with 0.25 M HCl for 30 min to depurinate DNA, followed by 0.4 M NaOH for 30 min to denature it. DNA was transferred overnight onto positively charged nylon membranes (Roche) by capillary blotting in 0.4 M NaOH. Hybridization probes for TfSat01 and TfSat03 were PCR-labeled with biotin-16-(5-aminoallyl)-dUTP (Jena Bioscience) using satDNA-specific clones. Hybridization was performed overnight at 68°C in a buffer containing 250 mM Na2HPO4 [pH 7.2], 1 mM EDTA, 20% SDS, 0.5% blocking reagent, and 100 ng of specific satDNA probe. Membranes were washed at 65°C in a buffer containing 20 mM Na2HPO4, 1 mM EDTA, and 1% SDS. Detection was carried out using the streptavidin-alkaline phosphatase conjugate and CDP-Star substrate (Roche). The signals were visualized with an Alliance Q9 Mini imaging system (Uvitec).
Data access
The raw Illumina sequencing data of the T. freemani genome generated in this study have been submitted to the NCBI BioProject database (https://www.ncbi.nlm.nih.gov/bioproject/) under accession number PRJNA1179347. The consensus sequences of the 135 T. freemani satDNAs generated in this study have been deposited in the NCBI GenBank (https://www.ncbi.nlm.nih.gov/genbank/) under accession numbers PQ553299–PQ553433. All supplemental figures, tables, data, and code are available as Supplemental Material and also at Figshare (https://figshare.com/s/d9b5c22dcbe842f27a8d).
Competing interest statement
The authors declare no competing interests.
Acknowledgments
This work has been fully supported by Croatian Science Foundation grant IP-2019-04-5522.
Author contributions: B.M. conceived and designed the study, supervised the project, and acquired funding. D.V. performed experimental work. D.V., E.D.-S., M.V., T.V.Z., and B.M. performed computational analyses of sequenced data and genomic analyses. L.H. performed confocal microscopy. N.M. provided resources. D.V., E.D.-S., M.V., and B.M. prepared figures, tables, and supporting information. B.M. wrote the manuscript. All authors reviewed and approved the final manuscript.
Notes
[1] Supplementary material [Supplemental material is available for this article.]
[2] Article published online before print. Article, supplemental material, and publication date are at https://www.genome.org/cgi/doi/10.1101/gr.280516.125.
References
- ↵Bao W, Kojima KK, Kohany O. 2015. Repbase Update, a database of repetitive elements in eukaryotic genomes. Mob DNA 6: 4–9. 10.1186/s13100-015-0041-9
- ↵Belyayev A, Jandová M, Josefiová J, Kalendar R, Mahelka V, Mandák B, Krak K. 2020. The major satellite DNA families of the diploid Chenopodium album aggregate species: arguments for and against the “library hypothesis”. PLoS One 15: e0241206. 10.1371/journal.pone.0241206
- ↵Benoit M, Drost HG. 2021. A predictive approach to infer the activity and natural variation of retrotransposon families in plants. Methods Mol Biol 2250: 1–14. 10.1007/978-1-0716-1134-0_1
- ↵Boštjančić LL, Bonassin L, Anušić L, Lovrenčić L, Besendorfer V, Maguire I, Grandjean F, Austin CM, Greve C, Hamadou AB, 2021. The Pontastacus leptodactylus (Astacidae) repeatome provides insight into genome evolution and reveals remarkable diversity of satellite DNA. Front Genet 11: 611745. 10.3389/fgene.2020.611745
- ↵Brajković J, Feliciello I, Bruvo-Mađarić B, Ugarković D. 2012. Satellite DNA-like elements associated with genes within euchromatin of the beetle Tribolium castaneum. G3 (Bethesda) 2: 931–941. 10.1534/g3.112.003467
- ↵Cabral-de-Mello DC, Mora P, Rico-Porras JM, Ferretti ABSM, Palomeque T, Lorite P. 2023. The spread of satellite DNAs in euchromatin and insights into the multiple sex chromosome evolution in Hemiptera revealed by repeatome analysis of the bug Oxycarenus hyalinipennis. Insect Mol Biol 32: 725–737. 10.1111/imb.12868
- ↵Camacho JPM, Cabrero J, López-León MD, Martín-Peciña M, Perfectti F, Garrido-Ramos MA, Ruiz-Ruano FJ. 2022. Satellitome comparison of two oedipodine grasshoppers highlights the contingent nature of satellite DNA evolution. BMC Biol 20: 36. 10.1186/s12915-021-01216-9
- ↵Chardon F, Japaridze A, Witt H, Velikovsky L, Chakraborty C, Wilhelm T, Dumont M, Yang W, Kikuti C, Gangnard S, 2022. CENP-B-mediated DNA loops regulate activity and stability of human centromeres. Mol Cell 82: 1751–1767.e8. 10.1016/j.molcel.2022.02.032
- ↵Clark K, Karsch-Mizrachi I, Lipman DJ, Ostell J, Sayers EW. 2016. GenBank. Nucleic Acids Res 44: D67–D72. 10.1093/nar/gkv1276
- ↵Cohen S, Yacobi K, Segal D. 2003. Extrachromosomal circular DNA of tandemly repeated genomic sequences in Drosophila. Genome Res 13: 1133–1145. 10.1101/gr.907603
- ↵Cohen Z, Bacharach E, Lavi S. 2006. Mouse major satellite DNA is prone to eccDNA formation via DNA Ligase IV-dependent pathway. Oncogene 25: 4515–4524. 10.1038/sj.onc.1209485
- ↵Dias GB, Svartman M, Delprat A, Ruiz A, Kuhn GCS. 2014. Tetris is a foldback transposon that provided the building blocks for an emerging satellite DNA of Drosophila virilis. Genome Biol Evol 6: 1302–1313. 10.1093/gbe/evu108
- ↵Dudka D, Dawicki-McKenna JM, Sun X, Beeravolu K, Akera T, Lampson MA, Black BE. 2025. Satellite DNA shapes dictate pericentromere packaging in female meiosis. Nature 638: 814–822. 10.1038/s41586-024-08374-0
- ↵Elder JFJ, Turner BJ. 1995. Concerted evolution of repetitive DNA sequences in eukaryotes. Q Rev Biol 70: 297–320. 10.1086/419073
- ↵Feliciello I, Akrap I, Brajković J, Zlatar I, Ugarković D. 2015. Satellite DNA as a driver of population divergence in the red flour beetle Tribolium castaneum. Genome Biol Evol 7: 228–239. 10.1093/gbe/evu280
- ↵Flynn JM, Yamashita YM. 2024. The implications of satellite DNA instability on cellular function and evolution. Semin Cell Dev Biol 156: 152–159. 10.1016/j.semcdb.2023.10.005
- ↵Flynn JM, Ahmed-Braimah YH, Long M, Wing RA, Clark AG. 2024. High-quality genome assemblies reveal evolutionary dynamics of repetitive DNA and structural rearrangements in the Drosophila virilis subgroup. Genome Biol Evol 16: evad238. 10.1093/gbe/evad238
- ↵Fry K, Salser W. 1977. Nucleotide sequences of HS-α satellite DNA from kangaroo rat Dipodomys ordii and characterization of similar sequences in other rodents. Cell 12: 1069–1084. 10.1016/0092-8674(77)90170-2
- ↵Gržan T, Despot-Slade E, Meštrović N, Plohl M, Mravinac B. 2020. CenH3 distribution reveals extended centromeres in the model beetle Tribolium castaneum. PLoS Genet 16: e1009115. 10.1371/journal.pgen.1009115
- ↵Gržan T, Dombi M, Despot-Slade E, Veseljak D, Volarić M, Meštrović N, Plohl M, Mravinac B. 2023. The low-copy-number satellite DNAs of the model beetle Tribolium castaneum. Genes (Basel) 14: 999. 10.3390/genes14050999
- ↵Hartley G, O'Neill RJ. 2019. Centromere repeats: hidden gems of the genome. Genes (Basel) 10: 223. 10.3390/genes10030223
- ↵Henikoff S, Ahmad K, Malik HS. 2001. The centromere paradox: stable inheritance with rapidly evolving DNA. Science 293: 1098–1102. 10.1126/science.1062939
- ↵Herndon N, Shelton J, Gerischer L, Ioannidis P, Ninova M, Dönitz J, Waterhouse RM, Liang C, Damm C, Siemanowski J, 2020. Enhanced genome assembly and a new official gene set for Tribolium castaneum. BMC Genomics 21: 47. 10.1186/s12864-019-6394-6
- ↵Hinton HE. 1948. A synopsis of the genus Tribolium Macleay, with some remarks on the evolution of its species-groups (Coleoptera, Tenebrionidae). Bull Entomol Res 39: 13–55. 10.1017/S0007485300024287
- ↵Huang Y, Ding W, Zhang M, Han J, Jing Y, Yao W, Hasterok R, Wang Z, Wang K. 2021. The formation and evolution of centromeric satellite repeats in Saccharum species. Plant J 106: 616–629. 10.1111/tpj.15186
- ↵Jagannathan M, Yamashita YM. 2021. Defective satellite DNA clustering into chromocenters underlies hybrid incompatibility in Drosophila. Mol Biol Evol 38: 4977–4986. 10.1093/molbev/msab221
- ↵João Da Silva M, Gazoni T, Haddad CFB, Parise-Maltempi PP. 2023. Analysis in Proceratophrys boiei genome illuminates the satellite DNA content in a frog from the Brazilian Atlantic forest. Front Genet 14: 1101397. 10.3389/fgene.2023.1101397
- ↵Joseph A, Mitchell AR, Miller OJ. 1989. The organization of the mouse satellite DNA at centromeres. Exp Cell Res 183: 494–500. 10.1016/0014-4827(89)90408-4
- ↵Juan C, Vazquez P, Rubio JM, Petitpierre E, Hewitt GM. 1993. Presence of highly repetitive DNA sequences in Tribolium flour-beetles. Heredity (Edinb) 70(Pt. 1): 1–8. 10.1038/hdy.1993.1
- ↵Kalitsis P, Griffiths B, Choo KHA. 2006. Mouse telocentric sequences reveal a high rate of homogenization and possible role in Robertsonian translocation. Proc Natl Acad Sci 103: 8786–8791. 10.1073/pnas.0600250103
- ↵Kasinathan S, Henikoff S. 2018. Non-B-form DNA is enriched at centromeres. Mol Biol Evol 35: 949–962. 10.1093/molbev/msy010
- ↵Katoh K, Standley DM. 2013. MAFFT multiple sequence alignment software version 7: improvements in performance and usability. Mol Biol Evol 30: 772–780. 10.1093/molbev/mst010
- ↵Kurdzo EL, Dawson DS. 2015. Centromere pairing – tethering partner chromosomes in meiosis I. FEBS J 282: 2458–2470. 10.1111/febs.13280
- ↵Lê S, Josse J, Husson F. 2008. FactoMineR: an R package for multivariate analysis. J Stat Softw 25: 1–18. 10.18637/jss.v025.i01
- ↵Li H. 2018. Minimap2: pairwise alignment for nucleotide sequences. Bioinformatics 34: 3094–3100. 10.1093/bioinformatics/bty191
- ↵Lisachov A, Panthum T, Dedukh D, Singchat W, Ahmad SF, Wattanadilokcahtkun P, Thong T, Srikampa P, Noito K, Rasoarahona R, 2024. Genome-wide sequence divergence of satellite DNA could underlie meiotic failure in male hybrids of bighead catfish and North African catfish (Clarias, Clariidae). Genomics 116: 110868. 10.1016/j.ygeno.2024.110868
- ↵Liu K, Wessler SR. 2017. Transposition of Mutator-like transposable elements (MULEs) resembles hAT and Transib elements and V(D)J recombination. Nucleic Acids Res 45: 6644–6655. 10.1093/nar/gkx357
- ↵Liu Q, Yi C, Zhang Z, Su H, Liu C, Huang Y, Li W, Hu X, Liu C, Birchler JA, 2023. Non-B-form DNA tends to form in centromeric regions and has undergone changes in polyploid oat subgenomes. Proc Natl Acad Sci 120: e2211683120. 10.1073/pnas.2211683120
- ↵Mellone BG, Fachinetti D. 2021. Diverse mechanisms of centromere specification. Curr Biol 31: R1491–R1504. 10.1016/j.cub.2021.09.083
- ↵Meštrović N, Plohl M, Mravinac B, Ugarković Đ. 1998. Evolution of satellite DNAs from the genus Palorus—experimental evidence for the “library” hypothesis. Mol Biol Evol 15: 1062–1068. 10.1093/oxfordjournals.molbev.a026005
- ↵Mravinac B, Plohl M. 2010. Parallelism in evolution of highly repetitive DNAs in sibling species. Mol Biol Evol 27: 1857–1867. 10.1093/molbev/msq068
- ↵Mravinac B, Ugarković D, Franjević D, Plohl M. 2005. Long inversely oriented subunits form a complex monomer of Tribolium brevicornis satellite DNA. J Mol Evol 60: 513–525. 10.1007/s00239-004-0236-z
- ↵Mravinac B, Meštrović N, Čavrak VV, Plohl M. 2011. TCAGG, an alternative telomeric sequence in insects. Chromosoma 120: 367–376. 10.1007/s00412-011-0317-x
- ↵Nakakita H, Imura O, Winks RG. 1981. Hybridization between Tribolium freemani Hinton and Tribolium castaneum (Herbst), and some preliminary studies on the biology of Tribolium freemani (Coleoptera: Tenebrionidae). Appl Entomol Zool 16: 209–215. 10.1303/aez.16.209
- ↵Navrátilová A, Koblížková A, Macas J. 2008. Survey of extrachromosomal circular DNA derived from plant satellite repeats. BMC Plant Biol 8: 90. 10.1186/1471-2229-8-90
- ↵Novák P, Robledillo LÁ, Koblížková A, Vrbová I, Neumann P, Macas J. 2017. TAREAN: a computational tool for identification and characterization of satellite DNA from unassembled short reads. Nucleic Acids Res 45: e111. 10.1093/nar/gkx257
- ↵Packiaraj J, Thakur J. 2024. DNA satellite and chromatin organization at mouse centromeres and pericentromeres. Genome Biol 25: 52. 10.1186/s13059-024-03184-z
- ↵Paradis E, Schliep K. 2019. ape 5.0: an environment for modern phylogenetics and evolutionary analyses in R. Bioinformatics 35: 526–528. 10.1093/bioinformatics/bty633
- ↵Pavlek M, Gelfand Y, Plohl M, Meštrović N. 2015. Genome-wide analysis of tandem repeats in Tribolium castaneum genome reveals abundant and highly dynamic tandem repeat families with satellite DNA features in euchromatic chromosomal arms. DNA Res 22: 387–401. 10.1093/dnares/dsv021
- ↵Pertile MD, Graham AN, Choo KHA, Kalitsis P. 2009. Rapid evolution of mouse Y centromere repeat DNA belies recent sequence stability. Genome Res 19: 2202–2213. 10.1101/gr.092080.109
- ↵Ramesh B, Firneno TJ, Demuth JP. 2021. Divergence time estimation of genus Tribolium by extensive sampling of highly conserved orthologs. Mol Phylogenet Evol 159: 107084. 10.1016/j.ympev.2021.107084
- ↵R Core Team. 2022. R: a language and environment for statistical computing. R Foundation for Statistical Computing, Vienna. https://www.R-project.org/.
- ↵Richards S, Gibbs RA, Weinstock GM, Brown S, Denell R, Beeman RW, Gibbs R, Bucher G, Friedrich M, Grimmelikhuijzen CJP, 2008. The genome of the model beetle and pest Tribolium castaneum. Nature 452: 949–955. 10.1038/nature06784
- ↵Rico-Porras JM, Mora P, Palomeque T, Montiel EE, Cabral-de-Mello DC, Lorite P. 2024. Heterochromatin is not the only place for satDNAs: the high diversity of satDNAs in the euchromatin of the beetle Chrysolina americana (Coleoptera, Chrysomelidae). Genes (Basel) 15: 395. 10.3390/genes15040395
- ↵Schneider CA, Rasband WS, Eliceiri KW. 2012. NIH image to ImageJ: 25 years of image analysis. Nat Methods 9: 671–675. 10.1038/nmeth.2089
- ↵Shimeld L. 1989. A cytogenetic examination of eight species of Tribolium. Tribolium Inf Bull 29: 102–107.
- ↵Silva DMZDA, Utsunomia R, Ruiz-Ruano FJ, Daniel SN, Porto-Foresti F, Hashimoto DT, Oliveira C, Camacho JPM, Foresti F. 2017. High-throughput analysis unveils a highly shared satellite DNA library among three species of fish genus Astyanax. Sci Rep 7: 12726. 10.1038/s41598-017-12939-7
- ↵Sokoloff A. 1972. The biology of Tribolium, with special emphasis on genetic aspects, Vol. 1. Clarendon Press, Oxford.
- ↵Spangenberg V, Losev M, Volkhin I, Smirnova S, Nikitin P, Kolomiets O. 2021. DNA environment of centromeres and non-homologous chromosomes interactions in mouse. Cells 10: 3375. 10.3390/cells10123375
- ↵Sproul JS, Khost DE, Eickbush DG, Negm S, Wei X, Wong I, Larracuente AM. 2020. Dynamic evolution of euchromatic satellites on the X chromosome in Drosophila melanogaster and the simulans clade. Mol Biol Evol 37: 2241–2256. 10.1093/molbev/msaa078
- ↵Talbert PB, Henikoff S. 2022. The genetics and epigenetics of satellite centromeres. Genome Res 32: 608–615. 10.1101/gr.275351.121
- ↵Ugarković D, Durajlija S, Plohl M. 1996a. Evolution of Tribolium madens (Insecta, Coleoptera) satellite DNA through DNA inversion and insertion. J Mol Evol 42: 350–358. 10.1007/PL00006062
- ↵Ugarković D, Podnar M, Plohl M. 1996b. Satellite DNA of the red flour beetle Tribolium castaneum - comparative study of satellites from the genus Tribolium. Mol Biol Evol 13: 1059–1066. 10.1093/oxfordjournals.molbev.a025668
- ↵Volarić M, Veseljak D, Mravinac B, Meštrović N, Despot-Slade E. 2021. Isolation of high molecular weight DNA from the model beetle Tribolium for nanopore sequencing. Genes (Basel) 12: 1114. 10.3390/genes12081114
- ↵Volarić M, Despot-Slade E, Veseljak D, Meštrović N, Mravinac B. 2022. Reference-guided de novo genome assembly of the flour beetle Tribolium freemani. Int J Mol Sci 23: 5869. 10.3390/ijms23115869
- ↵Volarić M, Despot-Slade E, Veseljak D, Mravinac B, Meštrović N. 2024. Long-read genome assembly of the insect model organism Tribolium castaneum reveals spread of satellite DNA in gene-rich regions by recurrent burst events. Genome Res 34: 1878–1894. 10.1101/gr.279225.124
- ↵Vollger MR, Kerpedjiev P, Phillippy AM, Eichler EE. 2022. StainedGlass: interactive visualization of massive tandem repeat structures with identity heatmaps. Bioinformatics 38: 2049–2051. 10.1093/bioinformatics/btac018
- ↵Wade MJ, Johnson NA. 1994. Reproductive isolation between two species of flour beetles, Tribolium castaneum and T. freemani: variation within and among geographical populations of T. castaneum. Heredity (Edinb) 72: 155–162. 10.1038/hdy.1994.22
- ↵Zattera ML, Bruschi DP. 2022. Transposable elements as a source of novel repetitive DNA in the eukaryote genome. Cells 11: 3373. 10.3390/cells11213373
- ↵Žinić SD, Ugarković D, Cornudella L, Plohl M. 2000. A novel interspersed type of organization of satellite DNAs in Tribolium madens heterochromatin. Chromosom Res 8: 201–212. 10.1023/A:1009244711527