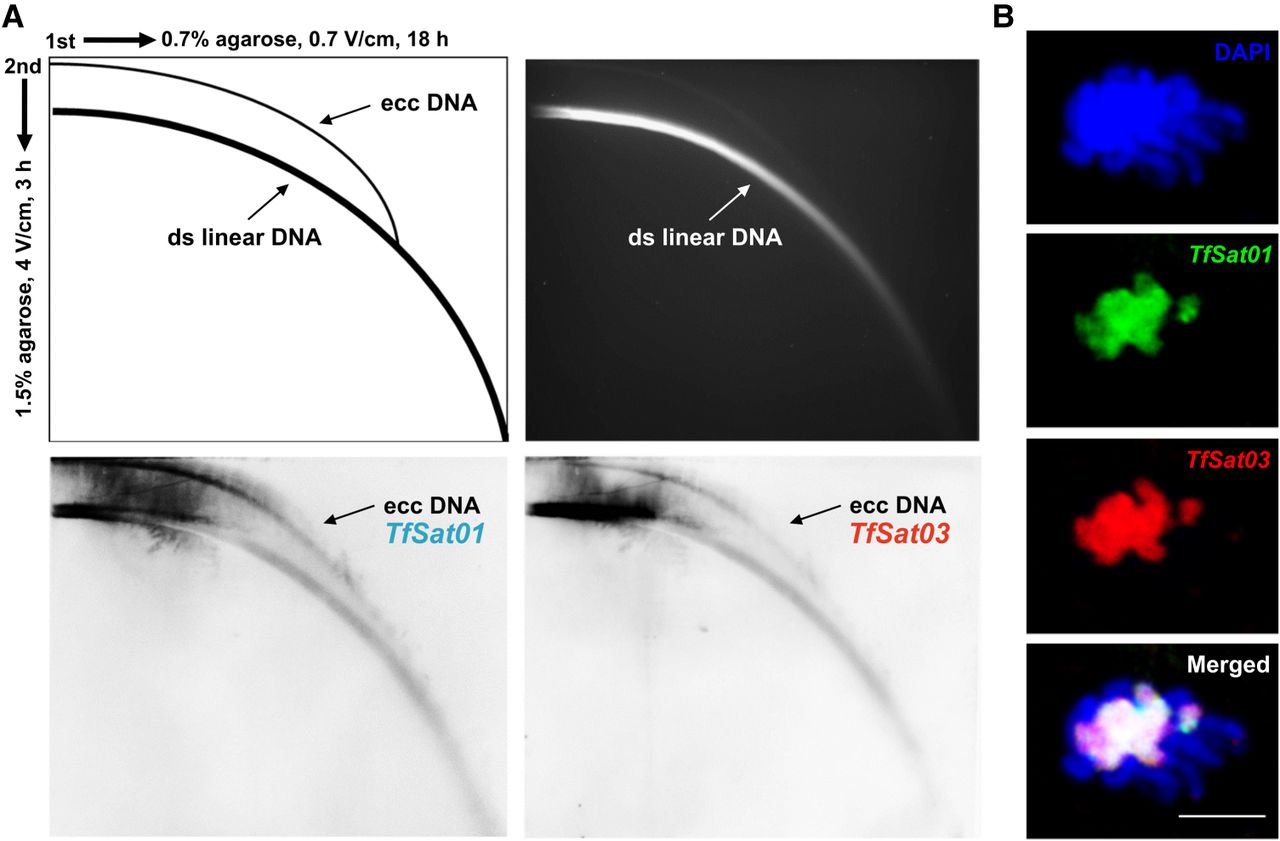
Experimental evidence of TfSat01 and TfSat03 satDNA repeats in the extrachromosomal circular DNA (eccDNA) molecules and in prophase I associations of nonhomologous chromosomes. (A) 2D gel electrophoresis analysis of the eccDNAs in T. freemani. The schematic (top left) illustrates the migration patterns of linear and circular DNA forms in 2D gel electrophoresis. The ethidium bromide stained gel (top right) with 2D-electrophoretically separated T. freemani genomic DNA was Southern-blotted and hybridized with TfSat01 (bottom left) and TfSat03 (bottom right) probes. Arrows on the blots indicate eccDNAs signals. (B) Meiotic bouquet-like configurations showing heterochromatic associations of T. freemani nonhomologous chromosomes. DAPI-stained chromosomes (top) were analyzed by two-color FISH with TfSat01 (green) and TfSat03 (red) probes. An overlap of signals is shown below. The bar represents 5 µm.