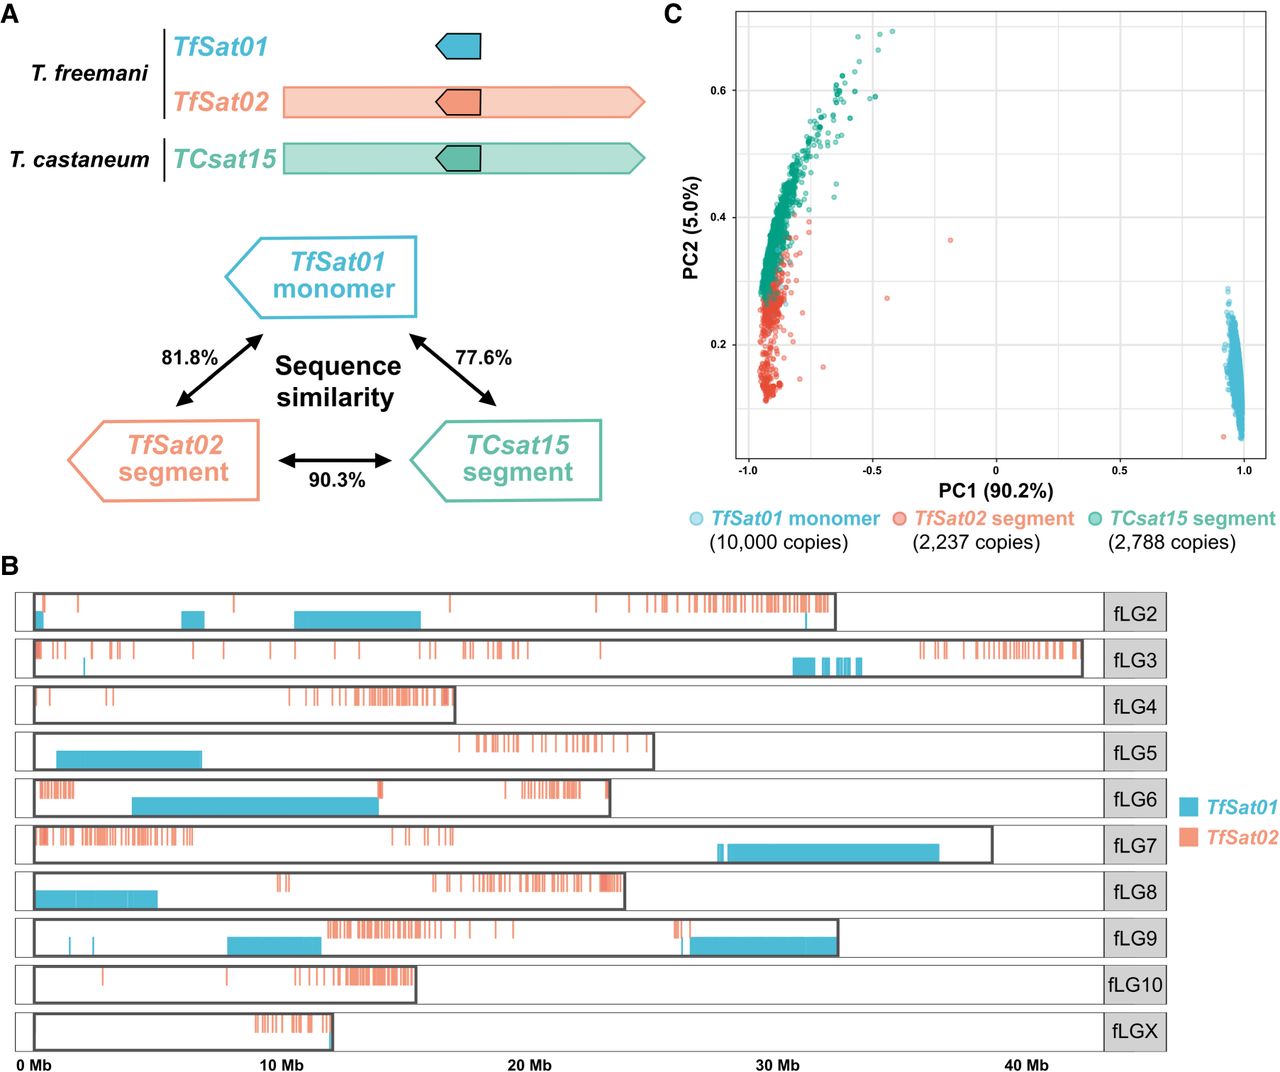
Relationship between the T. freemani satDNAs TfSat01 and TfSat02 and the T. castaneum satDNA TCsat15. (A) Schematic representation of the TfSat01, TfSat02, and TCsat15 repeat units. The blue arrow represents the TfSat01 monomer, and the red and green arrows within the TfSat02 and TCsat15 units, respectively, indicate 166-bp segments homologous to the TfSat01 monomer sequence. The percent sequence similarities are indicated. (B) Genomic distribution of TfSat01 and TfSat02 repeats along Chromosomes fLG2-fLGX in the Tfree1.0 assembly. (C) PCA clustering of TfSat01 monomers and 166-bp segments from TfSat02 and TCsat15. The analysis included 10,000 randomly selected TfSat01 monomers, 2237 TfSat02 segments from T. freemani, and 2788 TCsat15 segments from T. castaneum. Each dot represents a single sequence, and the colors indicate the repeat type.