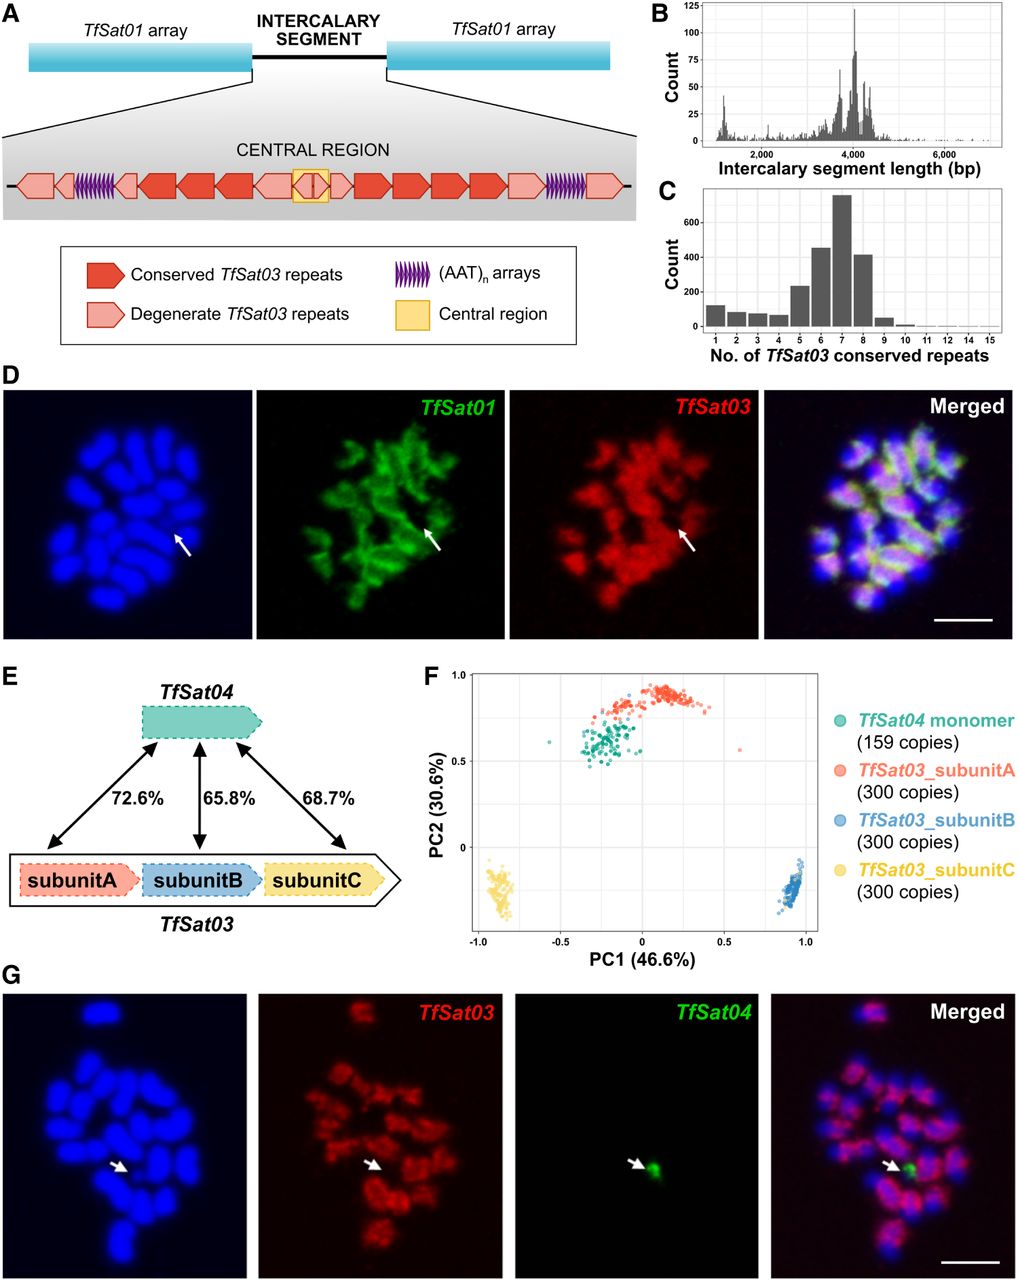
Organization and relationships between TfSat03 and TfSat04 satDNAs. (A) Schematic representation of the intercalary segments between TfSat01 arrays, containing conserved and degenerate TfSat03 repeats and (AAT)n microsatellite arrays. The yellow rectangle marks the central region where degenerate TfSat03 copies change orientation. (B) Length distribution of intercalary segments containing TfSat03 repeats. (C) The number of conserved TfSat03 repeats per segment in the analyzed intercalary segments. (D) FISH colocalization of TfSat01 (green) and TfSat03 (red) on male metaphase chromosomes stained in DAPI (blue). An arrow points to the yp Chromosome lacking TfSat01 and TfSat03 signals. The bar represents 3 µm. (E) Schematic showing structural differences and pairwise similarities between the TfSat04 monomer and the three subunits of TfSat03. (F) PCA clustering of 159 TfSat04 monomer copies and TfSat03 subunits A, B, and C extracted from 300 randomly selected TfSat03 repeats. The monomers and subunits are represented by color-coded dots. (G) FISH colocalization of TfSat03 (red) and TfSat04 (green) satDNAs on male metaphase chromosomes stained in DAPI (blue). The arrow indicates the yp Chromosome, which lacks TfSat03 but shows a TfSat04 signal exclusive to this chromosome. The bar represents 3 µm.