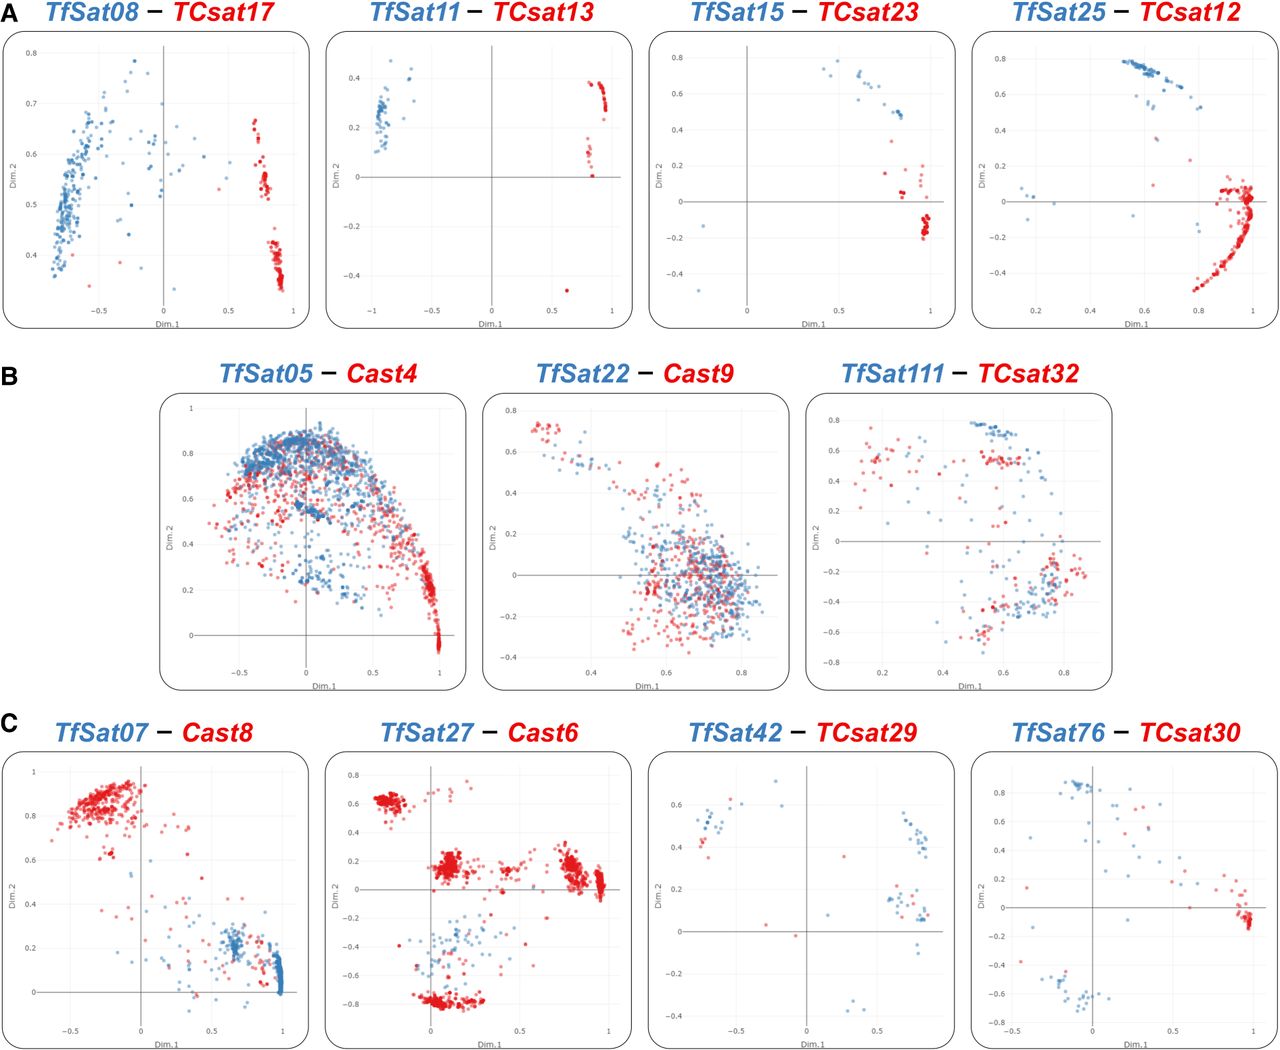
Figure 6.
PCA plots of the T. freemani satDNA (TfSat) repeats and their orthologs among known T. castaneum satDNAs (Cast, TCsat) showing: (A) species-specific clustering, (B) extensive interspecific mixing, (C) segregation of repeats from one species in more than one cluster. Names of satDNA orthologs are indicated above each plot. Dots represent monomer copies from the T. freemani Tfree1.0 (blue) and T. castaneum TcasONT (red) assemblies. PCA is based on alignments in Supplemental Data S4, and interactive plots can be found in Supplemental Data S5.