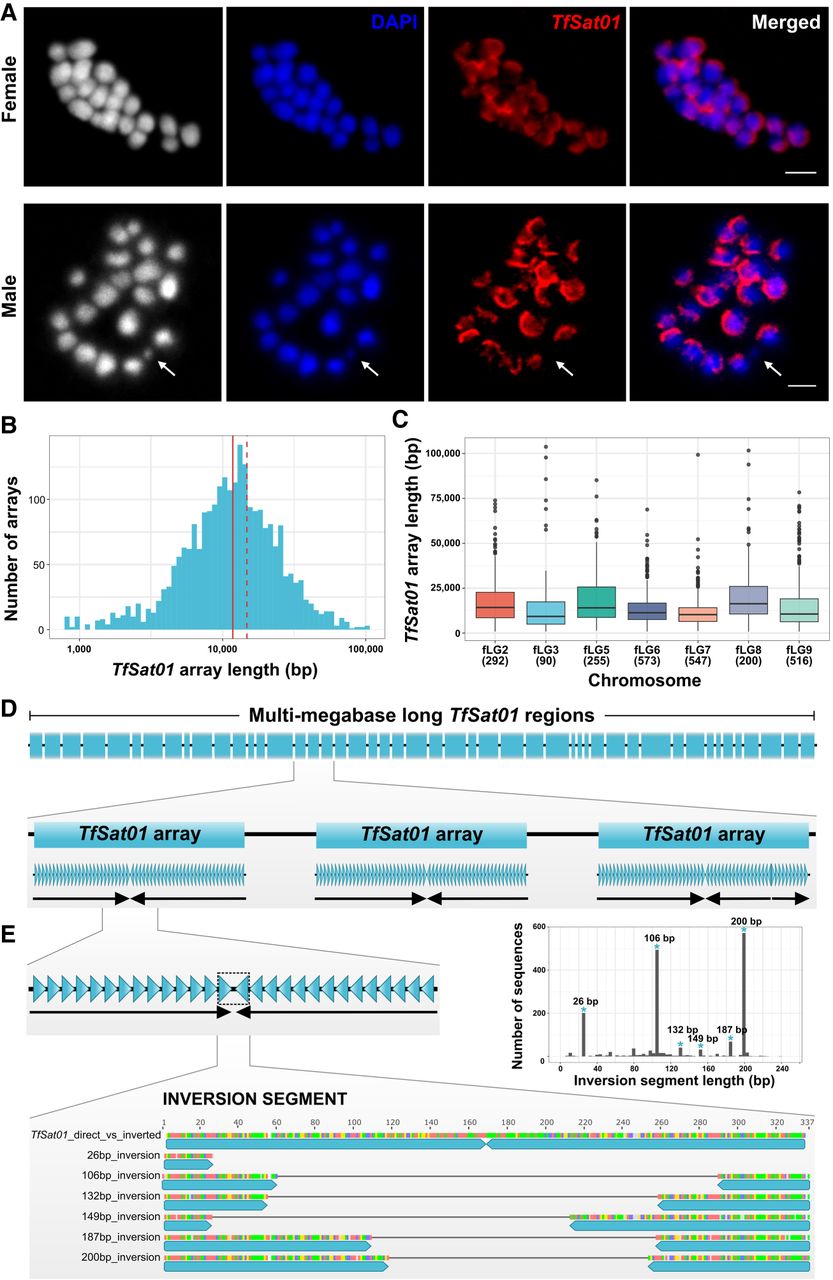
Organization of the major satDNA TfSat01 in the T. freemani genome. (A) FISH localization of TfSat01 on female (2n = 18+XX) and male (2n = 18+Xyp) metaphase chromosomes. The first panels show black and white version of chromosomes to better visualize their contours, especially the male minute Chromosome yp. Chromosomes are DAPI-stained (blue), and TfSat01 signals are shown in red. A white arrow points to the yp Chromosome lacking the TfSat01 signal. Scale bar represents 3 µm. (B) Length distribution of TfSat01 arrays in the Tfree1.0 assembly. The median (11.8 kb) is marked by a solid red line, and the mean (14.8 kb) by a dashed line. (C) Box plot showing TfSat01 array length distribution across T. freemani chromosomes (fLGs). Medians are indicated by black lines within the boxes, and the number of arrays analyzed is shown in parentheses below a chromosome name. (D) Schematic illustrating the long-range organization of the multi-megabase-long regions containing TfSat01 arrays. Within TfSat01 arrays (blue rectangles), TfSat01 monomers (blue triangles) are organized into subarrays (black arrows) that differ in monomer orientation. Thus, the term “TfSat01 array” refers to an uninterrupted array of TfSat01 monomers, regardless of how many subarrays it includes. (E) Organization of inversion segments in which TfSat01 monomers change orientation within TfSat01 arrays. The graph shows the length distribution of the inversion segments from the 1793 TfSat01 arrays, with the six most frequent types indicated. The positions of truncated TfSat01 monomers in the most frequent inversion segments are shown in the schematic alignment. Detailed alignments can be found in Supplemental Figure S7A and Supplemental Data S1.