
Abstract
Microglia-driven dysregulation has emerged as a significant underlying mechanism in many neurodegenerative diseases, such as age-related macular degeneration (AMD) and Alzheimer's disease (AD). Although both brain and retinal microglia originate from the yolk sac, it is uncertain whether they share molecular similarities or genetic and molecular foundations related to neurodegenerative diseases. In this study, we examine the transcriptomic and epigenetic profiles of retina and brain microglia through integrative analyses of single-nucleus RNA sequencing (snRNA-seq) and single-nucleus ATAC sequencing (snATAC-seq) from 97 independent human samples across 11 different studies. Our findings reveal that retina and brain microglia share similar expression and regulatory profiles compared with other cell types in the retina and brain. By integrating genome-wide association study (GWAS) data with gene expression profiles, we demonstrate that genetic variants associated with AMD and AD are linked to microglia-specific gene signatures. Furthermore, integrating regulatory annotations with GWAS data shows that susceptibility loci for both AMD and AD are notably enriched in the open chromatin regions of microglia from the brain and retina, emphasizing their relevance to these neurodegenerative conditions. Finally, a comparison with microglia annotations from other tissues highlights the specific enrichment of microglia in relation to neurodegenerative diseases. These findings contribute to the understanding of the role of microglia in AMD and AD pathogenesis and offer an opportunity to utilize resources from both retinal and brain microglia to deepen our understanding of their contributions to genetic variations in neurodegenerative diseases.
Dysregulated immune function and neuroinflammation have emerged as a common underlying mechanism in aging (Ponnappan and Ponnappan 2011) and various neurodegenerative diseases (Labzin et al. 2018), including age-related macular degeneration (AMD) (Nussenblatt et al. 2014) and Alzheimer's disease (AD) (Bettcher et al. 2021). Recent studies suggest that inflammation and immune regulation are causes of the diseases rather than merely responses to degeneration (Zhang et al. 2023). As a result, there is growing interest in unraveling the intricate involvement of the immune system in the development and progression of these conditions (Hammond et al. 2019). AMD affects almost 10 million individuals in the United States and is expected to double by 2050 (Friedman et al. 2004). At the same time, nearly 7 million Americans currently live with AD, a number projected to reach 13 million by 2050 (Alzheimer's Association 2023). Given the limited therapeutic options, these diseases contribute to a significant financial burden, underscoring the need for a better understanding of their underlying mechanisms to inform potential treatments.
Microglia represent the resident immune cells in both the retina and brain, akin to macrophages. They are derived from erythromyeloid precursors in the yolk sac and migrate to the brain and retina at early embryonic stages (Ginhoux et al. 2010). The retina is considered an extension of the CNS and shares features related to anatomical composition, neurological functions, as well as immunological aspects (London et al. 2013). Microglia actively participate in synaptic pruning by phagocytosing the cellular debris in early development in the brain (Paolicelli et al. 2011) and retina (Anderson et al. 2019). Later it assumes a quiescent state in providing immunological surveillance to the entire retina, promoting neuroprotection and a rapid return to homeostasis (Li et al. 2019). However, in disease conditions, they can get activated, migrate to the site of degeneration, and undergo morphological transformation, leading to excessive release of inflammatory mediators and exacerbation of neurodegeneration (Rashid et al. 2019). More recently, the neuroprotective role of microglia in retinal degeneration has been elucidated (Yu et al. 2024).
Microglia have recently emerged as a key player in the pathogenesis of AMD (Kuchroo et al. 2023; Yu et al. 2024; Ma et al. 2025) and AD (Hansen et al. 2018). A putative role for the immune system in the pathogenesis of AMD has been suggested since the 1980s (Penfold et al. 1985), and substantial clinical evidence underscores the involvement of immunologic processes such as the production of inflammatory molecules, recruitment of macrophages, complement activation, and microglial activation in AMD pathology (Parmeggiani et al. 2012). More recently, their critical role has been substantiated by a flurry of research using genome-wide association studies (GWAS), which have implicated immune, complement, cholesterol and lipid metabolism, extracellular/collagen matrix, and angiogenesis pathways in AMD pathogenesis (Fritsche et al. 2016). Of particular note are complement and immunoinflammatory genes like CFH, CFI, CFB, C3, HTRA1, and APOE, which exhibit significant effect sizes (Fritsche et al. 2016), are predominantly expressed in retinal immune cells (Menon et al. 2019), and play pivotal roles in regulating immune responses (Killick et al. 2018). Similarly, microglia play a critical role in complement-mediated synapse loss around plaques in AD (Hansen et al. 2018). Morphological changes in microglia were described by Alois Alzheimer as one of the histopathologic features for the AD (Alzheimer et al. 1995). Subsequent human genetic studies, mostly driven by GWAS, have confirmed the involvement of amyloid/tau and microglia activation pathways and identified microglia as the only significant disease-relevant tissues in the single-cell expression analysis of brain (Bellenguez et al. 2022). Additionally, extracellular deposits represent a common pathological hallmark for both diseases, manifesting as drusen in AMD (Abdelsalam et al. 1999) and as amyloid plaques in AD (Busche and Hyman 2020).
Despite their common origin and increasing evidence of their roles in neurodegeneration, it remains uncertain whether brain and retinal microglia share molecular or genetic similarities, as comparative studies in health and disease are still limited. As the majority of AMD- and AD-associated variants are noncoding (Fritsche et al. 2016; Bellenguez et al. 2022), they are likely to be enriched in the cis-regulatory elements (CREs), such as promoter, enhancer, and silencer elements of the disease-relevant tissues and cell types, and exert their effects through gene expression regulation (Albert and Kruglyak 2015; Ratnapriya et al. 2019, 2025). In this study, we analyzed the transcriptomes and epigenomes of microglia from the retina and brain across multiple donors, compared their molecular profiles between the two tissues, and explored their involvement in AMD and AD.
Results
Retina and brain microglia share transcriptional signatures
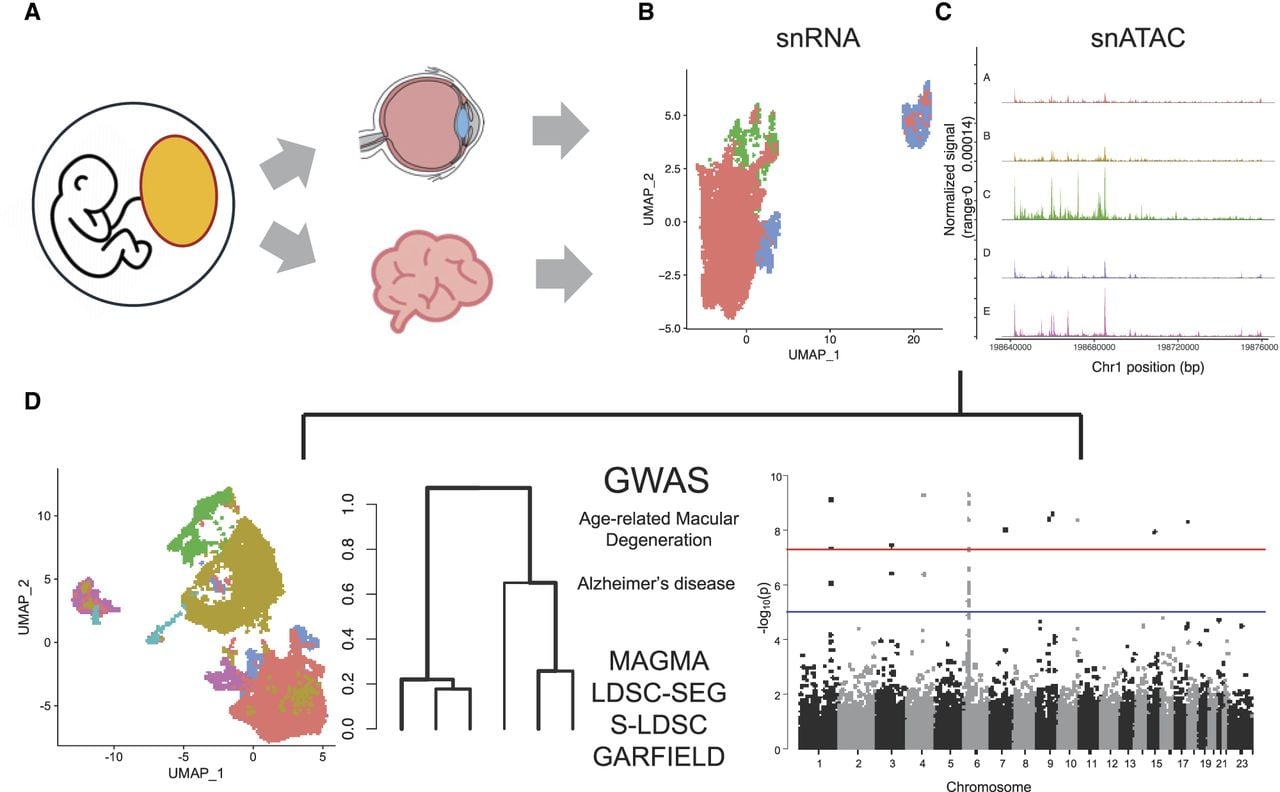
We analyzed data from 97 independent human samples from retina (Fig. 1A) across 11 different studies and analyzed their transcriptome (single-nucleus RNA sequencing [snRNA-seq]) (Fig. 1B) and epigenome (single-nucleus ATAC sequencing [snATAC-seq]) (Fig. 1C). Finally, we explored the disease implications of retinal microglia in AD and brain microglia in AMD using respective GWAS data from genetic studies (Fig. 1D; Fritsche et al. 2016; Bellenguez et al. 2022).
Overview of the study. (A) Retina and brain microglia share a common origin from the yolk sac. (B,C) Integration of single-nucleus RNA sequencing (snRNA-seq) and single-nucleus ATAC sequencing (snATAC-seq) data from 97 human retina and brain microglia samples. (D) Integration of genome-wide association study (GWAS) data for age-related macular degeneration (AMD) and Alzheimer's disease (AD) with transcriptomic and epigenetic annotations using various enrichment methods.
Microglia constitute ∼0.2%–0.4% of total retinal cells (Li et al. 2019; Wang et al. 2023). To ensure an adequate number of cells for analysis, we integrated the snRNA-seq of 28 human retinas from five different data sets (Supplemental Table S1; Orozco et al. 2020; Wang et al. 2022; Kuchroo et al. 2023; Yu et al. 2024) and implemented fast integration pipeline in Seurat 4.4 (Stuart et al. 2019) to harmonize the data (Supplemental Fig. S1). In total, we analyzed 214,635 cells and identified 11 cell types using cell type–specific markers (Supplemental Table S2; Macosko et al. 2015; Yan et al. 2020), including amacrine, astrocyte, cones, horizontal, microglia, Müller glia, OFF cone bipolar, ON cone bipolar, retinal ganglion, rod bipolar, and rod cells (Supplemental Table S3; Supplemental Fig. S2). For the brain, we analyzed 125,343 cells from three data sets (Velmeshev et al. 2023; Haney et al. 2024; Sepp et al. 2024), comprising samples from 24 individuals (Supplemental Table S1). We annotated six distinct brain cell types, including astrocytes, endothelial cells, excitatory neurons, inhibitory neurons, microglia, and oligodendrocytes using cell type–specific markers from published studies (Supplemental Tables S2, S3; Supplemental Fig. S3; Haney et al. 2024). Next, we integrated and clustered cells from the retina and brain, applying batch effect correction, and visualized them using uniform manifold approximation and projection (UMAP) plots generated with the Seurat package (Hafemeister and Satija 2019). Our analysis revealed overlapping microglia cell clusters between the retina and brain, indicating similar transcriptional signatures (Fig. 2A). To identify molecular similarities among different cell types in the retina and brain, we performed a cross-tissue analysis for both integrated data sets, using a tree-based method, SpeciesTree (Bakken et al. 2021). The resulting hierarchical clustering revealed that retina and brain microglia were closely related compared with other cell types (Fig. 2B).
Shared transcriptome signature of retina and brain microglia. (A) The snRNA-seq analysis of retina and brain. The plot shows uniform manifold approximation and projection layouts (UMAP) for the 11 retina cell types and six brain cell types, with overlapping microglia cluster highlighted in a red circle. (B) Hierarchical clustering of cell type clusters from the retina and brain reveals distinct yet overlapping patterns of similarity. Notably, retina and brain microglia cluster together on the same branch, indicating a close relationship between these cell types across both tissues. (C) Dot plot of module scores displaying the z-scores for transcriptional signatures based on differentially expressed genes and curated markers, visualizing the expression profiles of annotated microglia subclusters. The color and size of each dot correspond to the average expression level and fraction of expressing cells, respectively. (D) High-resolution UMAP plots showing the distinct clustering of microglia, PVMs, and monocytes in the retina. (E) High-resolution UMAP plots of microglia, PVMs, and monocytes in the brain. (F) The UMAP plots show that the clusters of microglia, PVMs, and monocytes from both the retina and brain overlap perfectly, indicating a high degree of similarity in their subcluster organization across these two tissues. (RGC) Retinal ganglion cell, (hMG1) human retinal microglia clusters marker 1, (hMG2) human retinal microglia clusters marker 2 (hMG3) human retinal microglia clusters marker 3, and (PVM) perivascular macrophages.
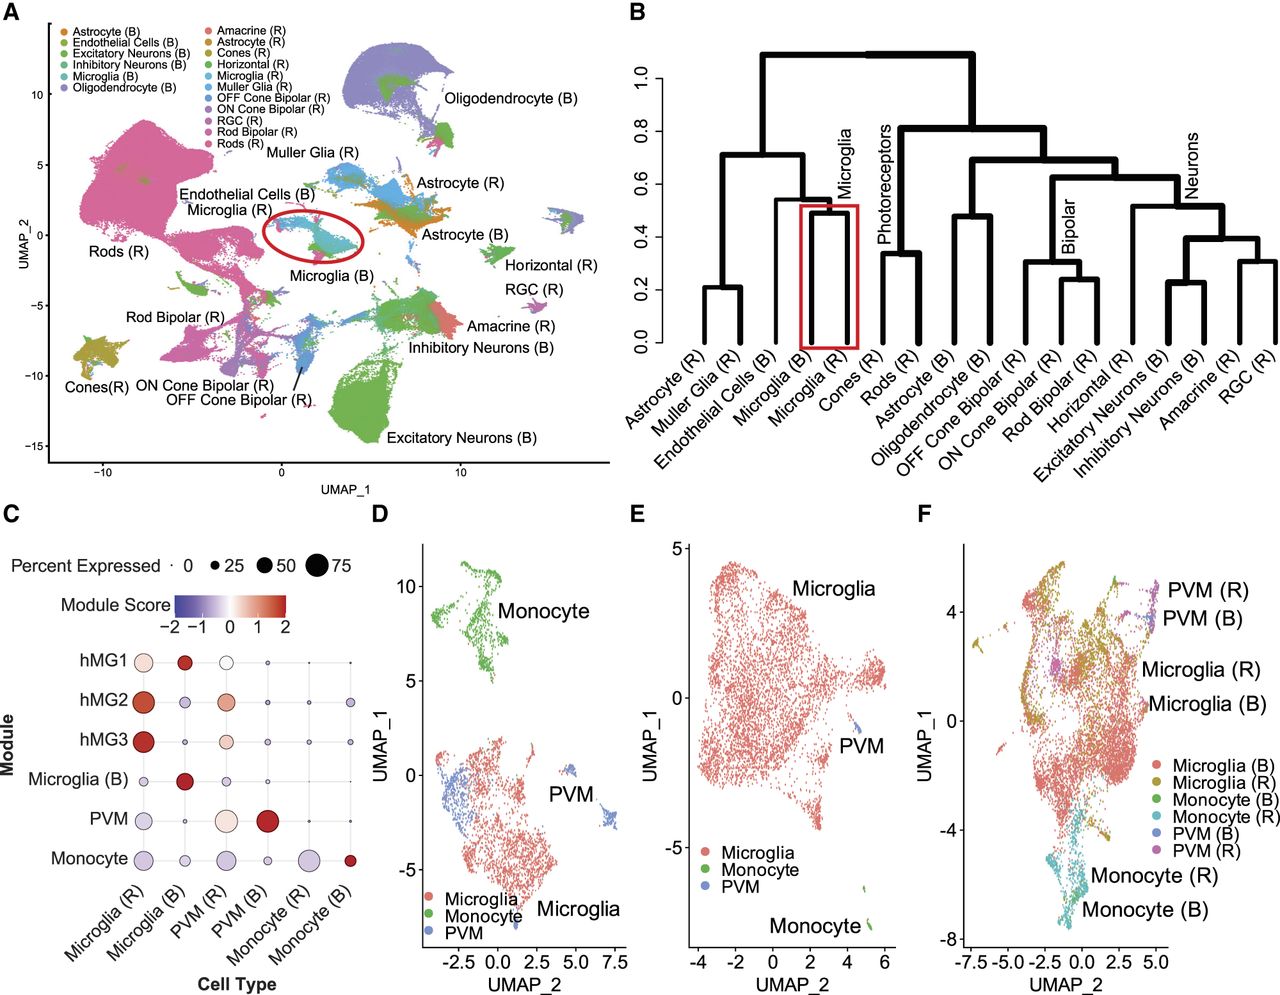
Microglia and monocytes are both members of the mononuclear phagocyte system and share essential tissue-specific functions that are critical for homeostasis and the response against pathogen evasion (Guilliams et al. 2014). Thus, we further refined the microglia cluster to distinguish yolk sac–derived microglia (Ginhoux et al. 2010) from perivascular macrophages (PVMs) and monocyte-derived myeloid precursors (Guilliams et al. 2014). We annotated these cell types based on the module scores (Fig. 2C) calculated using the top differentially expressed genes identified in human donor retina data from retina (Yu et al. 2024) and brain microglia (Böttcher et al. 2019) as well as cell type–specific marker genes (Supplemental Table S2; Butovsky and Weiner 2018; O'Koren et al. 2019; Hao et al. 2021; Bloomfield et al. 2024; Yu et al. 2024) for the retina (Fig. 2D) and brain (Fig. 2E). Upon merging, 2064 retina microglia cells clustered with 4927 cells from brain microglia, forming a distinct and unified microglial group. Transcriptomic signatures from these microglia subcluster in the retina and brain were used in all subsequent analyses to ensure greater specificity and resolution. Additionally, retina PVMs clustered with brain PVMs, as well as retina monocytes with brain monocytes, each forming separate and distinguishable groups (Fig. 2F). Taken together, our analyses shows that the transcriptome profile of retina microglia closely resembles that of brain microglia.
Chromatin accessibility is similar in retina and brain microglia
RNA expression is regulated by the changes in chromatin accessibility at gene promoters and other distal regulatory elements, such as enhancers. Furthermore, snRNA may not fully capture a cell's transcriptional profile, as it primarily detects mRNA levels. Thus, to understand a comprehensive picture of transcriptional regulation that dictates microglia identity, we compared global chromatin accessibility profiles of the retina and brain using the assay for transposase-accessible chromatin using sequencing (ATAC-seq) (Buenrostro et al. 2013). We integrated chromatin accessibility data from 38 human retinas from three different studies (Orozco et al. 2020; Wang et al. 2022, 2023) and eight samples from three human brain data sets (Supplemental Table S1; Supplemental Fig. S4; Corces et al. 2020; Morabito et al. 2021; Zhu et al. 2023). After performing initial analyses with SEURAT (Hafemeister and Satija 2019; Stuart et al. 2021), we annotated 11 cell types in the retina (Supplemental Table S2; Supplemental Fig. S5) and six cell types in the brain (Supplemental Table S2; Supplemental Fig. S6), using cell type–specific markers for the retina (Macosko et al. 2015; Yan et al. 2020) and brain (Haney et al. 2024). This analysis identified 275,579 and 366,041 peaks in the retina and brain, respectively. Next, we integrated the data by clustering 255,747 retina and brain cells (Supplemental Table S3), correcting for batch effects, and visualized the results with UMAP plots generated using Seurat (Hafemeister and Satija 2019). This analysis revealed overlapping microglia cell clusters between the retina and brain, indicating shared epigenetic signatures (Fig. 3A). Hierarchical clustering further supported this, with microglia from both retina and brain clustering in a distinct branch separate from other cell types in these tissues (Fig. 3B).
snATAC-seq analysis of the retina and brain. (A) UMAP of annotated clusters based on chromatin accessibility data from retina and brain cell types, with a red circle highlighting the overlap between retina and brain microglia clusters. (B) Hierarchical clustering of chromatin accessibility data shows that retina and brain microglia form a separate, closely related cluster, highlighted in a red box, distinct from other cell types. (C) Module scores based on differentially expressed gene lists and our curated marker list are visualized using a dot plot for the annotated microglia, PVMs, and monocyte clusters. The color and size of each dot correspond to the average expression level and fraction of expressing cells, respectively. (D) High-resolution UMAP plots of chromatin accessibility data highlight the distinct clustering of microglia, PVMs, and monocytes within the retina. (E) Higher-resolution UMAP plots of brain ATAC-seq data shows distinct clustering of microglia, PVMs, and monocytes. (F) UMAP plots reveal that the chromatin accessibility profiles of microglia and PVMs overlap closely between the retina and brain, suggesting conserved subcluster organization across these tissues. (RGC) Retinal ganglion cell, (hMG1) human retinal microglia clusters marker 1, (hMG2) human retinal microglia clusters marker 2, (hMG3) human retinal microglia clusters marker 3, and (PVM) perivascular macrophages.
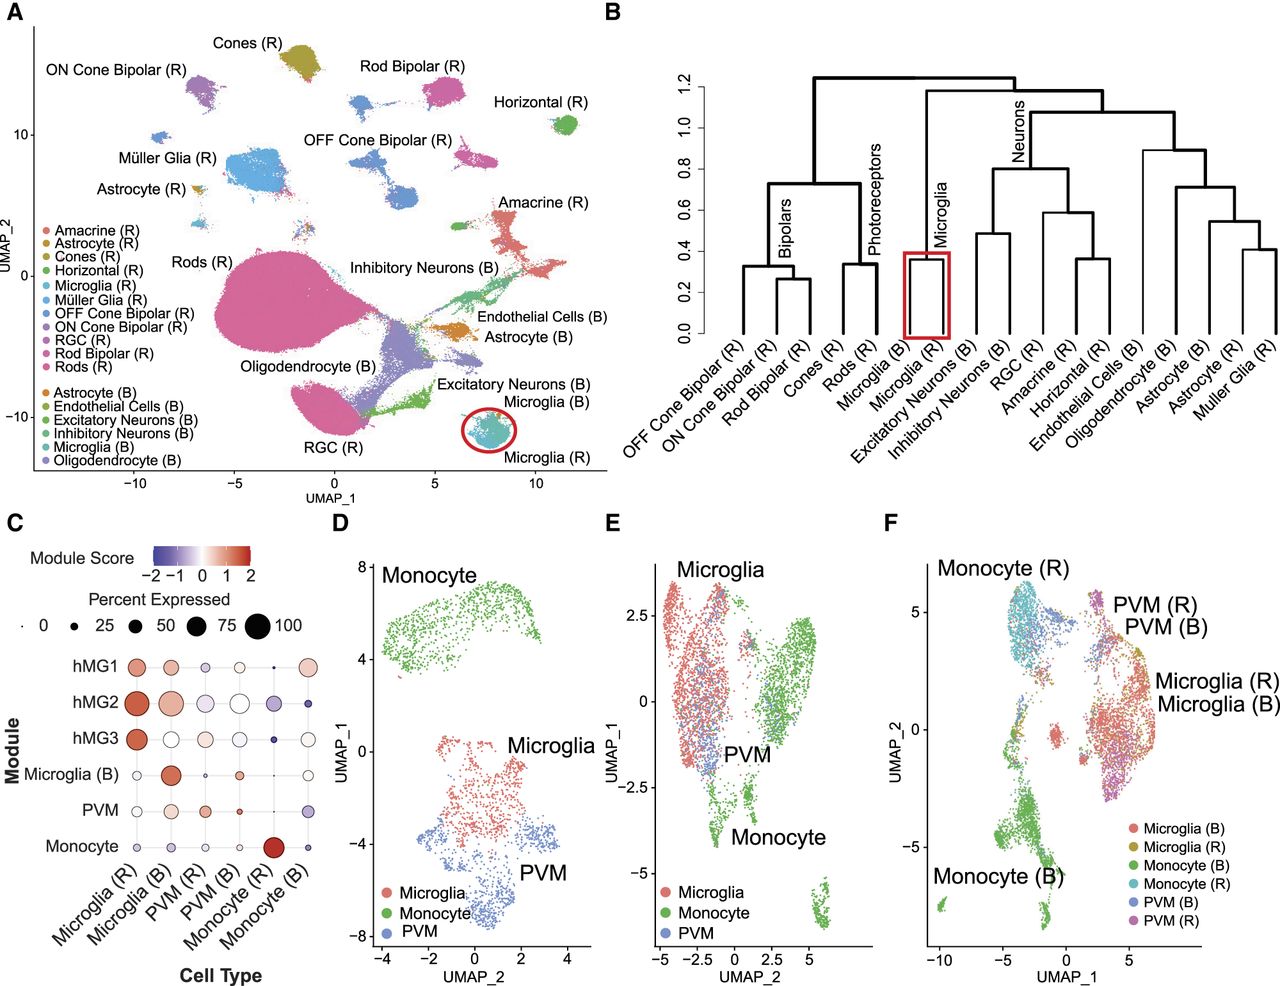
Similar to transcriptome, we next performed unsupervised clustering at higher resolution followed by annotation based on module scores derived from retina (Yu et al. 2024) and brain microglia (Böttcher et al. 2019), as well as cell type–specific marker genes (Fig. 3C; Supplemental Table S3; Butovsky and Weiner 2018; O'Koren et al. 2019; Hao et al. 2021; Bloomfield et al. 2024; Yu et al. 2024). In our analysis of the retina, we were able to identify distinct immune cell populations, including microglia, monocytes, and PVMs as distinct clusters (Fig. 3D). A comparable assessment in the brain revealed the presence of these immune cell populations (Fig. 3E). A combined projection of the two tissues onto the UMAP showed significant overlap of 702 retina microglia with the 1887 brain microglia, with a clear distinction from the other cell types (Fig. 3F), confirming the similarity seen in the transcriptome level. For all subsequent analyses, microglia were referred to the annotations derived from these subclusters. We also observed that unlike in the transcriptomic data, in which monocytes from the retina and brain clustered together (Fig. 3F), in the ATAC-seq data, they were distinctly separated. This separation was further supported by differential analysis, which identified 99 differentially expressed genes between retina and brain monocytes compared with 1421 differentially accessible regions (DARs) in the snATAC-seq data (Supplemental Fig. S7). Notably, in the transcriptomic data set, the number of retina and brain samples was comparable, with 28 and 24, respectively. However, in the ATAC-seq data, we had a much larger number of from the retina—38 in total—compared with only eight samples from the brain. Therefore, the observed separation of monocytes in the ATAC-seq data may be influenced by sample imbalance or may reflect tissue-specific epigenetic programming in response to the distinct local environments of the retina and brain. These findings demonstrate that the gene expression and chromatin accessibility of the retina and brain microglia cells are similar. Furthermore, despite their functional similarities, macrophages and microglia have distinct expression profiles, indicating cell type–specific functions.
Molecular signatures of retina and brain microglia
To gain deeper insight into the similarities and differences between microglia in the retina and brain at the molecular level, we examined global gene expression profiles using correlation heatmaps. For these analyses, we obtained the average gene expression for all cell types in the retina and brain and computed the Spearman's rank correlation for all possible pairs. Correlation between microglia, monocytes, and PVMs was significantly higher between the brain and retina compared with other cell types (Fig. 4A; Supplemental Fig. S8). We observed a clear separation between this cluster in which correlations within microglia and related-cell types were significantly higher than correlations between all other cell types of the retina and brain regardless of the tissues (P = 1.06 × 10⁻¹⁰). Specifically, the correlation of retina and brain microglia reached the value of 0.88 (Fig. 4B; Supplemental Fig. S8). For the ATAC-seq data, we observed the same pattern with brain and retina microglia, monocytes, and PVMs, showing higher (Fig. 4C) and significantly different correlations compared with other cell types (P = 3.5 × 10⁻¹⁶). The correlation between the brain and retina microglia was 0.96 (Fig. 4D).
Molecular similarities and differences in retina and brain microglia. (A) Correlation heatmap of gene expression between retina and brain cell types from snRNA-seq data. The color scale ranges from blue (low correlation) to red (high correlation). Column labels correspond to retina cell types, and row labels represent brain cell types. (B) XY plot depicting the log2-transformed gene expression profiles of microglia from the retina (y-axis) and brain (x-axis). The correlation coefficient, displayed at the top of the plot. (C) Heatmap of correlations from the inferred gene activity matrix in snATAC-seq data, with a color scale from blue (low) to red (high). (D) XY plot of log2-inferred gene activity from ATAC-seq chromatin accessibility profiles for the retina (y-axis) and brain (x-axis) microglia, with the correlation coefficient at the top denoting their similarity. (E) Venn diagram illustrating the overlap between 596 retina microglia–specific genes (compared with other retina cell types) and 470 brain microglia–specific genes (compared with other brain cell types). (F) Venn diagram illustrating the overlap between 596 retina microglia–specific genes (vs. other retina cell types) and 374 genes upregulated in retina microglia compared with brain microglia (differentially expressed genes between brain and retina microglia). (G) Venn diagram showing the overlap between 470 brain microglia–specific genes (vs. other brain cell types) and 547 genes upregulated in brain microglia relative to retina microglia (differentially expressed genes between brain and retina microglia). (H) Dot plot showing scaled gene expression of the top 20 genes upregulated in retina microglia compared with other retina cell types and brain microglia. (I) Dot plot of the top 20 genes upregulated in brain microglia compared with other brain cell types and retina microglia. (J) Dot plot displaying marker genes for microglia, with the top panel representing retina microglia and the bottom panel representing brain microglia. (K) Bar plot illustrating the number of shared and unique ligands and receptors between retina and brain microglia. (RGC) Retinal ganglion cell.
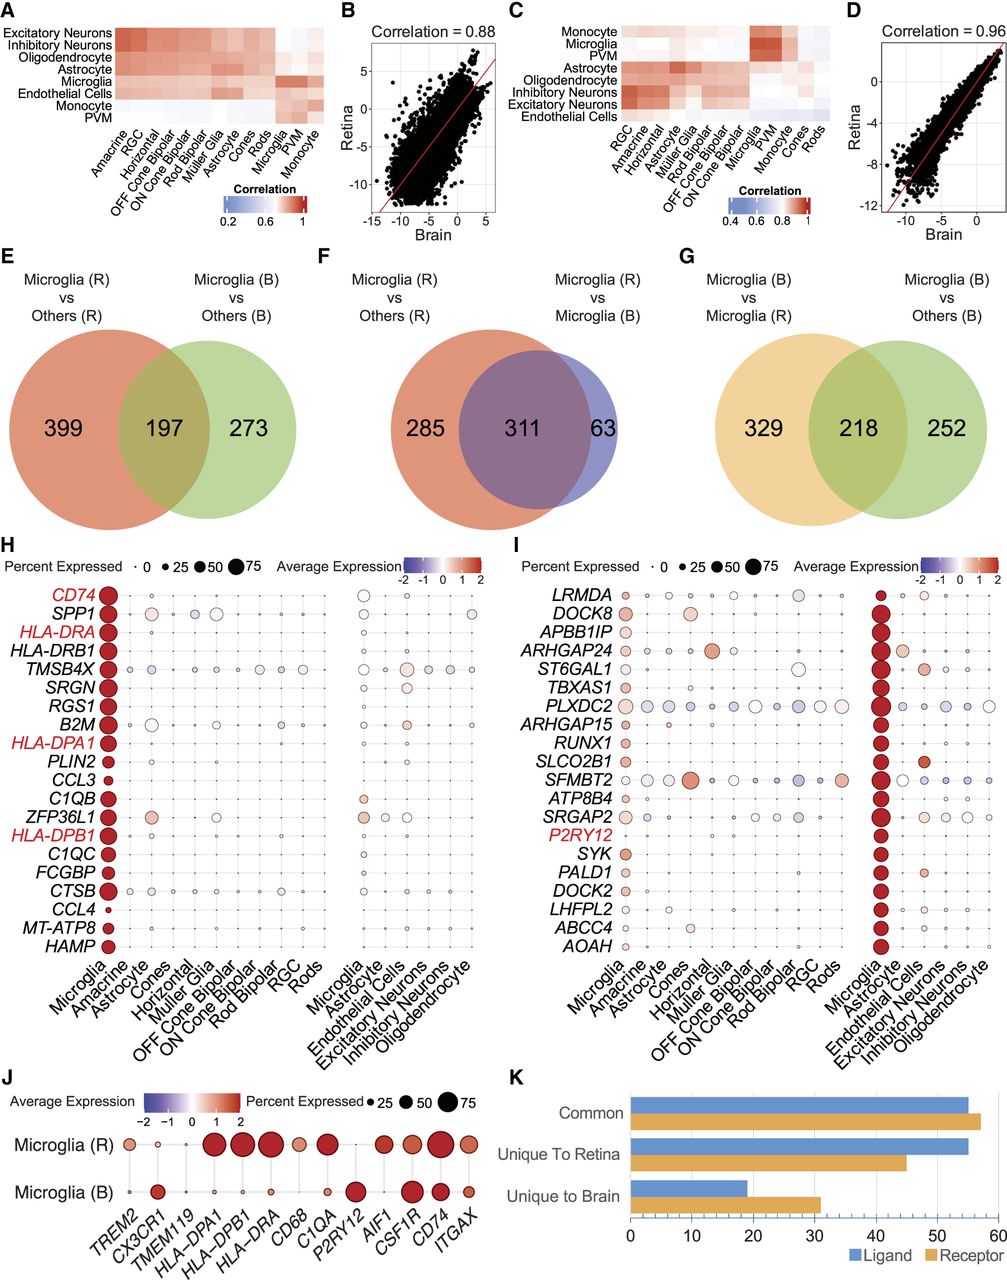
A differential expression (DE) analysis of gene expression profiles identified 596 genes that were upregulated (more than twofold) in retina microglia compared with other retinal cell types (Fig. 4E; Supplemental Table S4). Similarly in the brain, 470 genes were upregulated in microglia compared with other brain cell types (Fig. 4E; Supplemental Table S4). One hundred ninety-seven of these genes were shared between the retina and brain microglia (Fig. 4E). Next, we performed DE analyses between retina and brain microglia that identified 374 genes upregulated in retina microglia and 547 in brain microglia (Supplemental Table S4). We then compared these two gene lists, identifying 311 genes upregulated in retina microglia relative to other cell types in the retina and brain microglia (Fig. 4F). In the brain microglia, we identified 218 genes that were upregulated compared with other brain cell types and retina microglia (Fig. 4G). Among the top 20 differentially regulated genes (Fig. 4H,I), many were immune-related and included several known microglia marker genes (Supplemental Fig. S9). In the retina microglia, we identified upregulation of CD74, C1QA, and MHC class II molecules (HLA-DRA, HLA-DPA1, and HLA-DPB1) whereas P2RY12 and CX3CR1 were upregulated in brain microglia (Fig. 4J; Supplemental Table S4).
Considering the dynamic role of transcription factors (TFs) in determining transcriptional program and regulation, we next compared the TF motifs of retina and brain microglia using Signac (Stuart et al. 2021). Among these, 140 motifs were shared between the two tissues, each showing greater than twofold enrichment (Supplemental Table S5). These included motifs for TFs previously associated with microglial function, such as HINFP, EGR2, HES1, and PLAG2 (Manouchehri et al. 2023). These findings support our characterization of both the similarities and differences between retina and brain microglia, with shared motifs reflecting substantial commonalities. Finally, we compared the intracellular communications between retinal and brain microglia using LRLoop (Xin et al. 2022), which utilizes transcriptome data from both ligand sender and receiver cells. In the retina, we identified 110 ligands and 102 receptors specific to microglia compared with other retinal cell types. In the brain, microglia exhibited 74 ligands and 88 receptors (Supplemental Table S6). Of these, 55 ligands and 57 receptors were shared between retinal and brain microglia (Fig. 4K). These shared interactions were enriched in Gene Ontology (GO) terms related to immune regulation and phagocytosis (Supplemental Table S6). Taken together, our data identify unique signatures in retina and brain microglia and highlight the molecular diversity despite the common origin.
Retina and brain microglia are dominant pathogenic cell type for AMD and AD
As our understanding of immune system dysfunction in relation to AMD (Nussenblatt et al. 2014) and AD (Bettcher et al. 2021) pathology grows, the role of microglia in the pathogenesis of AMD (Yu et al. 2024) and AD (Hansen et al. 2018) has garnered considerable attention. However, the molecular similarities between microglia's roles in AMD and AD are still not fully elucidated. Therefore, we set out to examine the molecular-genetic mechanisms of AMD and AD in the context of retina and brain microglia. We examined the relationship between the microglia-enriched/specific gene expression signatures and the disease risk for AMD and AD. We generated the microglia-enriched/specific signature using the “FindMarkers” (Butler et al. 2018) function, which compared the microglia cluster against all other clusters to identify potential marker genes (Supplemental Table S4). We also included three gene sets: 197 genes common to both retina and brain microglia (Fig. 4E), as well as genes upregulated in either retina or brain microglia compared with the other, with 374 upregulated in retina and 547 in brain microglia (Fig. 4F,G).
Next, we employed two enrichment methods to evaluate whether cell type–specific or enriched gene sets from the retina and brain show significant association with AMD and AD. First, we used multimarker analysis of GenoMic annotation (MAGMA) (de Leeuw et al. 2015), which uses a multiple regression approach to properly incorporate LD between markers and to detect multimarker effects. For this analysis, we used summary statistics from two GWAS studies: one with 16,144 AMD patients and 17,832 controls, identifying 34 AMD loci (Fritsche et al. 2016), and another with 111,326 AD cases and 677,663 controls, identifying 75 AD loci (Bellenguez et al. 2022). Using the MAGMA baseline model, we examined the effects of variant-to-gene mapping augmentations on gene-set scores and identified enrichment for retina and brain microglia in AMD (Fig. 5A; Supplemental Table S7). Similarly, the gene sets in both retina microglia and brain microglia were also significantly enriched in AD (Fig. 5B). Next, we implemented a LD score regression method, LDSC-SEG (Finucane et al. 2018), to quantify the heritability enrichment (Supplemental Table S8). Consistent with the results of MAGMA, LDSC-SEG identified retina and brain microglia to be significantly enrichment for both AMD (Fig. 5C) and AD (Fig. 5D). In addition, the 197 genes that were shared between retina and brain microglia also showed significant enrichment for AMD and AD in MAGMA and for AD in LDSC-SEG (Fig. 5A–D).
Integration of gene expression and GWAS data identified microglia as disease-critical cell type in AMD and AD. (A) MAGMA enrichment analysis of gene expression data from retina and brain cell types for AMD-associated variants. The plot shows the P-value for MAGMA enrichment of AMD-associated variants in gene expression across retina cell types. The x-axis represents the mean strength of association (–log10(P-value)), and the y-axis displays the different cell types. (B) Enrichment of AD–GWAS variants within retina and brain cell types using MAGMA. (C) Retina and brain cell type–specific enrichment of SNP heritability for AMD estimated using LDSC-SEG. The y-axis displays negative log10 P-values of enrichment P-value for each individual test. (D) Enrichment estimates for retina and brain cell types for AD–GWAS variants using LDSC-SEG. The dashed line indicates the P-value cutoff for individual annotations, and the asterisks represent statistical significance at a false-discovery rate (FDR) of >5% across all four plots. (E,F) Heatmap of AMD–GWAS genes across retina and brain cell types. This highlights that AMD–GWAS genes that are enriched in retina microglia (E) are also predominantly expressed in brain microglia (F). (G,H) Heatmap of AD–GWAS genes across retina and brain cell types. This reveals that AD–GWAS genes enriched in brain microglia (H) are also highly and specifically expressed in retina microglia (G). (RGC) Retinal ganglion cell, (Common) genes common to both retina and brain microglia, (Retina-specific) genes upregulated in retina microglia compared with brain microglia, and (Brain-specific) genes upregulated in brain microglia compared with retina microglia.
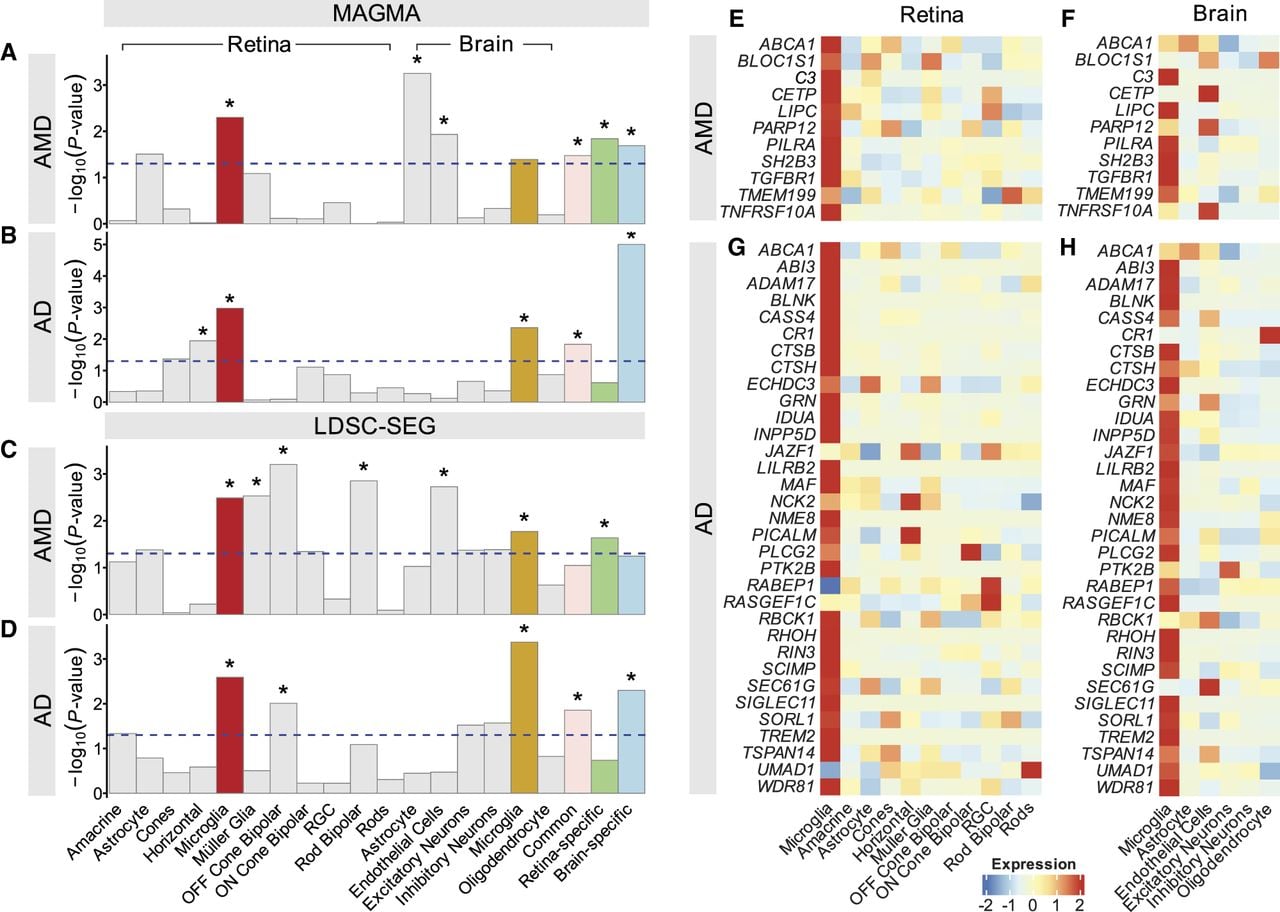
Next, we investigated how GWAS signals are enriched within genes differentially expressed between brain and retinal microglia. For AMD, signatures from both the retina and brain showed enrichment, whereas for brain microglia, enrichment was observed only with AD in the MAGMA analyses (Fig. 5A,B; Supplemental Table S7). In LDSC-SEG analyses (Supplemental Table S8), retina-specific and brain microglia–specific signatures showed enrichment exclusively for AMD and AD, respectively (Fig. 5C,D). These findings indicate that although microglia in both the retina and brain play roles in AMD and AD, the distinct molecular signatures are likely specific to each disease.
Finally, we examined the expression of genes (40 for AMD [Fritsche et al. 2016] and 76 for AD [Bellenguez et al. 2022]) located within GWAS-associated loci (Supplemental Fig. S10). We selected genes with normalized expression values greater than 1.5 in retina or brain microglia. Among these, several AMD-associated genes showed selective or preferential expression in retina microglia (Fig. 5E), whereas those linked to AD exhibited similar patterns in brain microglia (Fig. 5H; Hansen et al. 2018). We observed that AMD genes that were highly expressed in retina microglia also showed specific expression in brain microglia (Fig. 5F), as well as AD genes in retina microglia (Fig. 5G), consistent with shared transcriptome profiles of retina and brain microglia. Collectively, these results implicate microglial dysfunction as a contributing factor in AMD and AD pathogenesis.
Retina and brain microglia open chromatin is enriched in disease heritability
Because majority of AMD- and AD-associated variants are noncoding (Fritsche et al. 2016; Bellenguez et al. 2022), they are likely to impact the function of regulatory elements. Thus, we leveraged snATAC-seq data to determine the relevance of retina and brain microglia in AMD and AD using MAGMA (de Leeuw et al. 2015). First, we identified the DARs for each cell type within the retina and brain, using a log-fold-change threshold of 0.25 and Bonferroni-adjusted P-values (Padj < 0.05) (Supplemental Table S9). DARs represent the peaks that were either exclusively or more open in one cell type compared with others. The DARs were then assigned to the nearest genes using Signac (Stuart et al. 2021), and gene-set enrichment analysis was conducted using MAGMA (de Leeuw et al. 2015) to determine whether these genes were enriched in genetic associations with AMD and AD. We observed enrichment of AMD–GWAS variants in retina microglia compared with other retina cell types (Fig. 6A; Supplemental Table S10). Although this did not reach significance after correction for multiple testing, likely owing to the relatively small sample size of the AMD–GWAS data set. Among brain cell types, microglia and excitatory neurons showed significant enrichment (Fig. 6A). For AD–GWAS, significant enrichment was observed only in microglia from both the retina (Fig. 6B) and brain (Fig. 6B). We next applied S-LDSC (Finucane et al. 2015) for partitioning heritability analyses of chromatin accessibility. We estimated heritability enrichment (defined as the proportion of heritability explained by SNPs in an annotation divided by the proportion of SNPs in the annotation) for each disease–cell type pair conditional on annotations from the baseline-LD model for each. For AMD, enrichment was not significant for retina or brain microglia (Fig. 6C), possibly because of small sample size in the AMD–GWAS data. For AD, both the retina (enrichment score = 31.00, SNP heritability explained = 27.06%) and brain microglia (enrichment score = 25.91, SNP heritability explained = 36.33%) showed significant enrichment (Fig. 6D; Supplemental Table S11). Next, we investigated how GWAS signals are enriched within DARs identified between brain and retinal microglia. In contrast to gene expression analyses, the DAR analysis revealed only a limited number of regions: 58 upregulated in retinal microglia and 45 in brain microglia. Subsequently, no significant enrichment was observed for AMD or AD, likely owing to limited statistical power (Fig. 6A–D; Supplemental Table S11).
Integration of epigenetic annotations and GWAS shows enrichment for disease heritability in retina and brain microglia. (A) MAGMA enrichment analysis of open chromatin data. Bar plots display the mean strength of association (–log10 P-values) for MAGMA enrichment in retina and brain cell types, highlighting significant enrichment in retina and brain microglia for AMD–GWAS variants. (B) MAGMA enrichment analysis of AD–GWAS variants in open chromatin data across retina and brain cell types, showing significant enrichment specifically in retina and brain microglia. (C) Heritability enrichment estimates from retina and brain annotations for AMD–GWAS variants using S-LDSC. (D) Enrichment estimates with S-LDSC for epigenetic annotations from retina and brain cell types for AD. In all four plots, the dashed line marks the P-value significance for individual annotations, and asterisks represent the significant at an FDR <5%. (E,F) GARFIELD enrichment analysis of open chromatin data for AMD–GWAS (E) and AD–GWAS (F) for retina and brain cell types. Radial lines show odds ratio (OR) values at five GWAS P-value thresholds (T) for ATAC-seq peaks from retina and brain microglia cell types. Colored dots in the inner ring of the outer circle show where GARFIELD enrichment is significant, with stronger significance closer to the center (from T < 10−5 to T < 10−8). The dot's color represents a specific cell type. (G,H) The bar plot shows enrichment for AMD-associated (G) and AD-associated (H) variants in ATAC-seq data from ENCODE and Roadmap Epigenomics data sets across different tissues. ORs for enrichment are shown for variants at GWAS threshold of P < 1 × 10⁻⁸ after multiple-testing correction for the number of effective annotations. The dashed lines represent the P-value significance threshold for enrichment. (RGC) Retinal ganglion cell, (Retina-specific MG) DARs identified between in retina microglia compared with brain microglia, and (Brain-specific MG) DARs identified between in brain microglia compared with retina microglia.
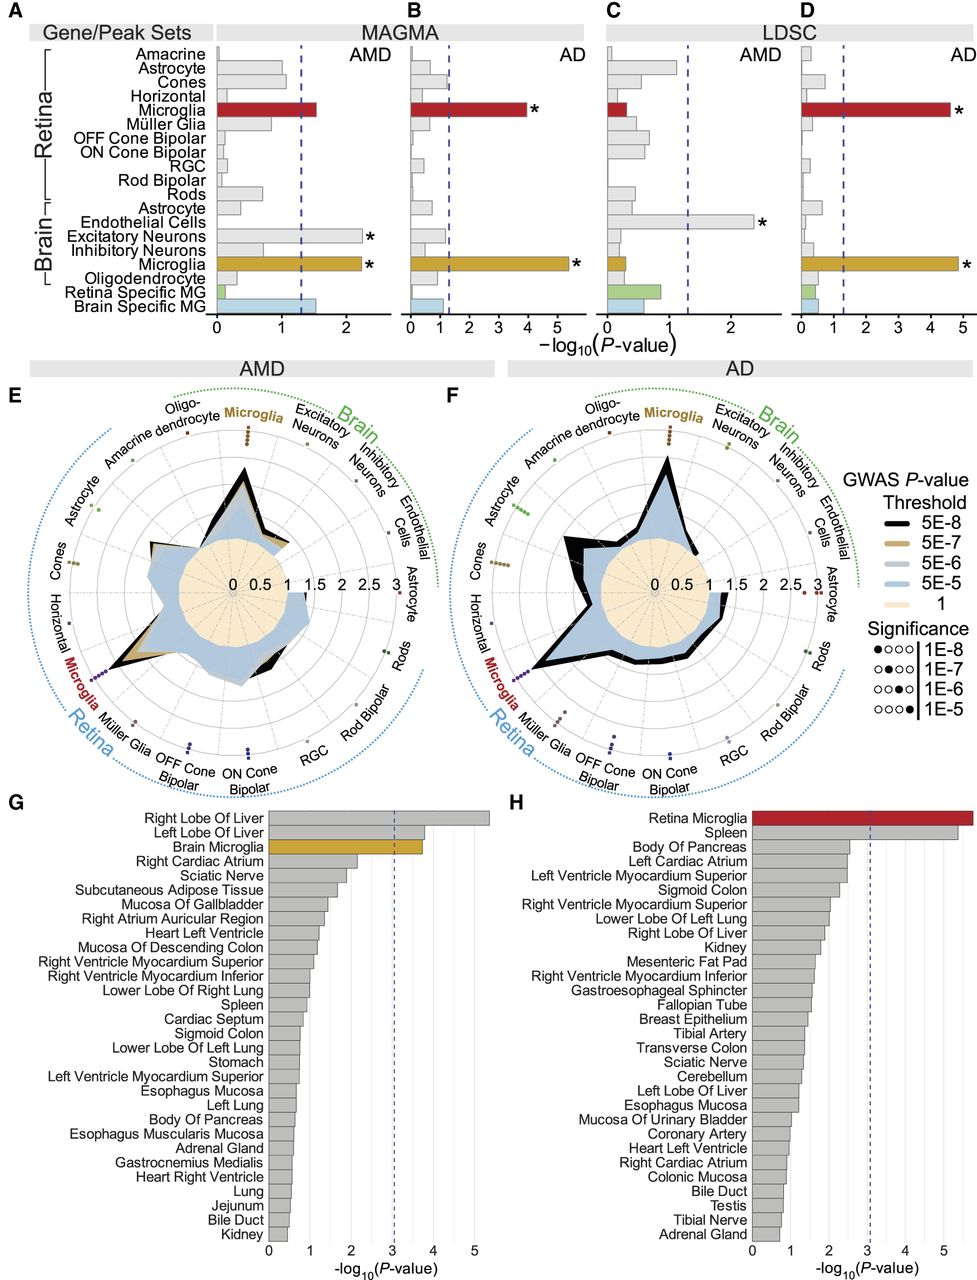
Finally, we applied GWAS analysis of regulatory or functional information enrichment with LD correction (GARFIELD) (Iotchkova et al. 2019) to estimate the enrichment of AMD–GWAS and AD–GWAS associations in chromatin accessibility peaks of 11 retina and six brain cell types (Supplemental Table S12). Significant enrichment of AMD-associated loci was observed in retina (OR = 2.68, P = 5.54 × 10⁻⁶) (Fig. 6E). Within the brain cell types, AMD–GWAS signals were most enriched in microglia (OR = 2.32, P = 2.91 × 10⁻⁵) compared with other cell types (Fig. 6E). Similarly, AD–GWAS signals were significantly enriched in both brain (OR = 2.53, P = 1.42 × 10⁻²⁰) and retina microglia (OR = 2.67, P = 9.23 × 10⁻¹⁹) at different GWAS P-value thresholds (Fig. 6F). The findings reveal enrichment of both AMD–GWAS and AD–GWAS signals in microglia, consistent with the shared profiles. To better understand the specificity of AMD–GWAS variants in brain microglia and AD–GWAS variants in retinal microglia, we aimed to extend our analysis by incorporating the regulatory annotation of open chromatin regions, as assessed through ATAC-seq, across 63 tissues available in the Encyclopedia of DNA Elements (ENCODE) (The ENCODE Project Consortium et al. 2020). The ENCODE data exhibited wide variation in sample sizes across tissues, leading to differences in the number of open chromatin regions, which could introduce bias in comparative enrichment analyses. To minimize this, we focused on regions that were uniquely open or shared with no more than 10% of the tissues. Along with microglia, AMD–GWAS variants were significantly enriched in the liver (Fig. 6G; Supplemental Table S12), consistent with the liver's role in complement pathways (Qin and Gao 2006), which accounts for significant proportion of AMD heritability (Fritsche et al. 2014). Similar analysis of AD–GWAS variants identified the most significant enrichment retina microglia (Fig. 6H; Supplemental Table S12). These findings emphasize the specificity of brain and retinal microglia compared with other tissues in explaining the heritability of AMD and AD, underscoring their critical relevance to both conditions.
Discussion
Microglia are emerging as a key player in immune responses in development and disease. In this study, we demonstrate that human retina and brain microglia exhibit shared transcriptional and epigenetic regulation. Importantly, we also report significant enrichment of retina microglia in brain neurodegenerative disease, specifically AD, and of brain microglia in AMD. These findings significantly advance our understanding of microglial contributions to inherited variations in AMD and AD and offer a framework for further mechanistic exploration of immune dysfunction–driven neurodegeneration that can have implications for improving our understanding of AMD and AD.
We note several key distinctions between our work and previous studies. Previous efforts of comparing retina and brain microglia had been limited to transcriptional data (Murenu et al. 2022; Wolf et al. 2022). Our study extends this to a detailed comparison of both transcriptomic and epigenetic profiles of retina and brain microglia to confirm high degrees of similarity. Additionally, unlike previous work, which mostly focused on the expression-level comparison of retina and brain microglia, we systematically integrated cell type–specific expression and epigenetic annotations with the GWAS summary statistics to identify the disease-relevant cell types. Moreover, by analyzing data from multiple studies, we enhanced the power and reproducibility of our findings through comparisons of snRNA-seq and snATAC-seq profiles. Finally, our study reveals, for the first time, the substantial heritability of a retina phenotype (AMD) attributed to brain microglia and, similarly, of a brain phenotype (AD) attributed to retina microglia. Although these diseases have distinct pathogenetic mechanisms, the common involvement of microglia-driven neuroinflammation may help explain their similarities. Additionally, microglia account for ∼10% of the cellular composition in the brain (Lawson et al. 1990) compared with just 0.4% in the retina (Yu et al. 2024). The smaller proportion of the retina has led to unavailability of genomic resources such as eQTL and epigenetic profiles from a large number of donors for studying their role in AMD despite their role bring critical in the disease. In contrast, the brain's significantly larger size has led to a greater abundance of large data sets for studying brain microglia (Kosoy et al. 2022; Lopes et al. 2022). Our findings of shared gene expression and regulatory patterns between retinal and brain microglia highlight the potential to leverage resources from both tissues to gain deeper insights into the functional mechanisms underlying GWAS loci.
Collectively our results might suggest that microglial dysfunction as a contributing factor in AMD and AD presents the framework for the cross-implications or shared mechanisms that may exist between these two distinct neurodegenerative conditions. Both diseases are common neurodegenerative disorders with shared risk factors such as age (Friedman et al. 2004; Hou et al. 2019) and cigarette smoking (Velilla et al. 2013; Durazzo et al. 2014). Moreover, both diseases share some pathological features such as progressive aggregation of protein and cellular debris called drusen between retinal pigment epithelium and retina in AMD (Abdelsalam et al. 1999) and amyloid beta and tau in AD (Busche and Hyman 2020), as well as common pathways in their pathogenesis, including inflammation, oxidative stress, and impaired autophagy (Nussenblatt et al. 2014; Labzin et al. 2018). Additionally, patients with AMD exhibit a significant 1.21-fold higher risk of developing AD (Wen et al. 2021; Tsai et al. 2023). Furthermore, multiple studies have established a correlation between retinal and cerebral changes in AD, suggesting that advanced retina imaging may serve as a promising biomarker for detecting AD (Alber et al. 2020). Genetic studies have highlighted the significant association of the AMD-associated epsilon 4 APOE allele with AD (Williams et al. 2015). It is noteworthy that the genes associated with AMD and AD had minimal overlap, with only two genes sharing ABCA1 and APOE. At first glance, this might suggest no commonality between the two diseases. However immune and complement response (Fritsche et al. 2014; Nussenblatt et al. 2014; Shi et al. 2017), cholesterol-lipid dysregulation (Fan et al. 2017; Kjeldsen et al. 2022; Hussain et al. 2024), angiogenesis, and related signaling pathways are shared in their etiology. Furthermore, GWAS findings have several limitations. Not all relevant genes have been identified, and a significant portion of heritability remains unexplained. Moreover, gene associations in GWAS are largely based on statistical correlations, with limited molecular and functional evidence to support the role of many identified genes in disease. At the same time, different diseases can target the same cell type, although the molecular mechanisms and resulting clinical manifestations can vary significantly. For example, various lung diseases, such as asthma, COPD, and pulmonary fibrosis, all affect lung epithelial cells (Crosby and Waters 2010).
Despite the similarities between retina and brain microglia, several important differences also emerge. Although the transcriptomes and epigenomes of these two microglial populations exhibit substantial overlap, we identified genes that are exclusively upregulated in each tissue. Additionally, canonical microglial markers display DE between the two. Although some of these differences may result from homeostatic processes or cellular heterogeneity, a significant portion is likely to reflect the tissue-specific roles microglia adopt in the retina and brain. For example, circulating monocytes experience changes in transcriptome upon entering the brain (Bennett et al. 2018). This could partially explain why the APOE gene, encoding apolipoprotein E (APOE), which is a major risk factor for both AMD (McKay et al. 2011) and AD (Insel et al. 2021), exhibits opposite effects. In AMD, the APOE2 allele is associated with increased risk, whereas APOE4 confers reduced risk (McKay et al. 2011). In contrast, APOE4 is the major risk factor in AD, with APOE2 acting as a protective allele (Insel et al. 2021).
We acknowledge several limitations in our study. First, our ability to identify retinal microglia is constrained by the resolution of the annotated cell types in the single-cell data we analyzed, which represent a minority proportion. Therefore, we are unable to capture the full diversity of the microglial subpopulations that exist in the brain and retina. Additionally, all our analyses are based on nondisease donors, which limits the identification of disease-specific microglia heterogeneity. Future studies that integrate snRNA-seq and snATAC-seq data from both healthy and diseased individuals will be crucial to advancing our understanding of the disease pathogenesis. Finally, our analysis of open chromatin regions assumes that regulatory elements act locally. However, it is important to note that these regions can also engage in interactions across greater distances and may not always regulate the nearest gene. Future studies integrating GWAS, and chromatin data could provide valuable insights into such distant regulatory interactions. The enrichment of GWAS variants within epigenetic marks should also be interpreted with caution, as this enrichment, based on the overlap of epigenetic marks, is not quantitative (Cano-Gamez and Trynka 2020). Moreover, distinguishing truly causal features from those merely correlated remains challenging. Experimental approaches that directly manipulate specific associated variants and assess their effects on gene expression, regulation, and microglial function will offer deeper mechanistic insights. Additionally, the open chromatin regions in our study provide a snapshot that may not capture the dynamic, cell state–specific nature of gene regulation (Alasoo et al. 2018), underscoring the need for broader profiling across normal and disease stages at various time points. Despite these limitations, our work highlights the common role of microglia in AMD and AD pathology and offers new insights into the biological mechanisms underlying neurodegenerative diseases.
Methods
Data acquisition and primary analysis
Data were downloaded from multiple published NCBI Gene Expression Omnibus (GEO; https://www.ncbi.nlm.nih.gov/geo/) accession numbers along with one data set on Zenodo (https://zenodo.org) and two data sets from the CZI public website (https://chanzuckerberg.com) (Supplemental Table S1). This study was performed in accordance with the ethical standards of the Declaration of Helsinki, and informed consent was taken from all the participants in original studies. The study was approved by the Baylor College of Medicine review board. FASTQ files were processed using Cell Ranger version 8.0.0 for RNA-seq data and Cell Ranger ATAC version 1.2.0 for ATAC-seq data. Multiomic single-nucleus data were processed using Cell Ranger Arc 2.0.2. Other data sets from Zenodo and CZI included preprocessed count matrices, which were directly loaded without the need for further primary analysis. GWAS summary statistics were obtained from the GWAS catalog (Supplemental Table S1).
snRNA-seq analyses
Single-nuclei data from 28 retina samples from five data sets (Orozco et al. 2020; Wang et al. 2022; Kuchroo et al. 2023; Yu et al. 2024) and 24 brain samples from three data sets (Velmeshev et al. 2023; Haney et al. 2024; Sepp et al. 2024) were integrated for the analysis (Supplemental Table S1). Counts data from Cell Ranger was analyzed using Seurat (Butler et al. 2018). Quality control was performed on each sample to remove low-quality cells and doublets with counts of fewer than 200 and more than 7500, respectively. Cells with mitochondrial reads >10% were also removed. We implemented the fast integration pipeline in Seurat 4.4 (Stuart et al. 2019) for performing normalization with dimension reduction using SCTransform V2 (Hafemeister and Satija 2019) and RunPCA(seed.use = 1) on data set–level objects. The lists for retina and brain data sets were fed into SelectIntegrationFeatures (nFeatures = 3000), PrepSCTIntegration, and FindIntegrationAnchors (normalization method = “SCT,” dims = 1:30, reduction = “rpca,” k.anchors = 20). Using the anchors, we ran IntegrateData (normalization method = “SCT,” dims = 1:30). Cells embeddings were regenerated again after integration and used for RunUMAP (reduction = “pca,” dims = 1:30, min.dist = 0.2, seed.use = 1). Unsupervised clustering and cluster identification were performed using FindNeighbors and FindClusters (algorithm = 1, resolution = 0.5, random.seed = 1). We annotated the cells using Seurat's addModuleScore to calculate scores for cell type–specific marker genes (Menon et al. 2019; Peng et al. 2019; Yan et al. 2020). Module scores were visualized using the DotPlot function from Seurat. Cells that could not be confidently assigned to specific cell types were excluded in downstream analysis. To combine data sets for the retina and brain, the two Seurat objects were merged and regenerated the cell embeddings using RunPCA, RunHarmony (group.by.vars = “sample”), and RunUMAP (reduction = “harmony,” dims = 1:30, seed.use = 1, min.dist = 0.2) (Korsunsky et al. 2019).
Subclustering analyses of snRNA-seq
We selected the clusters with the highest module score for microglia and regenerated the cell embeddings and UMAP plot. We then run unsupervised clustering and cluster identification and annotated them, including the sets of markers for microglia, PVMs, and monocytes (Supplemental Table S2; Butovsky and Weiner 2018; O'Koren et al. 2019; Hao et al. 2021; Bloomfield et al. 2024; Yu et al. 2024). We generated module scores based on two sets of lists of marker genes. The first list contains sets of markers for microglia, PVMs, and monocytes (Butovsky and Weiner 2018; O'Koren et al. 2019; Hao et al. 2021; Bloomfield et al. 2024; Yu et al. 2024). The second list includes the top differentially expressed genes, ranked by fold change, for hMG1, hMG2, and hMG3—corresponding to human microglia clusters 1, 2, and 3—as well as for PVMs and monocytes from a recently published single-cell atlas of the human retina (Yu et al. 2024) and brain (Böttcher et al. 2019). After annotation, cells identified as microglia, PVMs, and monocytes were extracted in the retina and brain for performing another round of integration (Stuart et al. 2019). The lists for retina and brain data sets were fed into SelectIntegrationFeatures (nFeatures = 3000), PrepSCTIntegration, and FindIntegrationAnchors (normalization method = “SCT,” dims = 1:30, reduction = “rpca,” k.anchors = 20). Using the anchors, we ran IntegrateData (normalization method = “SCT,” dims = 1:30). Cell embeddings were regenerated again after integration and used for RunUMAP (reduction = “pca,” dims = 1:30, min.dist = 0.2, seed.use = 1) (Stuart et al. 2019).
DE analysis was performed using FindMarkers (logfc_threshold = 0.25, min.pct = 0.2, test.use = “wilcox,” assay = “RNA”) from Seurat (Butler et al. 2018). Pairwise DE analysis was done for all annotated cell types to produce lists of DE genes for use in downstream processes. We also performed a separate DE analysis between the identified microglia from the retina and microglia from the brain. DE genes were filtered for genes with twofold change or higher.
snATAC-seq analysis for the brain and retina
We integrated chromatin accessibility data from 38 human retinas from three different studies (GEO: GSE196235, GSE247157) (Orozco et al. 2020; Wang et al. 2022, 2023) and eight samples from three human brain data sets (GEO: GSE174367, GSE204682, GSE147672) (Supplemental Table S1; Corces et al. 2020; Morabito et al. 2021; Zhu et al. 2023). Count matrices in form of .h5 files were generated for each sample using Cell Ranger ATAC 1.2.0 imported into Seurat (Butler et al. 2018) and Signac (Stuart et al. 2021). Peaks in each sample were merged, and the counts were regenerated for the combined data set. Gene annotation for Homo sapiens hg38 was added with annotation package EnsDb.Hsapiens.v86 (https://bioconductor.org/packages/EnsDb.Hsapiens.v86/). Quality control was performed by removing cells with counts lower than 200 and higher than 35,000, nucleosome signal more than five, TSS enrichment less than two, blacklist ratio higher than 0.05, and percentage reads in peaks less than 15. We retained 224,131 and 31,616 cells for the retina and brain, respectively. Integration of all data sets within each tissue was performed by normalization and dimension reduction for each data set. First, features, peaks in this case, were ranked based on their observed frequency observed using FindTopFeatures (min.cutoff = 10). Normalization through term frequency-inverse document frequency (TF-IDF) was done to correct for sequencing depth, and dimension reduction was performed by running singular value decomposition (SVD) on the corrected count matrix. Anchors were identified using FindIntegrationAnchors (reduction = “rlsi,” dims = 2:30) (Stuart et al. 2019). The IntegrateEmbeddings function created a new cell embeddings layer in the Seurat object of each tissue for use with clustering and visualization.
Next, a UMAP layer was generated using the RunUMAP function (min.dist = 0.2, dims = 2:30, seed.use = 1) after performing unsupervised clustering and identification, as described above, with FindNeighbors and FindClusters (algorithm = 1, resolution = 0.5, random.seed = 1). Cells were annotated by generating gene activity matrices with the GeneActivity function, followed by the creation of an RNA assay. The count matrix in this assay was normalized using NormalizeData with default parameters. Finally, module scores based on our curated list of marker genes were computed and visualized using Seurat's DotPlot function. To maintain high specificity, cells lacking a definitive cell type label were removed from further analysis.
To combine the retina and brain Seurat objects, the peaks from both objects were first merged, and then the peaks were requantified in each tissue's respective object before combining them. A new gene activity matrix was calculated using the updated count matrix. The cell embeddings were recalculated following the steps outlined above, with the addition of RunHarmony (group.by.vars = ‘sample’) for batch correction (Korsunsky et al. 2019) prior to running RunUMAP.
Subclustering of retina and brain microglia from the snTAC-seq data
To further refine the annotation of microglia cells from the retina and brain, we extracted the microglia clusters from both tissues and applied the same procedures to generate UMAP plots of their subclusters. The Seurat object for the retina and brain initially labeled as microglia were split into lists of smaller objects for each data set. Each data set then undergoes cell embeddings generated using FindTopFeatures (min.cutoff = 10), RunTFIDF, and RunSVD. Anchors were created using FindIntegrationAnchors(reduction = “rlsi,” dims = 2:30) and additional parameters that are different: k.anchor = 100 for the brain and default for the retina. Finally, the data sets from the retina and brain separately were integrated with IntegrateEmbeddings (dims.to.integrate = 1:30) and k.weight = 50 for the retina and default for the brain. After integration, UMAP coordinates were generated by RunUMAP (reduction = “integrated_lsi,” dims = 2:30, seed.use = 1, min.dist = 0.2) (Stuart et al. 2019). Module scores were calculated based on differentially expressed genes and our curated list of marker genes, as described above, and were then visualized using the DotPlot function to annotate microglia, PVMs, and monocytes. After annotating the cells, the CallPeaks function was run to generate a set of peaks for each cell type in both tissues. These peaks were then filtered to include only those with conventional chromosome notations and to exclude any that overlapped with a blacklist provided in Signac (Stuart et al. 2021). To visualize the identified microglia, PVMs, and monocytes from the retina, brain, and combined, we extracted the three cell types from each Seurat object and then reintegrated them using the same steps as above, with some differences in parameters. For Retina, we changed k.weight = 40 in IntegrateEmbeddings. For the brain, k.anchor was changed to default, and k.weight was kept at default. For integrating both the retina and brain data sets, k.anchor was kept at default and k.weight = 20. RunUMAP was performed after these integrations with dims = 2:30, min.dist = 0.2, and seed.use = 05192025 (Stuart et al. 2019).
Pairwise differential accessibility region and overrepresented TF motif analyses
Pairwise differential accessibility region (DAR) analysis was performed using FindMarkers (logfc.threshold = 0.25, min.pct = 0.2, random.seed = 1, test = ‘wilcox’) to compare the cell type of interest against other cell types (Butler et al. 2018). DAR peaks were linked to genes using the ClosestRegion function from Signac (Stuart et al. 2021) to identify genes that overlapped with or were in close proximity to these peaks. Motif analysis on the retina and brain microglia data used the Signac package (Stuart et al. 2021). We acquired the DNA sequence motif information from JASPAR2022 and added into snATAC-seq seu.obj with AddMotifs function in Signac (Stuart et al. 2021). Finally, the FindMotifs function was used to identify overrepresented motifs within DAR peaks.
Hierarchical clustering of microglia subclusters
Hierarchical clustering for snRNA-seq and snATAC-seq data was performed using speciesTree (Bakken et al. 2021) to quantify the similarity of the microglia cluster in each tissue. Counts from either the gene expression matrix or chromatin accessibility peaks were used as input. The distance matrix was calculated using the cor function with method = “Spearman,” and the matrix was then used for hierarchical clustering in speciesTree. The resulting plot was generated using the default functions provided in the package.
Correlation heatmap for all cell types in the retina and brain
The average expression data from the RNA assay in the combined retina and brain Seurat object were generated using the AverageExpression function from Seurat. This matrix was then input into the cor function with method = “Spearman” to account for differences in gene expression scaling between the retina and brain. A heatmap was generated using ComplexHeatmap (Gu et al. 2016), and clustering was done using the hclust default method. The significance of the difference between correlations of immune cells with other cell types versus within immune cells was determined using the Mann–Whitney U test via wilcox.test function.
Ligand receptor identification
We predicted the ligand–receptor interaction between retina microglia and other retinal cell types, as well as brain microglia with other brain cell types, using LRLoop (Xin et al. 2022). Interaction strengths were first calculated based on the expression levels of ligands in sender cells and receptors in receiver cells. We then integrated cell type–specific signaling and regulatory networks by overlaying known interactions with gene expression data. The get_LRscores function (default parameters) was used to compute interaction scores between each pair of cell types in both directions. To refine these scores, we applied the updateLRscores function (default parameters), using microglia interaction scores and those from the partner cell type to account for regulatory loops. Finally, we filtered for interactions in which both ligand and receptor genes were expressed in at least 10% of their respective cell types and had a score of 0.5 or more across all time points.
Gene expression heatmap for all cell types in retina and brain using AMD– and AD–GWAS genes
Relevant gene lists for AMD and AD were obtained to create heatmaps of their expression in each cell type in the retina and brain. For AMD, the list comprised most the likely target genes at those loci identified through GWAS (Fritsche et al. 2016), eQTL (Orozco et al. 2020), and rare variant (Ratnapriya et al. 2020) studies. For AD, we gathered the reported nearest protein-coding genes to the associated GWAS variants (Bellenguez et al. 2022). Heatmaps were generated using ComplexHeatmap (Gu et al. 2016). Genes with scaled expression greater than 1.5 in microglia, relative to other cell types in the retina or brain, were further selected for comparison.
Pathway enrichment analysis
DEGs were filtered based on average fold change greater than two and an adjusted P-value 0.05. Venn diagrams were made using DeepVenn (Hulsen 2022). Pathway enrichment analysis was performed using a 5% FDR cutoff with Ensembl IDs as the key type and the biological process subontology (Yu et al. 2012). Top five GO terms with the lowest adjusted P-values were selected for plotting. Dot Plots were generated using dotplot function from enrichplot package.
MAGMA
The significance of microglia in the retina and brain in neurodegenerative diseases was evaluated. For snRNA-seq data, genes most specific to each cell type were selected (those showing at least a twofold higher expression compared with other cell types) and analyzed using MAGMA (de Leeuw et al. 2015). GWAS data were obtained from IAMDGC consortium for AMD (Fritsche et al. 2016) and the GWAS catalog for AD (Bellenguez et al. 2022). We computed the full gene analysis using all gene locations and the GWAS SNPs with default parameters. This step requires the LD reference, which we obtained from The 1000 Genomes Project Consortium (2015); the gene locations in hg19 provided in the MAGMA repository; and the summary statistics from the GWAS. We used the hg19 reference genome for our analysis, as the AMD–GWAS and AD–GWAS data sets were originally aligned to this build. Although newer reference genomes such as GRCh38 offer improved annotations, we do not expect them to significantly impact our conclusions, as the study focuses on common variants that are well represented across reference builds. Gene-set analysis was performed using the result from the full gene analysis along with the list of genes from our DE analysis, including genes that were present in >20% of the cells. For ATAC-seq data, genes overlapping or closest to the DAR peaks with a lower threshold of twofold change were selected for gene-set enrichment analysis using MAGMA (de Leeuw et al. 2015). We applied the Benjamini–Hochberg correction for multiple testing in R (R Core Team 2025) using p.adjust (method = “fdr”). The BETA value from the MAGMA output was used to represent the enrichment, and results were visualized in the form of a bar plot using log10 of the adjusted P-value.
LDSC-SEG and S-LDSC
We used the same set of genes as in the MAGMA analysis, selecting cell type–specific genes with twofold or more expression. LD reference was acquired through the 1000 Genomes Project (The 1000 Genomes Project Consortium 2015) of European ancestry. For LDSC-SEG (Finucane et al. 2018), we added a 100 kb window to the hg19 gene body coordinates to create the binary annotation for LD score calculation for each set of DE genes. A separate LD score for all protein-coding genes was calculated. Partitioned heritability was estimated by stratified LD score regression using GWAS summary statistics for AMD and AD, the baseline model, LD score for all protein-coding genes, and individual LD score sets for each cell type in each tissue. For S-LDSC (Finucane et al. 2015), the annotation was generated by overlapping the peaks of interest with the SNPs’ position located in the LD reference to create a single column file, containing 1 sec and 0 sec for hits and misses, respectively. Peaks called for cells in microglia in the retina and brain are used for creating annotations. These peaks were first filtered for conventional chromosomes and through a blacklist provided by Signac, which were then lifted to hg19 coordinates. The baseline-LD score was provided by LDSC group (Finucane et al. 2015). After LD score computations, we ran stratified partitioned heritability calculations for AMD–GWAS or AD–GWAS summary statistics using the baseline-LD scores and each of the LD scores for those each annotation separately. P-values were adjusted for multiple comparisons in R (R Core Team 2025) using the Benjamini–Hochberg method via p.adjust (method = “fdr”). The results were visualized through bar plots of the log10 of the adjusted P-value.
GARFIELD
We performed the functional enrichment analysis using GARFIELD (Iotchkova et al. 2019) of the open chromatin annotation in retina and brain by leveraging GWAS summary statistics of AMD and AD. We ran GARFIELD with default parameters and our annotations, and the method is described in detailed elsewhere (Iotchkova et al. 2019). Briefly, GARFIELD first performs the LD pruning to extract independent SNPs from genome-wide genetic associations, followed by LD tagging annotation to annotate each variant with regulatory annotations. Then, utilizing a logistic regression model, GARFIELD calculates enrichment statistics (odds ratios [OR]) and P-values at user-defined GWAS P-value thresholds for each annotation. Enrichment of significant SNPs was assessed for each tier of GWAS P-value thresholds: 1 × 10⁻⁵, 1 × 10⁻⁶, 1 × 10⁻⁷, and 1 × 10⁻⁸. The results are presented in the radial plots. For the ENCODE data, we downloaded narrowPeak files from 61 tissues (The ENCODE Project Consortium et al. 2020). Differences in the number of open chromatin regions across tissues could introduce potential bias in comparative heritability analyses. To minimize this effect, we initially focused on uniquely open regions, defined as those active in ≤10% of the tissues. However, for the AD–GWAS comparison of retina versus all other tissues, we increased this threshold to 20% for retina microglia, as the 10% threshold resulted in a very small number of peaks (fewer than 3000) owing to the smaller sample size.
Data access
A Seurat object containing the processed snRNA-seq and snATAC-seq data has been uploaded to Zenodo (https://zenodo.org/records/16640709). The raw data were obtained from previously published data sets, listed in Supplemental Table S1.
Competing interest statement
The authors declare no competing interests.
Acknowledgments
This study is supported by BrightFocus Foundation and Research to Prevent Blindness (RPB) to R.R. R.R. is also supported by an Unrestricted grant from RPB to the Department of Ophthalmology, Baylor College of Medicine.
Author contributions: R.R. conceived and designed the study and secured funding. K.M. and R.R. conducted the analysis and analyzed the data. K.M. and R.R. wrote the manuscript.
Notes
[1] Supplementary material [Supplemental material is available for this article.]
[2] Article published online before print. Article, supplemental material, and publication date are at https://www.genome.org/cgi/doi/10.1101/gr.280554.125.
References
- ↵The 1000 Genomes Project Consortium. 2015. A global reference for human genetic variation. Nature 526: 68–74. 10.1038/nature15393
- ↵Abdelsalam A, Del Priore L, Zarbin MA. 1999. Drusen in age-related macular degeneration: pathogenesis, natural course, and laser photocoagulation-induced regression. Surv Ophthalmol 44: 1–29. 10.1016/S0039-6257(99)00072-7
- ↵Alasoo K, Rodrigues J, Mukhopadhyay S, Knights AJ, Mann AL, Kundu K, HIPSCI Consortium, Hale C, Dougan G, Gaffney DJ. 2018. Shared genetic effects on chromatin and gene expression indicate a role for enhancer priming in immune response. Nat Genet 50: 424–431. 10.1038/s41588-018-0046-7
- ↵Alber J, Goldfarb D, Thompson LI, Arthur E, Hernandez K, Cheng D, DeBuc DC, Cordeiro F, Provetti-Cunha L, den Haan J, 2020. Developing retinal biomarkers for the earliest stages of Alzheimer's disease: what we know, what we don't, and how to move forward. Alzheimers Dement 16: 229–243. 10.1002/alz.12006
- ↵Albert FW, Kruglyak L. 2015. The role of regulatory variation in complex traits and disease. Nat Rev Genet 16: 197–212. 10.1038/nrg3891
- ↵Alzheimer A, Stelzmann RA, Schnitzlein HN, Murtagh FR. 1995. An English translation of Alzheimer's 1907 paper, “Uber eine eigenartige Erkankung der Hirnrinde”. Clin Anat 8: 429–431. 10.1002/ca.980080612
- ↵Alzheimer's Association. 2023. 2023 Alzheimer's disease facts and figures. Alzheimer's Dementia 19: 1598–1695. 10.1002/alz.13016
- ↵Anderson SR, Zhang J, Steele MR, Romero CO, Kautzman AG, Schafer DP, Vetter ML. 2019. Complement targets newborn retinal ganglion cells for phagocytic elimination by microglia. J Neurosci 39: 2025–2040. 10.1523/JNEUROSCI.1854-18.2018
- ↵Bakken TE, Jorstad NL, Hu Q, Lake BB, Tian W, Kalmbach BE, Crow M, Hodge RD, Krienen FM, Sorensen SA, 2021. Comparative cellular analysis of motor cortex in human, marmoset and mouse. Nature 598: 111–119. 10.1038/s41586-021-03465-8
- ↵Bellenguez C, Kucukali F, Jansen IE, Kleineidam L, Moreno-Grau S, Amin N, Naj AC, Campos-Martin R, Grenier-Boley B, Andrade V, 2022. New insights into the genetic etiology of Alzheimer's disease and related dementias. Nat Genet 54: 412–436. 10.1038/s41588-022-01024-z
- ↵Bennett FC, Bennett ML, Yaqoob F, Mulinyawe SB, Grant GA, Hayden Gephart M, Plowey ED, Barres BA. 2018. A combination of ontogeny and CNS environment establishes microglial identity. Neuron 98: 1170–1183.e8. 10.1016/j.neuron.2018.05.014
- ↵Bettcher BM, Tansey MG, Dorothée G, Heneka MT. 2021. Peripheral and central immune system crosstalk in Alzheimer disease: a research prospectus. Nat Rev Neurol 17: 689–701. 10.1038/s41582-021-00549-x
- ↵Bloomfield CL, Gong J, Droho S, Makinde HM, Gurra MG, Stumpf CH, Kharel A, Gadhvi G, Winter DR, Cui W, 2024. Retinal microglia express more MHC class I and promote greater T-cell-driven inflammation than brain microglia. Front Immunol 15: 1399989. 10.3389/fimmu.2024.1399989
- ↵Böttcher C, Schlickeiser S, Sneeboer MAM, Kunkel D, Knop A, Paza E, Fidzinski P, Kraus L, Snijders GJL, Kahn RS, 2019. Human microglia regional heterogeneity and phenotypes determined by multiplexed single-cell mass cytometry. Nat Neurosci 22: 78–90. 10.1038/s41593-018-0290-2
- ↵Buenrostro JD, Giresi PG, Zaba LC, Chang HY, Greenleaf WJ. 2013. Transposition of native chromatin for fast and sensitive epigenomic profiling of open chromatin, DNA-binding proteins and nucleosome position. Nat Methods 10: 1213–1218. 10.1038/nmeth.2688
- ↵Busche MA, Hyman BT. 2020. Synergy between amyloid-beta and tau in Alzheimer's disease. Nat Neurosci 23: 1183–1193. 10.1038/s41593-020-0687-6
- ↵Butler A, Hoffman P, Smibert P, Papalexi E, Satija R. 2018. Integrating single-cell transcriptomic data across different conditions, technologies, and species. Nat Biotechnol 36: 411–420. 10.1038/nbt.4096
- ↵Butovsky O, Weiner HL. 2018. Microglial signatures and their role in health and disease. Nat Rev Neurosci 19: 622–635. 10.1038/s41583-018-0057-5
- ↵Cano-Gamez E, Trynka G. 2020. From GWAS to function: using functional genomics to identify the mechanisms underlying complex diseases. Front Genet 11: 424. 10.3389/fgene.2020.00424
- ↵Corces MR, Shcherbina A, Kundu S, Gloudemans MJ, Frésard L, Granja JM, Louie BH, Eulalio T, Shams S, Bagdatli ST, 2020. Single-cell epigenomic analyses implicate candidate causal variants at inherited risk loci for Alzheimer's and Parkinson's diseases. Nat Genet 52: 1158–1168. 10.1038/s41588-020-00721-x
- ↵Crosby LM, Waters CM. 2010. Epithelial repair mechanisms in the lung. Am J Physiol Lung Cell Mol Physiol 298: L715–L731. 10.1152/ajplung.00361.2009
- ↵de Leeuw CA, Mooij JM, Heskes T, Posthuma D. 2015. MAGMA: generalized gene-set analysis of GWAS data. PLoS Comput Biol 11: e1004219. 10.1371/journal.pcbi.1004219
- ↵Durazzo TC, Mattsson N, Weiner MW, Alzheimer's Disease Neuroimaging Initiative. 2014. Smoking and increased Alzheimer's disease risk: a review of potential mechanisms. Alzheimers Dement 10: S122–S145. 10.1016/j.jalz.2014.04.009
- ↵The ENCODE Project Consortium, Moore JE, Purcaro MJ, Pratt HE, Epstein CB, Shoresh N, Adrian J, Kawli T, Davis CA, Dobin A, 2020. Expanded encyclopaedias of DNA elements in the human and mouse genomes. Nature 583: 699–710. 10.1038/s41586-020-2493-4
- ↵Fan Q, Maranville JC, Fritsche L, Sim X, Cheung CMG, Chen LJ, Gorski M, Yamashiro K, Ahn J, Laude A, 2017. HDL-cholesterol levels and risk of age-related macular degeneration: a multiethnic genetic study using Mendelian randomization. Int J Epidemiol 46: 1891–1902. 10.1093/ije/dyx189
- ↵Finucane HK, Bulik-Sullivan B, Gusev A, Trynka G, Reshef Y, Loh PR, Anttila V, Xu H, Zang C, Farh K, 2015. Partitioning heritability by functional annotation using genome-wide association summary statistics. Nat Genet 47: 1228–1235. 10.1038/ng.3404
- ↵Finucane HK, Reshef YA, Anttila V, Slowikowski K, Gusev A, Byrnes A, Gazal S, Loh PR, Lareau C, Shoresh N, 2018. Heritability enrichment of specifically expressed genes identifies disease-relevant tissues and cell types. Nat Genet 50: 621–629. 10.1038/s41588-018-0081-4
- ↵Friedman DS, O'Colmain BJ, Munoz B, Tomany SC, McCarty C, de Jong PT, Nemesure B, Mitchell P, Kempen J, Eye Diseases Prevalence Research Group. 2004. Prevalence of age-related macular degeneration in the United States. Arch Ophthalmol 122: 564–572. 10.1001/archopht.122.7.1019
- ↵Fritsche LG, Fariss RN, Stambolian D, Abecasis GR, Curcio CA, Swaroop A. 2014. Age-related macular degeneration: genetics and biology coming together. Annu Rev Genomics Hum Genet 15: 151–171. 10.1146/annurev-genom-090413-025610
- ↵Fritsche LG, Igl W, Bailey JN, Grassmann F, Sengupta S, Bragg-Gresham JL, Burdon KP, Hebbring SJ, Wen C, Gorski M, 2016. A large genome-wide association study of age-related macular degeneration highlights contributions of rare and common variants. Nat Genet 48: 134–143. 10.1038/ng.3448
- ↵Ginhoux F, Greter M, Leboeuf M, Nandi S, See P, Gokhan S, Mehler MF, Conway SJ, Ng LG, Stanley ER, 2010. Fate mapping analysis reveals that adult microglia derive from primitive macrophages. Science 330: 841–845. 10.1126/science.1194637
- ↵Gu Z, Eils R, Schlesner M. 2016. Complex heatmaps reveal patterns and correlations in multidimensional genomic data. Bioinformatics 32: 2847–2849. 10.1093/bioinformatics/btw313
- ↵Guilliams M, Ginhoux F, Jakubzick C, Naik SH, Onai N, Schraml BU, Segura E, Tussiwand R, Yona S. 2014. Dendritic cells, monocytes and macrophages: a unified nomenclature based on ontogeny. Nat Rev Immunol 14: 571–578. 10.1038/nri3712
- ↵Hafemeister C, Satija R. 2019. Normalization and variance stabilization of single-cell RNA-seq data using regularized negative binomial regression. Genome Biol 20: 296. 10.1186/s13059-019-1874-1
- ↵Hammond TR, Marsh SE, Stevens B. 2019. Immune signaling in neurodegeneration. Immunity 50: 955–974. 10.1016/j.immuni.2019.03.016
- ↵Haney MS, Pálovics R, Munson CN, Long C, Johansson PK, Yip O, Dong W, Rawat E, West E, Schlachetzki JCM, 2024. APOE4/4 is linked to damaging lipid droplets in Alzheimer's disease microglia. Nature 628: 154–161. 10.1038/s41586-024-07185-7
- ↵Hansen DV, Hanson JE, Sheng M. 2018. Microglia in Alzheimer's disease. J Cell Biol 217: 459–472. 10.1083/jcb.201709069
- ↵Hao Y, Hao S, Andersen-Nissen E, Mauck WM, III, Zheng S, Butler A, Lee MJ, Wilk AJ, Darby C, Zager M, 2021. Integrated analysis of multimodal single-cell data. Cell 184: 3573–3587.e29. 10.1016/j.cell.2021.04.048
- ↵Hou Y, Dan X, Babbar M, Wei Y, Hasselbalch SG, Croteau DL, Bohr VA. 2019. Ageing as a risk factor for neurodegenerative disease. Nat Rev Neurol 15: 565–581. 10.1038/s41582-019-0244-7
- ↵Hulsen T. 2022. DeepVenn: a web application for the creation of area-proportional Venn diagrams using the deep learning framework Tensorflow.js. arXiv:2210.04597 [cs.HC]. 10.48550/arXiv.2210.04597
- ↵Hussain SM, Robb C, Tonkin AM, Lacaze P, Chong TT, Beilin LJ, Yu C, Watts GF, Ryan J, Ernst ME, 2024. Association of plasma high-density lipoprotein cholesterol level with risk of incident dementia: a cohort study of healthy older adults. Lancet Reg Health West Pac 43: 100963. 10.1016/j.lanwpc.2023.100963
- ↵Insel PS, Hansson O, Mattsson-Carlgren N. 2021. Association between apolipoprotein E ε2 vs ε4, age, and β-amyloid in adults without cognitive impairment. JAMA Neurol 78: 229–235. 10.1001/jamaneurol.2020.3780
- ↵Iotchkova V, Ritchie GRS, Geihs M, Morganella S, Min JL, Walter K, Timpson NJ, UK10K Consortium, Dunham I, Birney E, 2019. GARFIELD classifies disease-relevant genomic features through integration of functional annotations with association signals. Nat Genet 51: 343–353. 10.1038/s41588-018-0322-6
- ↵Killick J, Morisse G, Sieger D, Astier AL. 2018. Complement as a regulator of adaptive immunity. Semin Immunopathol 40: 37–48. 10.1007/s00281-017-0644-y
- ↵Kjeldsen EW, Thomassen JQ, Juul Rasmussen I, Nordestgaard BG, Tybjærg-Hansen A, Frikke-Schmidt R. 2022. Plasma high-density lipoprotein cholesterol and risk of dementia: observational and genetic studies. Cardiovasc Res 118: 1330–1343. 10.1093/cvr/cvab164
- ↵Korsunsky I, Millard N, Fan J, Slowikowski K, Zhang F, Wei K, Baglaenko Y, Brenner M, Loh PR, Raychaudhuri S. 2019. Fast, sensitive and accurate integration of single-cell data with Harmony. Nat Methods 16: 1289–1296. 10.1038/s41592-019-0619-0
- ↵Kosoy R, Fullard JF, Zeng B, Bendl J, Dong P, Rahman S, Kleopoulos SP, Shao Z, Girdhar K, Humphrey J, 2022. Genetics of the human microglia regulome refines Alzheimer's disease risk loci. Nat Genet 54: 1145–1154. 10.1038/s41588-022-01149-1
- ↵Kuchroo M, DiStasio M, Song E, Calapkulu E, Zhang L, Ige M, Sheth AH, Majdoubi A, Menon M, Tong A, 2023. Single-cell analysis reveals inflammatory interactions driving macular degeneration. Nat Commun 14: 2589. 10.1038/s41467-023-37025-7
- ↵Labzin LI, Heneka MT, Latz E. 2018. Innate immunity and neurodegeneration. Annu Rev Med 69: 437–449. 10.1146/annurev-med-050715-104343
- ↵Lawson LJ, Perry VH, Dri P, Gordon S. 1990. Heterogeneity in the distribution and morphology of microglia in the normal adult mouse brain. Neuroscience 39: 151–170. 10.1016/0306-4522(90)90229-W
- ↵Li F, Jiang D, Samuel MA. 2019. Microglia in the developing retina. Neural Dev 14: 12. 10.1186/s13064-019-0137-x
- ↵London A, Benhar I, Schwartz M. 2013. The retina as a window to the brain-from eye research to CNS disorders. Nat Rev Neurol 9: 44–53. 10.1038/nrneurol.2012.227
- ↵Lopes KP, Snijders GJL, Humphrey J, Allan A, Sneeboer MAM, Navarro E, Schilder BM, Vialle RA, Parks M, Missall R, 2022. Genetic analysis of the human microglial transcriptome across brain regions, aging and disease pathologies. Nat Genet 54: 4–17. 10.1038/s41588-021-00976-y
- ↵Ma K, Nakajima H, Basak N, Barman A, Ratnapriya R. 2025. Integrating explainable machine learning and transcriptomics data reveals cell-type specific immune signatures underlying macular degeneration. NPJ Genom Med 10: 48. 10.1038/s41525-025-00507-2
- ↵Macosko EZ, Basu A, Satija R, Nemesh J, Shekhar K, Goldman M, Tirosh I, Bialas AR, Kamitaki N, Martersteck EM, 2015. Highly parallel genome-wide expression profiling of individual cells using nanoliter droplets. Cell 161: 1202–1214. 10.1016/j.cell.2015.05.002
- ↵Manouchehri N, Salinas VH, Hussain RZ, Stüve O. 2023. Distinctive transcriptomic and epigenomic signatures of bone marrow-derived myeloid cells and microglia in CNS autoimmunity. Proc Natl Acad Sci 120: e2212696120. 10.1073/pnas.2212696120
- ↵McKay GJ, Patterson CC, Chakravarthy U, Dasari S, Klaver CC, Vingerling JR, Ho L, de Jong PT, Fletcher AE, Young IS, 2011. Evidence of association of APOE with age-related macular degeneration: a pooled analysis of 15 studies. Hum Mutat 32: 1407–1416. 10.1002/humu.21577
- ↵Menon M, Mohammadi S, Davila-Velderrain J, Goods BA, Cadwell TD, Xing Y, Stemmer-Rachamimov A, Shalek AK, Love JC, Kellis M, 2019. Single-cell transcriptomic atlas of the human retina identifies cell types associated with age-related macular degeneration. Nat Commun 10: 4902. 10.1038/s41467-019-12780-8
- ↵Morabito S, Miyoshi E, Michael N, Shahin S, Martini AC, Head E, Silva J, Leavy K, Perez-Rosendahl M, Swarup V. 2021. Single-nucleus chromatin accessibility and transcriptomic characterization of Alzheimer's disease. Nat Genet 53: 1143–1155. 10.1038/s41588-021-00894-z
- ↵Murenu E, Gerhardt MJ, Biel M, Michalakis S. 2022. More than meets the eye: the role of microglia in healthy and diseased retina. Front Immunol 13: 1006897. 10.3389/fimmu.2022.1006897
- ↵Nussenblatt RB, Lee RW, Chew E, Wei L, Liu B, Sen HN, Dick AD, Ferris FL. 2014. Immune responses in age-related macular degeneration and a possible long-term therapeutic strategy for prevention. Am J Ophthalmol 158: 5–11.e2. 10.1016/j.ajo.2014.03.014
- ↵O'Koren EG, Yu C, Klingeborn M, Wong AYW, Prigge CL, Mathew R, Kalnitsky J, Msallam RA, Silvin A, Kay JN, 2019. Microglial function is distinct in different anatomical locations during retinal homeostasis and degeneration. Immunity 50: 723–737.e7. 10.1016/j.immuni.2019.02.007
- ↵Orozco LD, Chen HH, Cox C, Katschke KJ, Arceo R, Espiritu C, Caplazi P, Nghiem SS, Chen YJ, Modrusan Z, 2020. Integration of eQTL and a single-cell atlas in the human eye identifies causal genes for age-related macular degeneration. Cell Rep 30: 1246–1259.e6. 10.1016/j.celrep.2019.12.082
- ↵Paolicelli RC, Bolasco G, Pagani F, Maggi L, Scianni M, Panzanelli P, Giustetto M, Ferreira TA, Guiducci E, Dumas L, 2011. Synaptic pruning by microglia is necessary for normal brain development. Science 333: 1456–1458. 10.1126/science.1202529
- ↵Parmeggiani F, Romano MR, Costagliola C, Semeraro F, Incorvaia C, D'Angelo S, Perri P, De Palma P, De Nadai K, Sebastiani A. 2012. Mechanism of inflammation in age-related macular degeneration. Mediators Inflamm 2012: 546786. 10.1155/2012/546786
- ↵Penfold PL, Killingsworth MC, Sarks SH. 1985. Senile macular degeneration: the involvement of immunocompetent cells. Graefes Arch Clin Exp Ophthalmol 223: 69–76. 10.1007/BF02150948
- ↵Peng YR, Shekhar K, Yan W, Herrmann D, Sappington A, Bryman GS, van Zyl T, Do MTH, Regev A, Sanes JR. 2019. Molecular classification and comparative taxonomics of foveal and peripheral cells in primate retina. Cell 176: 1222–1237.e22. 10.1016/j.cell.2019.01.004
- ↵Ponnappan S, Ponnappan U. 2011. Aging and immune function: molecular mechanisms to interventions. Antioxid Redox Signal 14: 1551–1585. 10.1089/ars.2010.3228
- ↵Qin X, Gao B. 2006. The complement system in liver diseases. Cell Mol Immunol 3: 333–340.
- ↵Rashid K, Akhtar-Schaefer I, Langmann T. 2019. Microglia in retinal degeneration. Front Immunol 10: 1975. 10.3389/fimmu.2019.01975
- ↵Ratnapriya R, Sosina OA, Starostik MR, Kwicklis M, Kapphahn RJ, Fritsche LG, Walton A, Arvanitis M, Gieser L, Pietraszkiewicz A, 2019. Retinal transcriptome and eQTL analyses identify genes associated with age-related macular degeneration. Nat Genet 51: 606–610. 10.1038/s41588-019-0351-9
- ↵Ratnapriya R, Acar IE, Geerlings MJ, Branham K, Kwong A, Saksens NTM, Pauper M, Corominas J, Kwicklis M, Zipprer D, 2020. Family-based exome sequencing identifies rare coding variants in age-related macular degeneration. Hum Mol Genet 29: 2022–2034. 10.1093/hmg/ddaa057
- ↵Ratnapriya R, Grassman F, Chen R, Hewitt A, Du J, Saban DR, Klaver CCW, Ash J, Stambolian D, Tumminia SJ, 2025. Functional genomics in age-related macular degeneration: from genetic associations to understanding disease mechanisms. Exp Eye Res 254: 110344. 10.1016/j.exer.2025.110344
- ↵R Core Team. 2025. R: a language and environment for statistical computing. R Foundation for Statistical Computing, Vienna. https://www.R-project.org/.
- ↵Sepp M, Leiss K, Murat F, Okonechnikov K, Joshi P, Leushkin E, Spänig L, Mbengue N, Schneider C, Schmidt J, 2024. Cellular development and evolution of the mammalian cerebellum. Nature 625: 788–796. 10.1038/s41586-023-06884-x
- ↵Shi Q, Chowdhury S, Ma R, Le KX, Hong S, Caldarone BJ, Stevens B, Lemere CA. 2017. Complement C3 deficiency protects against neurodegeneration in aged plaque-rich APP/PS1 mice. Sci Transl Med 9: eaaf6295. 10.1126/scitranslmed.aaf6295
- ↵Stuart T, Butler A, Hoffman P, Hafemeister C, Papalexi E, Mauck WM, III, Hao Y, Stoeckius M, Smibert P, Satija R. 2019. Comprehensive integration of single-cell data. Cell 177: 1888–1902.e21. 10.1016/j.cell.2019.05.031
- ↵Stuart T, Srivastava A, Madad S, Lareau CA, Satija R. 2021. Single-cell chromatin state analysis with Signac. Nat Methods 18: 1333–1341. 10.1038/s41592-021-01282-5
- ↵Tsai HR, Lo RY, Liang KH, Chen TL, Huang HK, Wang JH, Lee YC. 2023. Risk of subsequent dementia or Alzheimer disease among patients with age-related macular degeneration: a systematic review and meta-analysis. Am J Ophthalmol 247: 161–169. 10.1016/j.ajo.2022.11.005
- ↵Velilla S, García-Medina JJ, García-Layana A, Dolz-Marco R, Pons-Vázquez S, Pinazo-Durán MD, Gómez-Ulla F, Arévalo JF, Díaz-Llopis M, Gallego-Pinazo R. 2013. Smoking and age-related macular degeneration: review and update. J Ophthalmol 2013: 895147. 10.1155/2013/895147
- ↵Velmeshev D, Perez Y, Yan Z, Valencia JE, Castaneda-Castellanos DR, Wang L, Schirmer L, Mayer S, Wick B, Wang S, 2023. Single-cell analysis of prenatal and postnatal human cortical development. Science 382: eadf0834. 10.1126/science.adf0834
- ↵Wang SK, Nair S, Li R, Kraft K, Pampari A, Patel A, Kang JB, Luong C, Kundaje A, Chang HY. 2022. Single-cell multiome of the human retina and deep learning nominate causal variants in complex eye diseases. Cell Genom 2: 100164. 10.1016/j.xgen.2022.100164
- ↵Wang J, Cheng X, Liang Q, Owen LA, Lu J, Zheng Y, Wang M, Chen S, DeAngelis MM, Li Y, 2023. Single-cell multiomics of the human retina reveals hierarchical transcription factor collaboration in mediating cell type-specific effects of genetic variants on gene regulation. Genome Biol 24: 269. 10.1186/s13059-023-03111-8
- ↵Wen LY, Wan L, Lai JN, Chen CS, Chen JJ, Wu MY, Hu KC, Chiu LT, Tien PT, Lin HJ. 2021. Increased risk of Alzheimer's disease among patients with age-related macular degeneration: a nationwide population-based study. PLoS One 16: e0250440. 10.1371/journal.pone.0250440
- ↵Williams MA, McKay GJ, Carson R, Craig D, Silvestri G, Passmore P. 2015. Age-related macular degeneration-associated genes in Alzheimer disease. Am J Geriatr Psychiatry 23: 1290–1296. 10.1016/j.jagp.2015.06.005
- ↵Wolf J, Boneva S, Rosmus DD, Agostini H, Schlunck G, Wieghofer P, Schlecht A, Lange C. 2022. In-depth molecular profiling specifies human retinal microglia identity. Front Immunol 13: 863158. 10.3389/fimmu.2022.863158
- ↵Xin Y, Lyu P, Jiang J, Zhou F, Wang J, Blackshaw S, Qian J. 2022. LRLoop: a method to predict feedback loops in cell-cell communication. Bioinformatics 38: 4117–4126. 10.1093/bioinformatics/btac447
- ↵Yan W, Peng YR, van Zyl T, Regev A, Shekhar K, Juric D, Sanes JR. 2020. Cell atlas of the human fovea and peripheral retina. Sci Rep 10: 9802. 10.1038/s41598-020-66092-9
- ↵Yu G, Wang LG, Han Y, He QY. 2012. clusterProfiler: an R package for comparing biological themes among gene clusters. OMICS 16: 284–287. 10.1089/omi.2011.0118
- ↵Yu C, Lad EM, Mathew R, Shiraki N, Littleton S, Chen Y, Hou J, Schlepckow K, Degan S, Chew L, 2024. Microglia at sites of atrophy restrict the progression of retinal degeneration via galectin-3 and Trem2. J Exp Med 221: e20231011. 10.1084/jem.20231011
- ↵Zhang W, Xiao D, Mao Q, Xia H. 2023. Role of neuroinflammation in neurodegeneration development. Signal Transduct Target Ther 8: 267. 10.1038/s41392-023-01486-5
- ↵Zhu K, Bendl J, Rahman S, Vicari JM, Coleman C, Clarence T, Latouche O, Tsankova NM, Li A, Brennand KJ, 2023. Multi-omic profiling of the developing human cerebral cortex at the single-cell level. Sci Adv 9: eadg3754. 10.1126/sciadv.adg3754