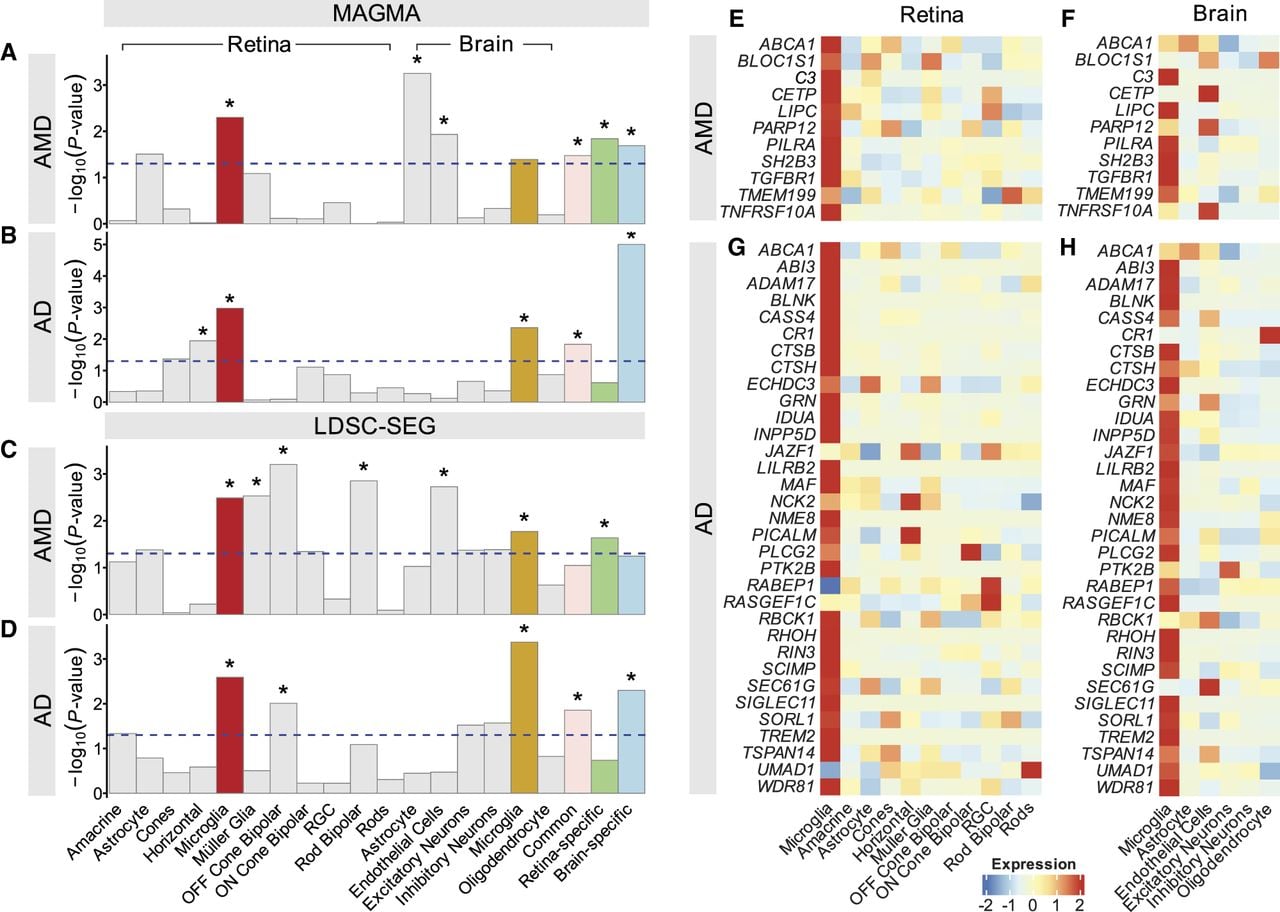
Integration of gene expression and GWAS data identified microglia as disease-critical cell type in AMD and AD. (A) MAGMA enrichment analysis of gene expression data from retina and brain cell types for AMD-associated variants. The plot shows the P-value for MAGMA enrichment of AMD-associated variants in gene expression across retina cell types. The x-axis represents the mean strength of association (–log10(P-value)), and the y-axis displays the different cell types. (B) Enrichment of AD–GWAS variants within retina and brain cell types using MAGMA. (C) Retina and brain cell type–specific enrichment of SNP heritability for AMD estimated using LDSC-SEG. The y-axis displays negative log10 P-values of enrichment P-value for each individual test. (D) Enrichment estimates for retina and brain cell types for AD–GWAS variants using LDSC-SEG. The dashed line indicates the P-value cutoff for individual annotations, and the asterisks represent statistical significance at a false-discovery rate (FDR) of >5% across all four plots. (E,F) Heatmap of AMD–GWAS genes across retina and brain cell types. This highlights that AMD–GWAS genes that are enriched in retina microglia (E) are also predominantly expressed in brain microglia (F). (G,H) Heatmap of AD–GWAS genes across retina and brain cell types. This reveals that AD–GWAS genes enriched in brain microglia (H) are also highly and specifically expressed in retina microglia (G). (RGC) Retinal ganglion cell, (Common) genes common to both retina and brain microglia, (Retina-specific) genes upregulated in retina microglia compared with brain microglia, and (Brain-specific) genes upregulated in brain microglia compared with retina microglia.