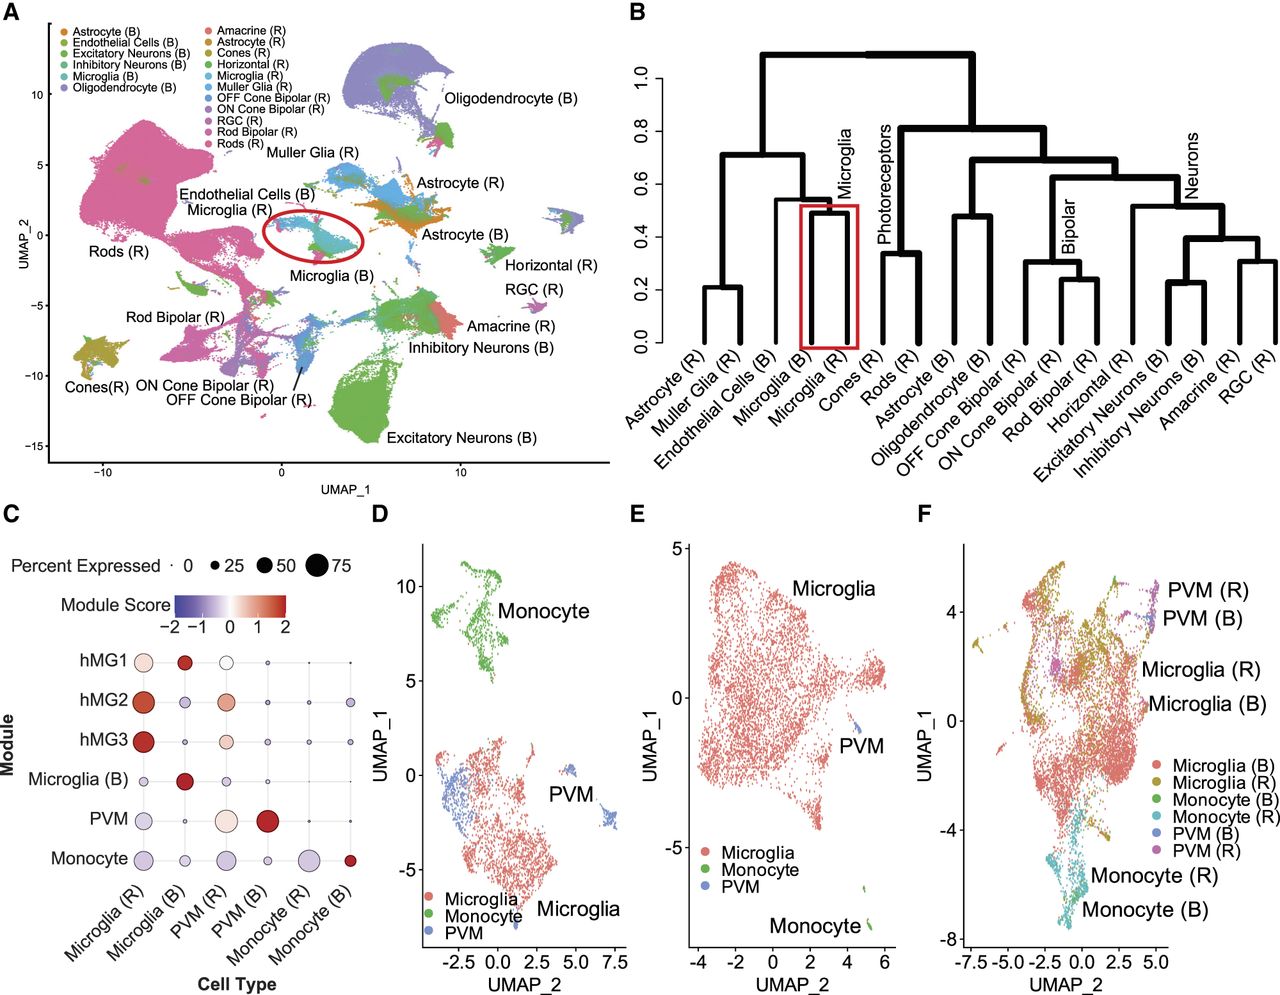
Shared transcriptome signature of retina and brain microglia. (A) The snRNA-seq analysis of retina and brain. The plot shows uniform manifold approximation and projection layouts (UMAP) for the 11 retina cell types and six brain cell types, with overlapping microglia cluster highlighted in a red circle. (B) Hierarchical clustering of cell type clusters from the retina and brain reveals distinct yet overlapping patterns of similarity. Notably, retina and brain microglia cluster together on the same branch, indicating a close relationship between these cell types across both tissues. (C) Dot plot of module scores displaying the z-scores for transcriptional signatures based on differentially expressed genes and curated markers, visualizing the expression profiles of annotated microglia subclusters. The color and size of each dot correspond to the average expression level and fraction of expressing cells, respectively. (D) High-resolution UMAP plots showing the distinct clustering of microglia, PVMs, and monocytes in the retina. (E) High-resolution UMAP plots of microglia, PVMs, and monocytes in the brain. (F) The UMAP plots show that the clusters of microglia, PVMs, and monocytes from both the retina and brain overlap perfectly, indicating a high degree of similarity in their subcluster organization across these two tissues. (RGC) Retinal ganglion cell, (hMG1) human retinal microglia clusters marker 1, (hMG2) human retinal microglia clusters marker 2 (hMG3) human retinal microglia clusters marker 3, and (PVM) perivascular macrophages.