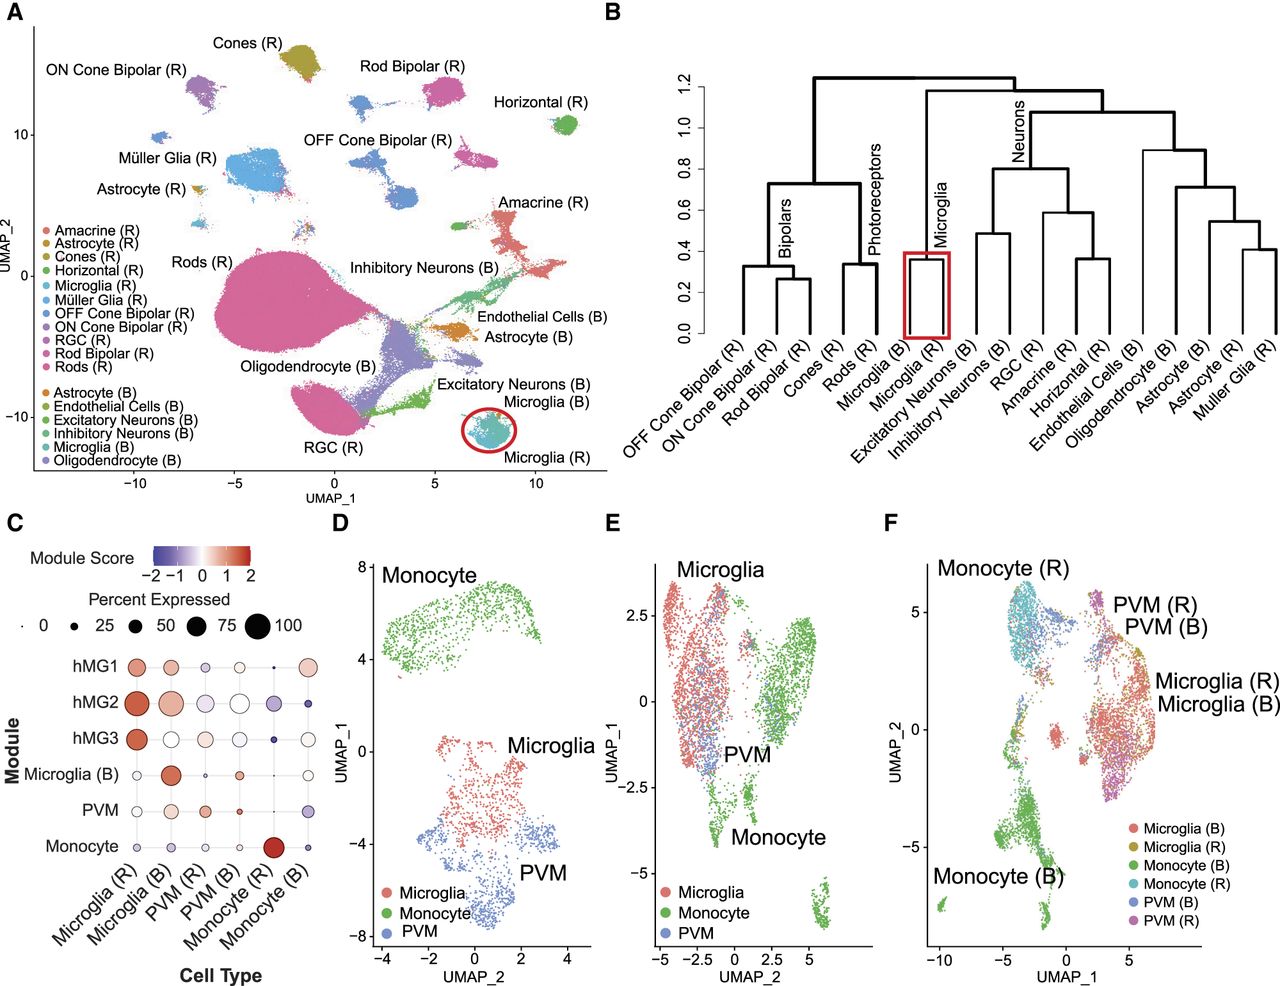
snATAC-seq analysis of the retina and brain. (A) UMAP of annotated clusters based on chromatin accessibility data from retina and brain cell types, with a red circle highlighting the overlap between retina and brain microglia clusters. (B) Hierarchical clustering of chromatin accessibility data shows that retina and brain microglia form a separate, closely related cluster, highlighted in a red box, distinct from other cell types. (C) Module scores based on differentially expressed gene lists and our curated marker list are visualized using a dot plot for the annotated microglia, PVMs, and monocyte clusters. The color and size of each dot correspond to the average expression level and fraction of expressing cells, respectively. (D) High-resolution UMAP plots of chromatin accessibility data highlight the distinct clustering of microglia, PVMs, and monocytes within the retina. (E) Higher-resolution UMAP plots of brain ATAC-seq data shows distinct clustering of microglia, PVMs, and monocytes. (F) UMAP plots reveal that the chromatin accessibility profiles of microglia and PVMs overlap closely between the retina and brain, suggesting conserved subcluster organization across these tissues. (RGC) Retinal ganglion cell, (hMG1) human retinal microglia clusters marker 1, (hMG2) human retinal microglia clusters marker 2, (hMG3) human retinal microglia clusters marker 3, and (PVM) perivascular macrophages.