
Spatial Cellular Networks from omics data with SpaCeNet
- Stefan Schrod1,9,
- Niklas Lück1,9,
- Robert Lohmayer2,
- Stefan Solbrig3,
- Dennis Völkl3,
- Tina Wipfler3,
- Katherine H. Shutta4,5,
- Marouen Ben Guebila4,
- Andreas Schäfer3,
- Tim Beißbarth1,6,
- Helena U. Zacharias7,
- Peter J. Oefner8,
- John Quackenbush4,5 and
- Michael Altenbuchinger1
- 1Department of Medical Bioinformatics, University Medical Center Göttingen, 37077 Göttingen, Germany;
- 2Leibniz Institute for Immunotherapy, 93053 Regensburg, Germany;
- 3Institute of Theoretical Physics, University of Regensburg, 93053 Regensburg, Germany;
- 4Department of Biostatistics, Harvard T.H. Chan School of Public Health, Boston, Massachusetts 02115, USA;
- 5Channing Division of Network Medicine, Department of Medicine, Brigham and Women's Hospital, Boston, Massachusetts 02115, USA;
- 6Campus Institute Data Science (CIDAS), University of Göttingen, 37077 Göttingen, Germany;
- 7Peter L. Reichertz Institute for Medical Informatics of TU Braunschweig and Hannover Medical School, Hannover Medical School, 30625 Hannover, Germany;
- 8Institute of Functional Genomics, University of Regensburg, 93053 Regensburg, Germany
Abstract
Advances in omics technologies have allowed spatially resolved molecular profiling of single cells, providing a window not only into the diversity and distribution of cell types within a tissue, but also into the effects of interactions between cells in shaping the transcriptional landscape. Cells send chemical and mechanical signals which are received by other cells, where they can subsequently initiate context-specific gene regulatory responses. These interactions and their responses shape the individual molecular phenotype of a cell in a given microenvironment. RNAs or proteins measured in individual cells, together with the cells' spatial distribution, provide invaluable information about these mechanisms and the regulation of genes beyond processes occurring independently in each individual cell. “SpaCeNet” is a method designed to elucidate both the intracellular molecular networks (how molecular variables affect each other within the cell) and the intercellular molecular networks (how cells affect molecular variables in their neighbors). This is achieved by estimating conditional independence (CI) relations between captured variables within individual cells and by disentangling these from CI relations between variables of different cells.
Measurements of spatially resolved RNA or protein expression patterns open unprecedented opportunities to study questions in areas such as developmental biology and pathophysiology, where interactions between cells are known to influence a wide range of processes. Methods such as “spatial transcriptomics” (Ståhl et al. 2016) and Slide-seq (Rodriques et al. 2019) used molecular barcoding to count mRNAs aggregated in small regions and integrated those with images to produce a transcript map. A drawback of these early methods was that mRNAs from multiple cells in a small region could contribute to the observed signal, masking differences between cells and cell–cell interactions. Subsequent barcoding techniques substantially improved resolution, such as Slide-seq (Rodriques et al. 2019) and Slide-seqV2 (Stickels et al. 2021) with a resolution of ∼10 μm, as well as, most recently, Seq-Scope (Cho et al. 2021) and Stereo-seq (Chen et al. 2022) with a resolution of ∼0.5 μm. In situ hybridization or sequencing methods can measure the expression of many genes with single-cell resolution (and even subcellular resolution) (Lee et al. 2014; Chen et al. 2015; Shah et al. 2016; Gyllborg et al. 2020), but these methods require complex instrumentation and long imaging times. Three-dimensional intact tissue sequencing in single cells has been achieved by STARmap (spatially resolved transcript amplicon readout mapping) (Wang et al. 2018), which is capable of measuring simultaneously the expression of ∼1000 genes at single-cell resolution in a three-dimensional thick tissue section. Although spatial omics technologies are in their infancy, the launch of commercial products such as the 10x Genomics Visium platform has led to increased interest in methods that will allow the analysis, interpretation, and exploration of data generated (Svensson et al. 2018; Arnol et al. 2019; Fan et al. 2019, 2022; Bergenstråhle et al. 2020; Xu et al. 2022).
Cells organize themselves spatially within tissues and organisms in order to carry out specific functions. This organization is orchestrated via signals that include physical interactions via cell–cell contact, chemical signals, and exosome-mediated transfer of RNAs between cells. Each cell's individual phenotype together with its location in space relative to other cells captures information about this process. For instance, genes encoding chemokines (chemoattractant cytokines that facilitate intercellular communication) are first transcribed and then translated before the respective proteins pass through the cell membrane into the extracellular domain where they recruit leukocytes. When these signals are received by the leukocytes, they initiate signaling cascades that finally induce a molecular response leading the cells to adapt their individual molecular phenotype and alter their behavior. Although such interactions are known to be essential for many biological processes (Armingol et al. 2021), there are no well-established statistical methods to investigate the relationships between spatial organization, gene or protein expression, and cellular phenotype. There are first approaches to infer cellular interactions from spatial omics, although they differ substantially with respect to semantics, modeling approaches, and overall objectives. In seminal work, Arnol et al. (2019) proposed spatial variance component analysis (SVCA) to decompose the expression of individual genes into spatial and nonspatial contributions, namely, into cell-intrinsic effects, general environmental effects, and cell–cell interaction effects. SVCA is motivated by Gaussian processes and models the expression of genes independently of each other. Thus, it does not capture complex multivariate relationships between genes (Arnol et al. 2019), but detects individual genes which are involved in cell–cell interactions. Another approach is node-centric expression modeling (NCEM) (Fischer et al. 2023). NCEM uses a graph neural network to predict cells' observed gene expression vector from respective cell type label and niche, with the latter resembling cell–cell communication in terms of statistical dependencies between cells. As such, NCEM identifies cell-type couplings. However, it does not identify gene pairs involved in cellular interactions. This was addressed by COMMunication analysis by Optimal Transport (COMMOT) using the framework of optimal transport to account for the competition among ligand and receptor species, while taking into account the spatial distances between cells (Cang et al. 2023), by Mixture of Experts for Spatial Signaling genes Identification (MESSI) considering an additional cell neighborhood to infer intracellular responses (Li et al. 2021), and by Multiview Intercellular SpaTial modeling framework (MISTy) using an aggregated direct neighborhood to resolve spatial effects (Tanevski et al. 2022). However, rigorous statistical models to infer complex cellular interdependencies from spatially distributed molecular data are still missing.
The statistical inference of correlation-based molecular networks from high-dimensional omics data is based on the assumption that coordinated expression in a cell might provide insight into processes that are activated or inactivated in different phenotypes. Early attempts used pairwise measures of gene–gene coexpression such as mutual exclusivity, Pearson's and Spearman's correlation, and identified network edges between genes based on a correlation threshold (Margolin et al. 2006; Marbach et al. 2012). Such measures of coexpression can provide insight into active biological mechanisms, but they are vulnerable to identifying spurious associations (Altenbuchinger et al. 2020). These associations can be the consequence of indirect dependencies that cannot be resolved if pairwise relationships between molecular variables are considered only in isolation from all other molecular variables. This stimulated research in high-dimensional statistics, specifically in probabilistic graphical models (PGMs). An instance of PGMs is Gaussian graphical models (GGMs), also known as partial correlations. GGMs resolve the dependency structure of molecular variables under the assumption of multivariate normality. GGMs disentangle direct from indirect associations. This is even possible in high-dimensional settings, where the number of variables is larger than the number of observations (Altenbuchinger et al. 2020). The main concept underlying GGMs is conditional independence (CI). Two variables X and Y are considered as conditionally independent (given all remaining variables), if X does not provide any additional information about Y that is not already covered by the remaining variables. Thus, although X and Y might be pairwise correlated, they can still be conditionally independent; the pairwise correlation could be just the consequence of X's and Y's indirect relationship mediated via other variables and not due to a direct relationship (Shutta et al. 2022). This powerful concept made GGMs one of the favored approaches to resolve molecular networks from molecular data (Marbach et al. 2012) and, importantly, they can be straightforwardly extended to account for complex single-cell and multiomics data (Wu and Luo 2022; Shutta et al. 2023). It is nevertheless noteworthy that GGMs are undirected graphical models and do not resolve causal relationships, although, in principle, lower bounds on causal effects can be derived from observational data (Maathuis et al. 2009).
Spatial Cellular Networks from omics data (SpaCeNet) is a method for analyzing patterns of correlation in spatial transcriptomics data by extending the concept of CI to spatially distributed information, facilitating the reconstruction of both the intracellular and the intercellular interaction networks with single-cell spatial resolution. SpaCeNet was developed to address the diversity of cellular interactions and the various length scales over which they occur. SpaCeNet introduces flexible interaction potentials in combination with appropriate regularization strategies to allow this diversity in the cellular state, tissue organization, and spatial communication to be handled effectively. We validate SpaCeNet in extensive simulation studies and illustrate its capacity to augment exploratory data analysis of spatial transcriptomics data from the mouse visual cortex, mouse organogenesis, and the Drosophila blastoderm.
Results
SpaCeNet infers cell–cell interactions from spatial omics data
SpaCeNet concept
The individual molecular phenotype of a cell is shaped by its microenvironment and the underlying processes are diverse, comprising the exchange of signals via direct physical contact or via signaling molecules. Throughout the article, we will refer to any process with which cells affect each other's molecular appearance simply as cell–cell or cellular “interactions.” Spatial transcriptomics (ST) involves measuring cellular phenotypes along with cells' location in space, providing information about such processes and serving as a valuable resource to study cell–cell interactions. To develop SpaCeNet, we require single-cell resolved ST data (single-cell profiles + cellular positions) such that cells can be described as interacting units. In recent years, such data have become increasingly available via both multiplexing and barcoding techniques (Wang et al. 2018; Cho et al. 2021; Chen et al. 2022).
Key to SpaCeNet is a statistically sound approach that uses PGMs to decompose the observed cellular profiles into contributions arising from ordinary cellular variability and contributions from cellular interactions (Schrod et al. 2024). Formally, SpaCeNet decomposes each cell's observed molecular profile into (1) a baseline contribution corresponding to the cell's molecular profile in isolation (Fig. 1A) and (2) a residual contribution attributed to its interaction with other cells (Fig. 1B,C). Importantly, this decomposition uses a model parametrization such that vanishing parameters encode CI statements, namely, intracellular and intercellular spatial conditional independence (SCI) relationships as introduced in the following and as summarized in Supplemental Figure S1.
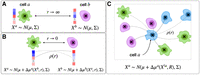
SpaCeNet concept and how it applies to different cellular contexts. (A) A schematic picture of two isolated cells a and b which are infinitely separated (distance r → ∞). In this case, respective cellular profiles with expression levels illustrated in blue and red are modeled by a multivariate
normal distribution with mean expression μ and covariance Σ. The latter encodes the complex coexpression pattern of different RNAs/proteins and facilitates a description
of molecularly diverse cells. (B) A scenario of two neighboring cells, where the cells affect each other; the molecular phenotype changes compared to A as a consequence of the different cellular context. This molecular adaptation of cell a (analogously for cell b) is modeled by a shifted mean expression vector μ + Δμa(Xb, r), where the molecular adaptation depends on the molecular phenotype of cell b and the cell–cell distance r. The molecular adaptation is parameterized by interaction potentials which directly provide estimates of spatial gene–gene
dependencies between gene i and j. (C) A sketch of the more complex scenario of a set of interacting cells. Here, the expression of the cell a is affected by all surrounding cells in a distance-dependent way, as illustrated by thin and bold dotted lines for long-
and short-range interactions, respectively. One should note that the mean expression of the cell a now depends on the molecular phenotype of all other cells  as well as all respective cell–cell distances summarized in R.
Undirected PGMs are graphical models in which nodes represent variables assumed to be distributed according to a probabilistic model and edges between nodes represent conditional dependence between them, where the conditioning is on the remaining nodes in the network. The absence of edges defines a set of CI relations corresponding to direct pairwise independence between variables: for two variables X and Y that are CI, any association between X and Y observed in the data can be attributed to indirect effects of other variables in the system. Conversely, if X and Y are not CI, that is, there is an edge between the two, this dependence is not mediated by other variables in the system. As such, PGMs identify and remove potential erroneous (false-positive; indirect) associations. This makes PGMs versatile tools to infer gene-association networks, as repeatedly shown in the literature (Marbach et al. 2012; Altenbuchinger et al. 2020).
Here, we develop a similar framework to model intracellular and intercellular CI relations in ST data. We estimate SCI between
variable  (gene i in cell a) and variable
  (gene j in another cell b) keeping all other variables in the data fixed; similar to CI, by conditioning on all variables except for
  and
and  , we can study the direct dependence of
  on
on  and vice versa. As such, SpaCeNet disentangles (1) direct from indirect relationships of variables in individual cells, and
(2) direct from indirect relationships between molecular variables in different cells. A direct consequence of both is that
each cell's environmental adaptation in its spatial context can be estimated distinctly from its molecular phenotype in isolation.
Because we are interested in sample estimates of cellular interaction patterns, SpaCeNet infers SCI simultaneously across
all pairs of cells in an ST data set.
and vice versa. As such, SpaCeNet disentangles (1) direct from indirect relationships of variables in individual cells, and
(2) direct from indirect relationships between molecular variables in different cells. A direct consequence of both is that
each cell's environmental adaptation in its spatial context can be estimated distinctly from its molecular phenotype in isolation.
Because we are interested in sample estimates of cellular interaction patterns, SpaCeNet infers SCI simultaneously across
all pairs of cells in an ST data set.
SpaCeNet infers both short and long-range cell–cell interactions while taking into account the molecular diversity of cells
SpaCeNet encodes intercellular SCI relationships via interaction potentials mediating the association strength between molecular
variables across cells in a distance-dependent manner. We denote the interaction potential between  (gene i in cell a) and
  (gene j in cell b) at distance rab as ρij(rab). Because ρij(rab) depends only on the distance rab between two cells, the intercellular potential between genes
  and
and  takes the same functional form across all modeled cells a and b. Moreover, vanishing potentials ρij(rab) imply that
  and
and  are SCI across all cells a and b. One might ask whether such a one-function-fits-all approach is appropriate to model complex cellular communication between
molecularly diverse cells, considering that even related cell types, such as T cells and B cells, fulfill very different tasks
and are expected to send and receive very different signals. As briefly illustrated, SpaCeNet can encode such diverse cell–cell
communication patterns taking into account the individual cell's molecular phenotype without requiring a priori specification
of involved cell types, variables, and interaction mechanisms. Considering the conditional distribution of
are SCI across all cells a and b. One might ask whether such a one-function-fits-all approach is appropriate to model complex cellular communication between
molecularly diverse cells, considering that even related cell types, such as T cells and B cells, fulfill very different tasks
and are expected to send and receive very different signals. As briefly illustrated, SpaCeNet can encode such diverse cell–cell
communication patterns taking into account the individual cell's molecular phenotype without requiring a priori specification
of involved cell types, variables, and interaction mechanisms. Considering the conditional distribution of  given the “rest” (Eq. 9), we see that
  can be modeled by a linear regression involving
  as predictor variable, where the contribution of
  to the mean expression of
  is given by
 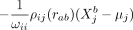 . Thus, the effect that the molecular variable
  in cell b exerts on
  in cell a via cell–cell interaction is directly related to the individual molecular profile of cell b, which means that the molecular phenotype of a cell determines how it communicates with other cells. One should also note
that SpaCeNet infers the ρij(r) without assuming a particular functional dependence on rab via series expansion in powers of 1/rab. This series expansion is motivated by the fact that infinitely separated cells cannot communicate through the release or
absorbance of particular signaling molecules and the drop in concentration of these molecules with distance suggests that
ρij(rab) should vanish for rab → ∞.
in cell a via cell–cell interaction is directly related to the individual molecular profile of cell b, which means that the molecular phenotype of a cell determines how it communicates with other cells. One should also note
that SpaCeNet infers the ρij(r) without assuming a particular functional dependence on rab via series expansion in powers of 1/rab. This series expansion is motivated by the fact that infinitely separated cells cannot communicate through the release or
absorbance of particular signaling molecules and the drop in concentration of these molecules with distance suggests that
ρij(rab) should vanish for rab → ∞.
To show that SpaCeNet can reconstruct diverse cell–cell interactions, we performed four illustrative simulations shown in
Figure 2A–D, where we simulated radial dependencies corresponding to long-distance interactions (via cell signaling) (Fig. 2A,B), short-distance interactions (such as via cell–cell contact) using an exponentially decreasing potential with short range
(Fig. 2C), and an interaction where the potential first grows with rab, peaks at average distances, and then goes to zero for large rab (Fig. 2D). The precise radial dependencies are provided in the caption of Figure 2. In principle, SpaCeNet can model interaction potentials to arbitrary orders in 1/rab. We present the corresponding radial dependencies estimated via SpaCeNet for expansions up to order (1/rab)L for  (solid lines),
  (dashed lines), and
  (dotted lines). As expected, the approximation of the true underlying interaction improves with increasing L. However, increasing the order in 1/rab results in higher model complexity, which in turn comes at the cost of additional parameters, increasing the risk of overfitting
and computational burden.
(dotted lines). As expected, the approximation of the true underlying interaction improves with increasing L. However, increasing the order in 1/rab results in higher model complexity, which in turn comes at the cost of additional parameters, increasing the risk of overfitting
and computational burden.
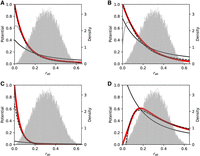
SpaCeNet can reconstruct diverse cellular interaction patterns. (A–D) Different potentials are used to simulate data in red in dependence on the distance between cells rab. Potentials inferred by SpaCeNet are shown for three different expansion orders: L = 1 (black solid lines), L = 3 (black dashed lines), and L = 10 (black dotted lines), illustrating that with higher order, increasingly complex cellular interactions can be reconstructed.
The corresponding ground-truth potentials (red lines) are (A) a standard decreasing potential corresponding to the second-order term in the series expansion, ρ(rab) = (1 − exp(−rab/r0))2(r0/rab)2 with r0 = 1/10, (B) a long-range exponential potential  , (C) a short-range exponential potential
  , and (D) a potential
  which increases for small rab and then decreases again. The corresponding densities of the pairwise distances rab are shown as histograms in the background of the figures with the respective y-axis depicted at the figures' right axis. For more details about data simulation see Supplemental Section 1.
SpaCeNet recovers inter- and intracellular interactions from in silico–generated tissues
We systematically evaluated SpaCeNet's capacity to reconstruct intra- and intercellular networks defined in terms of SCI relationships.
To this end, we generated in silico tissues from the full probability density Equation 1 and tested if the ground truth intra- and intercellular network edges are correctly recovered (see also Supplemental Section 2). Because cellular interactions occur at various length scales, we performed four different studies involving (1) long-range
interactions, (2) medium-range interactions, (3) short-range interactions, and (4) a mixture of long-, medium-, and short-range
interactions. For each study, we simulated a total of  cells, where n is the number of cells per ST slide and S ∈ {1, 10, 100} is the number of ST slides. Performance was assessed using the area under the precision-recall curve (AUPRC)
and the area under the receiver operating characteristic curve (AUROC) (see Supplemental Table S1).
cells, where n is the number of cells per ST slide and S ∈ {1, 10, 100} is the number of ST slides. Performance was assessed using the area under the precision-recall curve (AUPRC)
and the area under the receiver operating characteristic curve (AUROC) (see Supplemental Table S1).
In our first simulation study, we used an exponentially decreasing interaction potential  with a comparatively large range of
  . Supplemental Figure S4A gives AUPRC versus n · S to recover the correct intracellular networks (the intracellular precision matrix Ω, left figure) and the intercellular interaction networks (the cell–cell interaction parameters Δρ, right figure). We find that SpaCeNet is capable of reconstructing intracellular networks across the full range of simulated
cells, n · S, with a median AUPRC larger than ∼0.85 throughout all settings. Edge recovery of cell–cell interactions was achieved with
a median AUPRC ranging from 0.28 for n = 103 and S = 1 (blue) to 0.92 for n = 103 and S = 100. It is worth noting that edge recovery for both the intra- and intercellular networks was slightly better if cells
are distributed across measurements, as seen by comparison of the AUPRC for n = 103 and S = 1 (blue), for n = 100 and S = 10 (orange), and for n = 10 and S = 100 (green), that all share the same total number of cells n · S = 103. This trend also persisted for n · S = 104. We also tested the same class of potentials with medium range 1/ϕij = 1/10 (Supplemental Fig. S4B) and short range 1/ϕij = 1/20 (Supplemental Fig. S4C). The results were similar to the first simulation study. The edge recovery in terms of AUPRC improved with an increasing
number of cells n · S, the more so when cells were distributed across multiple samples S. Finally, we studied how diverse cell–cell interactions impair model inference (Supplemental Fig. S4D). For this, we repeated the previous simulations, but created flexible potentials ρij(rab) = Δρijexp(−ϕijrab) with
. Supplemental Figure S4A gives AUPRC versus n · S to recover the correct intracellular networks (the intracellular precision matrix Ω, left figure) and the intercellular interaction networks (the cell–cell interaction parameters Δρ, right figure). We find that SpaCeNet is capable of reconstructing intracellular networks across the full range of simulated
cells, n · S, with a median AUPRC larger than ∼0.85 throughout all settings. Edge recovery of cell–cell interactions was achieved with
a median AUPRC ranging from 0.28 for n = 103 and S = 1 (blue) to 0.92 for n = 103 and S = 100. It is worth noting that edge recovery for both the intra- and intercellular networks was slightly better if cells
are distributed across measurements, as seen by comparison of the AUPRC for n = 103 and S = 1 (blue), for n = 100 and S = 10 (orange), and for n = 10 and S = 100 (green), that all share the same total number of cells n · S = 103. This trend also persisted for n · S = 104. We also tested the same class of potentials with medium range 1/ϕij = 1/10 (Supplemental Fig. S4B) and short range 1/ϕij = 1/20 (Supplemental Fig. S4C). The results were similar to the first simulation study. The edge recovery in terms of AUPRC improved with an increasing
number of cells n · S, the more so when cells were distributed across multiple samples S. Finally, we studied how diverse cell–cell interactions impair model inference (Supplemental Fig. S4D). For this, we repeated the previous simulations, but created flexible potentials ρij(rab) = Δρijexp(−ϕijrab) with  and
and  between molecular variables i and j that differ with respect to interaction range and strength. For illustration purposes, these different potential ranges are
shown in Supplemental Figure S2 for ϕij = 5 (solid line), ϕij = 10 (dashed line), and ϕij = 20 (dotted line). In summary, we found that SpaCeNet achieves an edge-recovery performance that is almost as good as in
the more controlled setting of the previous simulation studies, in particular when the total number of cells n · S is increased. An exemplary SpaCeNet model obtained in this study together with its ground truth is shown in Supplemental Figure S3 for two different model regularization parameters β. Results considering AUROC for all four simulation studies are shown in Supplemental Table S1, supporting our previous findings.
between molecular variables i and j that differ with respect to interaction range and strength. For illustration purposes, these different potential ranges are
shown in Supplemental Figure S2 for ϕij = 5 (solid line), ϕij = 10 (dashed line), and ϕij = 20 (dotted line). In summary, we found that SpaCeNet achieves an edge-recovery performance that is almost as good as in
the more controlled setting of the previous simulation studies, in particular when the total number of cells n · S is increased. An exemplary SpaCeNet model obtained in this study together with its ground truth is shown in Supplemental Figure S3 for two different model regularization parameters β. Results considering AUROC for all four simulation studies are shown in Supplemental Table S1, supporting our previous findings.
To further illustrate the relevance of distance-dependent interactions, we compared SpaCeNet to two alternative approaches,
namely, an ordinary spatial correlation and its naive partial extension implemented as follows. For each individual cell i and gene j, we summed up the expression of the top K nearest neighbors, yielding an additional set of “regional expression variables.” Then, we correlated the cell's expression
of gene j with the regional expression of gene l for all j and l, yielding a matrix of correlation coefficients. The performance evaluation shown in Supplemental Figure S5 and Supplemental Table S2 contrasts the performance of this naive correlation-based approach for K = 1, 5, 10, 20, 50 nearest neighbors with SpaCeNet. We observe that, first, overall this approach cannot compete with SpaCeNet
and, second, that its performance depends on the number of considered nearest neighbors K, with long-range interactions typically better captured by large K (simulation A) and short-range interaction better captured for small K. In contrast, SpaCeNet dynamically adjusts for the interaction range and does not require any a priori specification of interacting
neighbors. As a further benchmark, we included an extension of the naive spatial correlation measure to a partial correlation
measure. Let  denote the regional expression variable which represents the expression of gene j of the top K neighbors. A remedy to estimate spatial associations between genes j and l has to take into account that both might also correlate to each other within individual cells. Therefore, we decided to calculate
partial correlations between variables j and
denote the regional expression variable which represents the expression of gene j of the top K neighbors. A remedy to estimate spatial associations between genes j and l has to take into account that both might also correlate to each other within individual cells. Therefore, we decided to calculate
partial correlations between variables j and  conditioning on
  and l. Performance analysis of this additional baseline strongly supports our finding that SpaCeNet, as a dynamic approach that
intrinsically infers complex distance dependencies, is much more suited to infer cell–cell interactions (Supplemental Fig. S6; Supplemental Table S3).
and l. Performance analysis of this additional baseline strongly supports our finding that SpaCeNet, as a dynamic approach that
intrinsically infers complex distance dependencies, is much more suited to infer cell–cell interactions (Supplemental Fig. S6; Supplemental Table S3).
SpaCeNet recovers intra- and intercellular interactions from in silico tissues generated via mechanistic modeling
Former simulations illustrate that SpaCeNet can reliably recover SCI relationships. Next, we aimed to verify SpaCeNet in more realistic settings. Tanevski et al. (2022) used a comprehensive in silico tissue model to mimic the interactions of different cell types through ligand binding and subsequent signaling events. They generated two in silico tissues with prespecified cell–cell interactions between four cell types, capturing interactions of 29 molecular species including 5 ligands, 5 receptors, and 19 intracellular signaling proteins, capturing n = 3953 cells each. The authors suggested MISTy to derive importance scores for each pair of markers to infer intracellular and intercellular molecular interactions. We followed their work and considered an intracellular interaction as correct if there is a direct interaction between the markers in the model's networks and an intercellular interaction as correct if one of the markers is responsible for a ligand production and the other one is activated by it (Tanevski et al. 2022). Respective results in terms of AUPRC are summarized in Table 1 for MISTy and SpaCeNet. To evaluate SpaCeNet's performance, we restricted ourselves to leading order potentials to ensure comparability. We observe that SpaCeNet consistently outperformed MISTy with respect to both the recovery of intra- and intercellular interactions. This is also supported by a respective analysis considering AUROC (Supplemental Table S4). One should note that MISTy does not disentangle direct from indirect relationships. As a consequence, most false-positive interactions derived by MISTy might be the result of indirect or higher-order interactions (Tanevski et al. 2022).
Performance in terms of AUPRC to recover intra- (top) and intercellular (bottom) interactions from in silico tissues generated via mechanistic modeling for MISTy and SpaCeNet
SpaCeNet resolves molecular mechanisms involved in cellular interactions in the mouse visual cortex
In the following, we present an example analysis using SpaCeNet for spatial transcriptomics data from the mouse visual cortex generated by STARmap (Wang et al. 2018). STARmap labels and amplifies cellular RNAs. These amplicons are then transferred to a hydrogel while lipids and proteins are removed. The hydrogel is optically transparent and can be sequentially imaged through multiple cycles with a low probability of errors and miscodings. The data consist of measurements for 28 RNAs in ∼30,000 cells together with their respective locations in a 0.1 × 1.4 × 1.7 mm3 tissue section.
We used SpaCeNet to estimate a global, intracellular network (the precision matrix Ω) and a network of spatial molecular interactions (the spatial-interaction parameters Δρ(·)), where we set L = 3 and split the data into four equally sized batches of which three served for model building and one for model validation
and hyper-parameter calibration (Supplemental Fig. S7). We tuned  on a 4 × 4 grid that was refined 6 times (Supplemental Fig. S8) and selected the best set of hyper-parameters based on the highest validation pseudo-log-likelihood. A final model was estimated
using the full data set.
on a 4 × 4 grid that was refined 6 times (Supplemental Fig. S8) and selected the best set of hyper-parameters based on the highest validation pseudo-log-likelihood. A final model was estimated
using the full data set.
For the intracellular precision matrix Ω we obtained a complete matrix with weights summarized in Supplemental File 1. For the spatial interactions Δρ(·), SpaCeNet selected a set of 134 out of 406 possible spatial associations (Supplemental Fig. S9; Supplemental File 1). We ranked edges according to 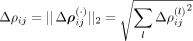 , for which the greatest edge weight was between myelin basic protein gene (Mbp) and FMS-related receptor tyrosine kinase 1 (Flt1) with ΔρMbp,Flt1 = 0.328 and the leading order contribution
 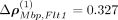 . Negative/positive values of
  correspond to positive/negative spatial associations in analogy to the definition of the precision matrix Ω.
First, we verified the absolute residuals between the observed data matrix X and its SpaCeNet reconstruction  using either (1) the intracellular edges only (
 ), or (2) the full model (see also Supplemental Section 2). The results corresponding to this analysis are shown in Figure 3A and B, respectively. We observed that the spatial associations improve model building substantially, as illustrated by the
band of large residuals in the upper left quadrant for both Flt1 and Mbp (Fig. 3A,D), that were reduced substantially via the spatial interactions (Fig. 3B,E). Figure 3C and F shows the corresponding contributions from the spatial interactions Δρ(·).
), or (2) the full model (see also Supplemental Section 2). The results corresponding to this analysis are shown in Figure 3A and B, respectively. We observed that the spatial associations improve model building substantially, as illustrated by the
band of large residuals in the upper left quadrant for both Flt1 and Mbp (Fig. 3A,D), that were reduced substantially via the spatial interactions (Fig. 3B,E). Figure 3C and F shows the corresponding contributions from the spatial interactions Δρ(·).
Spatial interactions improve on goodness of fit. The figures show absolute prediction residuals for spatially associated genes
Mbp (top row) and Flt1 (bottom row) in the mouse visual cortex data from Wang et al. (2018) with respect to their position in space. The left column (A,D) shows the absolute residuals between the ground truth data and the predictions based on the intracellular model parameters
only,  . The middle column (B,E) displays the residuals if both intra- and intercellular interactions are considered,
 . The right column (C,F) shows the contributions from spatial interactions only,
  .
.
The connection between Mbp and Flt1 was interesting for a number of reasons. Myelin basic protein is the second most abundant protein, after proteolipid protein, of the myelin membrane in the central nervous system (CNS), making up ∼30% of the total protein of myelin (Boggs 2006), and Mbp mutants lack compact myelin in the CNS (Readhead et al. 1990). Myelin surrounds nerve cell axons to insulate them and to increase the conduction of electric impulses (Bean 2007). Demyelinating diseases of the CNS, of which multiple sclerosis (MS) is the most common, are characterized by damaged myelin sheaths (Love 2006). Flt1 encodes a member of the vascular endothelial growth factor receptor (VEGFR) family. VEGFRs mediate diverse cellular communication signals controlling developmental processes, such as neurogenesis or gliogenesis (Wittko-Schneider et al. 2013). VEGFRs recognize vascular endothelial growth factors (VEGFs), whose expression has been shown to be upregulated in both acute and chronic MS plaques (Proescholdt et al. 2002). Our SpaCeNet model resolves that Flt1 levels are negatively associated with Mbp levels in neighboring cells. A possible interpretation is that cells expressing Flt1 accumulate in the spatial vicinity of cells which lack Mbp. This would be in line with the observation that VEGFA (which is recognized by FLT1) promotes the migration of oligodendrocyte precursor cells (OPCs) in a concentration-dependent manner (Hayakawa et al. 2011), as shown by anti-KDR (also known as FLK1) (not by anti-FLT1) receptor-blocking antibody. Moreover, it was shown in the medulla oblongata of the adult mouse that OPCs contribute to focal remyelination and that VEGF signaling might be required for their proliferation (Hiratsuka et al. 2019). It has been long known that oligodendrocytes are the myelinating cells of the CNS derived from OPCs (Pfeiffer et al. 1993); therefore, our finding could be a hint that FLT1 mediates signals necessary to guide myelinating cells such as OPCs and mature oligodendrocytes to axons that lack myelin. In a study by Vaquié et al. (2019), injured axons were shown to communicate with Schwann cells to trigger the formation of actin spheres. These spheres constrict the axons, leading to their fragmentation and faster removal of debris after injury. This process was shown to be controlled by FLT1 (also known as VEGFR1) activity, and can be acquired by oligodendrocytes through enforced expression of VEGFR1 (Vaquié et al. 2019).
It should be noted that SpaCeNet models are associative, not causal. Thus, we cannot elucidate whether decreased Mbp levels imply increased Flt1 in neighboring cells or if increased Flt1 levels imply decreased Mbp in neighboring cells. Moreover, because only a selected set of 28 genes was spatially assessed by STARmap in a thick tissue section, and because numerous signaling steps may be involved in establishing this relationship, the underlying mechanisms remain to be fully elucidated.
The spatial association Flt1–Mbp was followed in strength by Ctgf–Gja1, Ctgf–Pcp4, and Reln–Sst associations. Connective tissue growth factor (Ctgf), also known as cellular communication network factor 2 (Ccn2), belongs to the CCN family. CCN proteins are a family of extracellular matrix proteins involved in intercellular signaling
(Jun and Lau 2011). We obtained  , with leading order contribution
  . Ctgf has been reported to facilitate gap junction intercellular communication in chondrocytes through upregulation of gap junction
protein, alpha 1 (Gja1, also known as connexin 43) expression (Wu et al. 2021). Purkinje cell protein 4 (PCP4) regulates calmodulin activity and might contribute to neuronal differentiation through the
activation of calmodulin-dependent kinase signaling pathways (Mouton-Liger et al. 2011). The Ctgf–Pcp4 potential was estimated with ΔρCtgf,Pcp4 = 0.083 and ΔρCtgf,Pcp4 = 0.0831; we are not aware of a mechanism that might explain the spatial association observed between Ctgf and Pcp4. This association was followed by Reln (reelin)–Sst (somatostatin) with parameters ΔρReln,Sst = 0.083 and ΔρReln,Sst = 0.0780. The gene Reln encodes a secreted extracellular matrix protein that might play a role in cell–cell interactions critical for cell positioning.
Somatostatin affects the transmission rates of neurons in the CNS and cell proliferation. GABAeric cortical interneurons can
be delineated to 95% by the markers PV, SST (coexpressed with reelin), reelin (without SST), and VIP (Miyoshi et al. 2010). The medial ganglionic eminence gives rise to the population of interneurons that coexpress reelin and somatostatin, whereas
the caudal ganglionic eminence gives rise to interneurons that express somatostatin but lack reelin (Miyoshi et al. 2010). The observed spatial Reln–Sst association could be a hint that the distribution of these two populations is spatially well organized and not random.
. Ctgf has been reported to facilitate gap junction intercellular communication in chondrocytes through upregulation of gap junction
protein, alpha 1 (Gja1, also known as connexin 43) expression (Wu et al. 2021). Purkinje cell protein 4 (PCP4) regulates calmodulin activity and might contribute to neuronal differentiation through the
activation of calmodulin-dependent kinase signaling pathways (Mouton-Liger et al. 2011). The Ctgf–Pcp4 potential was estimated with ΔρCtgf,Pcp4 = 0.083 and ΔρCtgf,Pcp4 = 0.0831; we are not aware of a mechanism that might explain the spatial association observed between Ctgf and Pcp4. This association was followed by Reln (reelin)–Sst (somatostatin) with parameters ΔρReln,Sst = 0.083 and ΔρReln,Sst = 0.0780. The gene Reln encodes a secreted extracellular matrix protein that might play a role in cell–cell interactions critical for cell positioning.
Somatostatin affects the transmission rates of neurons in the CNS and cell proliferation. GABAeric cortical interneurons can
be delineated to 95% by the markers PV, SST (coexpressed with reelin), reelin (without SST), and VIP (Miyoshi et al. 2010). The medial ganglionic eminence gives rise to the population of interneurons that coexpress reelin and somatostatin, whereas
the caudal ganglionic eminence gives rise to interneurons that express somatostatin but lack reelin (Miyoshi et al. 2010). The observed spatial Reln–Sst association could be a hint that the distribution of these two populations is spatially well organized and not random.
SpaCeNet assumes multivariate normality. To further ensure that the derived results are robust and to explore the extent to which they are biased by data preprocessing, we repeated the former analysis, but used log-transformed data instead. Log-transformed data are believed to make data more normally distributed, but are also prone to inflating the variance for lowly expressed genes (Huber et al. 2002). Thus, it is not a priori clear whether SpaCeNet can better deal with data on a natural scale or on log scale. Respective top edges obtained by SpaCeNet are summarized in Supplemental Table S5, illustrating that the top hits are still recovered with confidence, although the ordering slightly changed; among the top genes, the pairs Mbp–Flt1, Ctgf–Gja1, and Ctgf–Pcp4 were confirmed. The pair Sst–Pvalb newly appeared among the top hits, which might be attributed to the spatial delineation of parvalbumin-positive (PVALB+) and somatostatin-positive (SST+) cells. As a final consistency check, we explored the potential role of redundant variables and how they potentially compromise model inference. For this purpose, we replaced Mbp in the data matrix by two noisy copies of itself and repeated our analysis with results shown in Supplemental Table S5. We observed that the edges to Mbp are still robustly established, but edge strength was lowered by a factor of approximately two. This is in line with recent findings in mixed graphical models (Kosch et al. 2023).
Comparative analysis of spatial associations using pairwise and partial spatial correlations
For comparison and illustration purposes, we performed the ordinary pairwise spatial correlation analysis outlined above on
the mouse visual cortex data, using the K = 5 nearest neighbors in line with Arnol et al. (2019). The largest absolute spatial correlation value between different genes was observed for the pair Mbp–Flt1 with  , which was also the top hit in the SpaCeNet analysis. However, we observed the opposite sign for the association; SpaCeNet
suggests a negative, whereas this analysis suggests a positive association. To further resolve this contradictory result,
we compared the estimated pairwise spatial correlation matrix with an ordinary correlation matrix derived across all single-cell
profiles (see Supplemental Figs. S10A, S11A), respectively. Comparison of both matrices reveals a strong coincidence with differences distributed as shown in Supplemental Figures S10 and S11.
, which was also the top hit in the SpaCeNet analysis. However, we observed the opposite sign for the association; SpaCeNet
suggests a negative, whereas this analysis suggests a positive association. To further resolve this contradictory result,
we compared the estimated pairwise spatial correlation matrix with an ordinary correlation matrix derived across all single-cell
profiles (see Supplemental Figs. S10A, S11A), respectively. Comparison of both matrices reveals a strong coincidence with differences distributed as shown in Supplemental Figures S10 and S11.
Given the high similarity between both, we hypothesized the presence of strong auto-correlations between neighboring cells, meaning that high spatial correlations are just the consequence of similar expression patterns in adjacent cells. For the pair Mbp–Flt1, the ordinary correlation analysis revealed a correlation coefficient of 0.87, supporting this hypothesis for this specific case.
To explore if such spatial auto-correlations deteriorate estimates of spatial associations, we applied additionally the outlined spatial partial correlation measure with K = 5 nearest neighbors. Table 2 compares the estimated spatial partial associations with the results of SpaCeNet for the outlined top pairs. Both approaches now suggest a negative association for all four pairs. Moreover, the relative association strength is very similar with Mbp–Flt1 being the strongest association, and Ctgf–Pcp4 and Reln–Sst having similar association strengths. The pair Ctgf–Gja1 shows a relatively weak association in contrast to the SpaCeNet analysis. One should note, however, that the previous analysis was based on the nearest neighbor estimate of gene expression, ignoring potential complex radial dependencies, and did not explore the full capacity of PGMs to disentangle direct from indirect relationships by considering all molecular variables simultaneously, which might explain the observed differences. Ranking from highest to lowest absolute spatial partial correlations also yielded the pair Mbp–Flt1 as the top hit, suggesting that disentangling the intra- from intercellular correlations might be one of the main ingredients necessary to identify the most interesting spatial associations.
Estimated spatial partial correlations versus the association strength determined by SpaCeNet for the four top-ranked associations discussed in the main text
SpaCeNet infers spatial gene–gene-association patterns in the Drosophila blastoderm from low-resolution spatial omics data
The previous analysis used data generated by STARmap (Wang et al. 2018), an in situ sequencing technology for dense measurements at single-cell resolution, which, however, is limited in throughput. In contrast, omics readouts together with spatial information (the transcriptome in a given spatially defined region of a specimen) have become more and more available. Here, we illustrate that SpaCeNet augments their analysis, even though the data do not resolve single cells.
The Berkeley Drosophila Transcription Network Project used a registration technique that uses image-based data from hundreds of Drosophila blastoderm embryos, each costained for a reference gene and one gene out of a preselected gene set, to generate a virtual Drosophila embryo (Fowlkes et al. 2008). We retrieved these virtual embryo data consisting of 84 genes whose expression levels were measured at 3039 embryonic locations. We then used SpaCeNet to estimate the intracellular network (the precision matrix Ω) and the network of spatial molecular interactions (Δρ(·)) for L = 3. We performed a hyper-parameter grid search, where we trained the model on 70% of the data and validated it on the remaining 30% (Supplemental Figs. S12, S13). The best set of hyper-parameters was selected based on the highest validation pseudo-log-likelihood and was used to fit a final model on the full data (Supplemental File 2). The intracellular network Ω is a full matrix and so there is a rich dependency structure among variables not related to their spatial context. The spatial-interaction network, Δρ(·), in contrast, is sparse with 238 out of 3570 possible interactions (Supplemental Fig. S14). Note that the spatial molecular interactions improved the goodness-of-fit on validation data and thus also the generalizability of the model, which highlights the need to include spatial interactions.
Figure 4A–F contrasts the expression of the gene pairs sna–twi, ems–noc, and Dfd–lok, respectively. The analysis showed the highest spatial association in the SpaCeNet analysis with Δρtwi,sna = 0.0368, Δρems,noc = 0.0306, and ΔρDfd,lok = 0.0211. We observed twi and sna to be active in the same spatial regions, which is consistent with both the positive spatial association suggested by SpaCeNet
in leading order (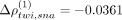 ) and with the joint activation of twi and sna in the differentiation of the Drosophila mesoderm in localized (ventral) regions of early embryos (Ip et al. 1992). In contrast, the genes ems and noc for which SpaCeNet estimated a negative spatial association at leading order (Δρems,noc = 0.0301) are active in adjacent but different areas of the Drosophila embryo. A similar observation can be made for the genes Dfd and lok, for which SpaCeNet also estimated a negative leading order association (
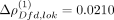 ). To further explore the robustness of former results with respect to preprocessing biases, we reperformed our analysis but
additionally applied a log-transformation (Supplemental Table S6). Again, these analyses support the robustness of SpaCeNet as almost all leading edges coincide between both approaches.
). To further explore the robustness of former results with respect to preprocessing biases, we reperformed our analysis but
additionally applied a log-transformation (Supplemental Table S6). Again, these analyses support the robustness of SpaCeNet as almost all leading edges coincide between both approaches.
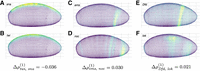
Visualization of genes with strong spatial associations in the Drosophila blastoderm as identified by SpaCeNet. Figures show gene expression levels of the top ranked gene pairs as identified by SpaCeNet with sna and twi in A and B, ems and noc in C and D, and Dfd and lok in E and F, respectively. The genes sna and twi (A,B) are expressed in the same areas in concordance with Δρtwi, sna = −0.036 as inferred by SpaCeNet. Genes ems and noc (C,D) are expressed in adjacent but different areas, which is consistent with the inferred SpaCeNet association Δρems,noc = 0.030. This also holds true for the gene pair Dfd and lok (E,F), which are also expressed in adjacent but different areas, consistent with ΔρDfd,lok = 0.021. For all illustrations, the three-dimensional spatial coordinates were projected into a two-dimensional plane using a principal component analysis.
SpaCeNet as an inferential tool to predict spatial gene expression in the Drosophila blastoderm
SpaCeNet infers a joint density function describing spatially distributed, potentially high-dimensional molecular features. Thus, it can be also used as an inferential tool, predicting the gene expression of a cell given its cellular context. For illustration purposes, consider the gene Kr that encodes the Krüppel protein, a transcriptional repressor expressed in the center of the embryo during the cellular blastoderm stage (Licht et al. 1990). First, we predicted Kr expression in a leave-one-position-out approach that provides levels of Kr based on a cell's environment. The ground truth is shown in Supplemental Figure S15A and the corresponding predictions in Supplemental Figure S15B. We found that an accordingly trained SpaCeNet model can predict each cell's individual expression, given its location in space (mean squared error [MSE] = 4.36 × 10⁻³). However, slight deviations were observed in the highlighted region (red arrow). Next, we tested whether this discrepancy could be resolved by specifying a priori the expression levels of the remaining genes at the position of interest (Supplemental Fig. S15C). This reduced the MSE to 2.88 × 10⁻³, and the highlighted region better agrees with the ground truth, as can be seen by comparing Supplemental Figure S15A–C.
SpaCeNet analysis of high-throughput spatial transcriptomics data
Finally, we illustrate that SpaCeNet can deal with high-throughput data, capturing hundreds or even thousands of variables and measurements for tens of thousands of cells. In Chen et al. (2022), the mouse organogenesis spatiotemporal transcriptomic atlas (MOSTA) was generated, which provides gene expression maps with single-cell resolution of mouse organogenesis. We downloaded preprocessed data of the coronal hemibrain section, capturing, in total, measurements of 56,731 individual cells together with their spatial location. We further filtered the gene space to genes which are at least expressed in 30% (Mosta A) and 10% of cells (Mosta B), yielding 315 and 1741 genes, respectively. We then applied SpaCeNet to each of these data sets (using L = 1 for computational efficiency), and performed a grid search for model selection (Supplemental Fig. S16). The best model was selected based on the lowest Akaike information criterion (AIC). The total computation time for the final model was ∼30 and 150 minutes, respectively, computed on a single A100 GPU, highlighting that SpaCeNet is computationally highly efficient. The top spatial associations are summarized in Supplemental Table S7, illustrating a high coincidence between the top associated genes of settings A and B. Further, the activated gene regions of the top associated genes for Mobp–Mbp are shown in Supplemental Figure S17 and for Mt2–Mt1 in Supplemental Figure S18.
We want to highlight that model findings might be affected by low sequencing depths, challenging SpaCeNet's model assumptions. However, despite this limitation, the findings are worth discussing, as they do not only demonstrate the power of SpaCeNet in finding valid CI relations between genes expressed in different cells, but they also highlight general limitations of (spatial) transcriptomics in reconstructing biology. A comprehensive discussion can be found in Supplemental Section 3.
Discussion
SpaCeNet is a network inference method that determines intracellular correlation networks and cell–cell associations from spatial molecular data. SpaCeNet is based on probabilistic graphical modeling and extends the concept of CI by spatial information through estimating SCI. These intracellular and intercellular SCI relationships encode information about how molecular variables affect each other across space. We verified SpaCeNet in comprehensive simulation studies and demonstrated the information that SpaCeNet can extract from spatial transcriptomics data in three example data sets: an expression map of the mouse visual cortex, a virtual RNA map of the Drosophila blastoderm, and an analysis of high-throughput ST data of mouse organogenesis. The analysis of the mouse visual cortex allowed us to generate hypotheses about the spatial organization of cell populations, such as Flt1-mediated signals which could be involved in the recruitment of myelinating cells toward axons which lack myelin basic protein (Mbp). The analysis of the Drosophila blastoderm showed that SpaCeNet can also yield insights if data do not have a cellular resolution. In the latter case, SpaCeNet resolved spatial association patterns between molecular variables, as observed between the gene pairs twi–sna and ems–noc. Our analysis of the mouse organogenesis data finally showed SpaCeNet's capability to investigate large-scale problems involving 1000s of genes in 10,000s of cells.
Modern spatial transcriptomics techniques are capable of measuring RNA transcript levels with single-cell resolution in a three-dimensional space. Many molecular processes that take place within and between cells, such as translation to protein, possible posttranslational modifications, and subsequent signaling cascades comprising the secretion of molecules and their recognition by other cells, are not directly measured by these technologies. Although laboratory methods under development, such as single-cell proteomics and metabolomics (Duncan et al. 2019; Marx 2019) or single-cell epigenetic or chromatin confirmation measurements, may one day bridge this gap, at present one can only infer such associations with appropriate analytical methods. SpaCeNet is an important first step in inferring complex, multiomic, intracellular, and intercellular association networks that take advantage of high-dimensional omics data and spatial information. The present implementation of SpaCeNet uses single-cell spatial transcriptomics data and so can only infer associations between RNA expression levels within and, more importantly, between different cells—without knowledge about any potentially complex intermediate processes. SpaCeNet is based on a robust GGM framework, which can scale to the increasingly large and complex spatial multiomics data sets that new laboratory technologies provide. Importantly, hidden variables can prohibit the inference of direct relationships. If they remain hidden, we are not able to infer their role in mediating dependencies, potentially leading to erroneous direct associations. However, with new technologies capturing more and more molecular variables, methods such as SpaCeNet might be key to identify the direct statistical dependencies in favor of those mediated by other variables. In this context, it is also worth mentioning that SpaCeNet's current implementation is limited to modeling continuous variables. Although many omics measurements such as gene expression levels can be reasonably modeled as continuous, this is not the case for all genomic readouts, and variables such as mutation status and chromatin accessibility might be better described as categorical variables. SpaCeNet could be easily adapted to include those using mixed graphical modeling suggested by Lee and Hastie (2015). As is generally the case for correlation-based methods, SpaCeNet does not identify causal interactions, although lower bounds on causal effects can be derived from observational data (Maathuis et al. 2009), and techniques such as directed acyclic graphs and respective equivalence classes may be adapted to SCI relationships, which we intend to explore in the future.
Nevertheless, SpaCeNet represents an important step forward in the analysis of spatial expression data, allowing us to move from a simple atlas of expression values and cell types to models that capture complex patterns of interactions that allow tissues to function and guide cellular growth, development, and disease processes. As new experimental techniques deliver larger and more complex multiomics data combined with higher resolution information on the location of individual cells, techniques like SpaCeNet will become increasingly important for integrating spatial and biological contexts.
Methods
Data structure
SpaCeNet is designed to model continuous, potentially high-dimensional molecular variables (e.g., gene expression levels)
which are measured together with spatial information. Formally, denote the molecular variables as Xi with i = 1, …, p and let  be a data matrix with n measurements (molecular profiles) in its rows. Then each of these measurements
  is annotated with a position ra of cell a in space. Throughout this section, we identify the
  as molecular profiles of individual cells and ra with the respective point-position in space.
Concept
SpaCeNet considers the observed spatially distributed molecular profiles of single cells within a statistical model which
decomposes the observed gene expression into two components (see Fig. 1). The first contribution accounts for the statistical diversity of isolated cells, meaning that we assume that the molecular
profiles of individual cells follow a p-dimensional multivariate normal distribution,  with mean profiles μ and covariance Σ (see Fig. 1A). Note that this is a reasonable assumption if data are approximately normal or if they are transformed accordingly (e.g.,
via nonparanormal transformations) (Liu et al. 2009; Zhang et al. 2018). The second contribution accounts for the fact that cells are not isolated but observed in a complex environment where cells
can interact with each other (see Fig. 1B,C). This effect is encoded as shifts of the distribution's mean profiles μ and the amount by which the individual profiles are shifted depends on the molecular phenotypes of the surrounding cells
and their distances, as schematically illustrated for two interacting cells in Figure 1B and for multiple cells in Figure 1C. The functional dependence of these shifts on the neighbor's gene expression and distance is not a priori clear. Key to
SpaCeNet is a parameterization which accounts for diverse distance dependencies and which can be straightforwardly interpreted
in terms of CI relationships, as outlined in the following.
with mean profiles μ and covariance Σ (see Fig. 1A). Note that this is a reasonable assumption if data are approximately normal or if they are transformed accordingly (e.g.,
via nonparanormal transformations) (Liu et al. 2009; Zhang et al. 2018). The second contribution accounts for the fact that cells are not isolated but observed in a complex environment where cells
can interact with each other (see Fig. 1B,C). This effect is encoded as shifts of the distribution's mean profiles μ and the amount by which the individual profiles are shifted depends on the molecular phenotypes of the surrounding cells
and their distances, as schematically illustrated for two interacting cells in Figure 1B and for multiple cells in Figure 1C. The functional dependence of these shifts on the neighbor's gene expression and distance is not a priori clear. Key to
SpaCeNet is a parameterization which accounts for diverse distance dependencies and which can be straightforwardly interpreted
in terms of CI relationships, as outlined in the following.
Spatial conditional independence
Estimates of CI relationships are key to the inference of molecular networks, as they allow the disentanglement of direct and indirect statistical relationships and as such reduce the number of false-positive associations (Altenbuchinger et al. 2020). If the spatial context is ignored, CI between variables Xi and Xj given all remaining variables can be expressed as Xi ⊥ Xj|{rest}, where “rest” is the set of all variables in X except Xi and Xj. We extend this language to intracellular and intercellular SCI relationships:
-
Intracellular SCI relations between variables
 and
and  measured within one cell a are expressed as
  with the term “rest” referring to all other variables of cell a and to all variables of all other cells.
-
Intercellular SCI relations between variables
 and
and  measured in different cells a and b, conditioned on all remaining variables, are denoted as
  with a ≠ b, where “rest” refers to all variables of cell a except
  , all variables of cell b except
  , and all variables of all remaining cells.
Thus, as CI is designed to distinguish direct from indirect relationships between molecular variables, SCI relationships are designed to do so for the intra and intercellular relationships between molecular variables.
Full probability density
GGMs are PGMs that assume multivariate normally distributed data. The model parameters of GGMs are collected in the precision
matrix Ω = (ωij), which directly parameterizes CI relationships; ωij = 0 if and only if there is CI between variables i and j given all other variables. In the following, we will develop a joint probability density which directly encodes SCI relationships.
Specifically, we assume that data follow an np-dimensional multivariate normal distribution with precision matrix Λ, where the entries in Λ capture both intracellular and intercellular SCI relations. The full probability density of SpaCeNet is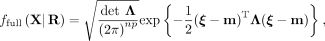 (1)
where we stack the individual cells' profiles
(1)
where we stack the individual cells' profiles  , vertically in
  and use a global, location-agnostic mean vector μ for all
  such that
 . All pairwise cell–cell distances are collected in a matrix
  , where rab = rba denotes the Euclidean distance between cells a and b. The space-agnostic CI relations for gene expression levels of a single cell a can be recovered from Equation 1 by marginalizing over all variables of all other cells b ≠ a. Next, we decompose the precision matrix Λ ∈ ℝnp×np into
  (2)
with a matrix for intracellular (within-cell) associations
(2)
with a matrix for intracellular (within-cell) associations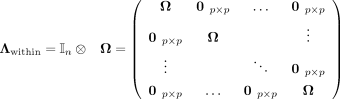 (3)
and a matrix for intercellular (between-cell) associations
(3)
and a matrix for intercellular (between-cell) associations 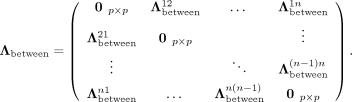 (4)
(4)
Due to the parametrization of Λwithin in Equation 3, the same precision matrix Ω = (ωij) ∈ ℝp×p parametrizes the within-cell associations for all cells, where ωij = 0 corresponds to intracellular SCI between Xi and Xj. The conventional (space-agnostic) GGM is recovered for 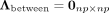 .
.
We further assume that the intercellular association of gene i in any cell a with gene j in any other cell b is described by some function of the cells' Euclidean distance rab. We denote this radial cell–cell interaction potential by ρij(rab) and write  , which we require to be symmetric with respect to both i ↔ j and a ↔ b. The (np × np)-dimensional precision matrix Λ is required to be positive definite for ffull to be a valid probability density.
Cell–cell interaction potentials
From the definition of the probability density function, Equation 1, we see that (5)
where the set “rest” refers to all variables of cell a except
(5)
where the set “rest” refers to all variables of cell a except  , all variables of cell b except
  , and all variables of all other cells. Thus, all intercellular SCI relations are encoded in the set of p(p + 1)/2 independent functions ρij(r) = ρji(r). To ensure that cells that are infinitely separated do not interact, we require ρij(r) = 0 for r → ∞. To approximate the potential ρij(r), we use a power-series in
  ,
,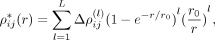 (6)
where l is the order in the series expansion and
(6)
where l is the order in the series expansion and 
 the corresponding coefficient matrix. The latter matrices are required to be symmetric,
  . This leads to an approximation for the intercellular precision matrix Λbetween given by
 (7)
with
(7)
with  (8)
The coefficients
(8)
The coefficients  are model parameters which are estimated using a regularized pseudo-log-likelihood, as outlined below. The expansion (6)
naturally fulfills
are model parameters which are estimated using a regularized pseudo-log-likelihood, as outlined below. The expansion (6)
naturally fulfills  and
and  with constants
  . Note, an expansion in
  has the advantage that terms do not diverge for r → 0, which is in contrast to an expansion in 1/r. Thus, the factor
  smooths the divergence and the amount of smoothing is determined by the additional parameter r0.
Pseudo-log-likelihood
The precision matrix Λ is of size np × np, which makes a naive maximum-likelihood-based estimate (using, e.g, a gradient descent) intractable for reasonably large
p and n. We address this issue by using a pseudo-log-likelihood approach (Besag 1975; Lee and Hastie 2015), which is a computationally efficient and consistent estimator formed by products of all the conditional distributions.
Let  denote all gene expression levels in all cells except cell a, and
  denote all gene expression levels in cell a except gene j. We consider the conditional density
  (9)
obtained from the full density given in Equation 1. This yields the pseudo-log-likelihood
(9)
obtained from the full density given in Equation 1. This yields the pseudo-log-likelihood (10)
(10)
Regularization
Parameter regularization has been repeatedly shown to improve the inference of GGMs using approaches such as node-wise LASSO
regression (Meinshausen and Bühlmann 2006), the graphical LASSO (Friedman et al. 2008), or covariance shrinkage (Schäfer and Strimmer 2005). This holds particularly true when the number of variables exceeds or is of the same order of magnitude as the number of
measurements (Altenbuchinger et al. 2020). For S independent measurements (spatial transcriptomics slides), the full, regularized pseudo-log-likelihood-based optimization
problem of SpaCeNet is given by (11)
(11)
Equation 11 penalizes the off-diagonal elements of the intracellular precision matrix Ω via L1 regularization (Tibshirani 1996). The intercellular interactions are regularized via group-LASSO terms (Yuan and Lin 2006), where the group contains the coefficients of the spatial interactions at different orders l = 1, …, L of the series expansion. This regularization has the advantage that sparseness is induced simultaneously across all orders in the expansion, so we induce sparseness in the potentials ρij and not just in the different orders of its expansion. The hyper-parameters α and β calibrate the regularization strength of the intracellular and intercellular associations, respectively. In our analysis, we standardized the expression data before model learning to ensure comparable penalization of the variables.
Implementation
Equation 11 is a convex optimization problem with LASSO and group-LASSO regularization terms, which can be efficiently solved via proximal gradient descent (Parikh and Boyd 2014). SpaCeNet uses a proximal gradient descent with Nesterov acceleration (Nesterov 1983; Sutskever et al. 2013). The optimization terminates when the loss in Equation 11 improves less than a user-specified threshold. The computational requirements for training a SpaCeNet depend on the number of considered cells and genes. For example, training SpaCeNet on an Nvidia A100 GPU takes ∼1 min for the Drosophila data (3039 cells and 84 genes), <2 minutes on the STARmap data (33,598 cells and 28 genes), ∼30 minutes on the Mosta data with more than 30% nonzero entries (56,731 cells and 315 genes) and ∼150 minutes on the Mosta data with more than 10% nonzero entries (56,731 cells and 1741 genes).
Hyper-parameter calibration
SpaCeNet is a statistical model derived by a regularized maximum-likelihood maximization. Consequently, generalization performance can be assessed by evaluating the model log-likelihood on unseen data. For the presented analyses, our strategy was to either use separate batches of ST slides for model evaluation (see Supplemental Section 1, “Simulation studies”) or to cut ST slides into training and validation compartments. Moreover, we implemented the AIC, which serves as an alternative for model selection. The chosen analysis strategies are provided in the main text. Respective hyper-parameter surfaces are given in Supplemental Figures S8, S13, and S16. Further details on hyper-parameter calibration in the context of the Simulation studies can be found in Supplemental Section 1.
Data sets
All ST data used in this article are publicly available. The STARmap measurements of the mouse visual cortex were generated by Wang et al. (2018) and downloaded from GitHub (https://github.com/drieslab/spatial-datasets/tree/master/data/2018_starmap_3D_cortex). The Drosophila virtual embryo data (Fowlkes et al. 2008) were obtained from GitHub (https://github.com/rajewsky-lab/novosparc/tree/master/novosparc/datasets/bdtnp). The mouse organogenesis spatiotemporal transcriptomic atlas (MOSTA) data (Chen et al. 2022) were obtained from https://ftp.cngb.org/pub/SciRAID/stomics/STDS0000058/Cell_bin_matrix/Mouse_brain_Adult_GEM_CellBin.tsv.gz.
Software availability
Our implementation of SpaCeNet is publicly available at GitHub (https://github.com/sschrod/SpaCeNet) and as Supplemental Code.
Competing interest statement
The authors declare no competing interests.
Acknowledgments
The work of H.U.Z. and M.A. was supported by the German Federal Ministry of Education and Research (BMBF) within the framework of the e:Med research and funding concept (grants nos. 01ZX1912A and 01ZX1912C). S.S., N.L., D.V., and M.A. were funded by the Deutsche Forschungsgemeinschaft (DFG, German Research Foundation) (AL 2355/1-1 “Digital Tissue Deconvolution—Aus Einzelzelldaten lernen”). K.H.S. was supported by the US National Institutes of Health, including the National Cancer Institute (R35CA220523) and the National Heart, Lung, and Blood Institute (T32HL007427). J.Q. and M.B.G. were supported by grants from the National Cancer Institute (U24CA231846 and R35CA220523), J.Q. was additionally supported by the National Human Genome Research Institute (R01HG011393) of the US National Institutes of Health. Finally, P.J.O. was supported by the Wilhelm Sander-Stiftung (grant no. 2018.037.1).
Author contributions: M.A. and R.L. conceptualized the study and together with S.Sc., N.L., T.W., S.So., and A.S. developed the SpaCeNet model; S.Sc. and N.L. implemented, verified, and applied the SpaCeNet model; D.V. improved the implementation and applied SpaCeNet to real-world data; S.Sc., N.L., and M.A. wrote the main manuscript; K.H.S., M.B.G., J.Q., H.U.Z., T.B., and P.J.O. suggested improvements and contributed to writing the manuscript.
Footnotes
-
↵9 The authors wish it to be known that, in their opinion, the first two authors should be regarded as Joint First Authors.
-
[Supplemental material is available for this article.]
-
Article published online before print. Article, supplemental material, and publication date are at https://www.genome.org/cgi/doi/10.1101/gr.279125.124.
- Received February 15, 2024.
- Accepted August 27, 2024.
This article is distributed exclusively by Cold Spring Harbor Laboratory Press for the first six months after the full-issue publication date (see http://genome.cshlp.org/site/misc/terms.xhtml). After six months, it is available under a Creative Commons License (Attribution-NonCommercial 4.0 International), as described at http://creativecommons.org/licenses/by-nc/4.0/.


