
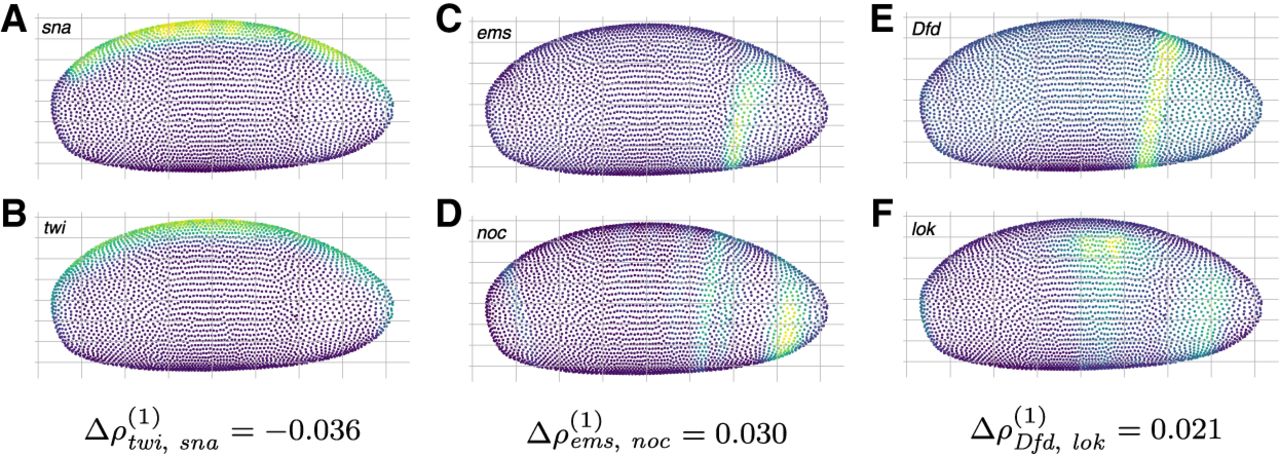
Visualization of genes with strong spatial associations in the Drosophila blastoderm as identified by SpaCeNet. Figures show gene expression levels of the top ranked gene pairs as identified by SpaCeNet with sna and twi in A and B, ems and noc in C and D, and Dfd and lok in E and F, respectively. The genes sna and twi (A,B) are expressed in the same areas in concordance with Δρtwi, sna = −0.036 as inferred by SpaCeNet. Genes ems and noc (C,D) are expressed in adjacent but different areas, which is consistent with the inferred SpaCeNet association Δρems,noc = 0.030. This also holds true for the gene pair Dfd and lok (E,F), which are also expressed in adjacent but different areas, consistent with ΔρDfd,lok = 0.021. For all illustrations, the three-dimensional spatial coordinates were projected into a two-dimensional plane using a principal component analysis.


