
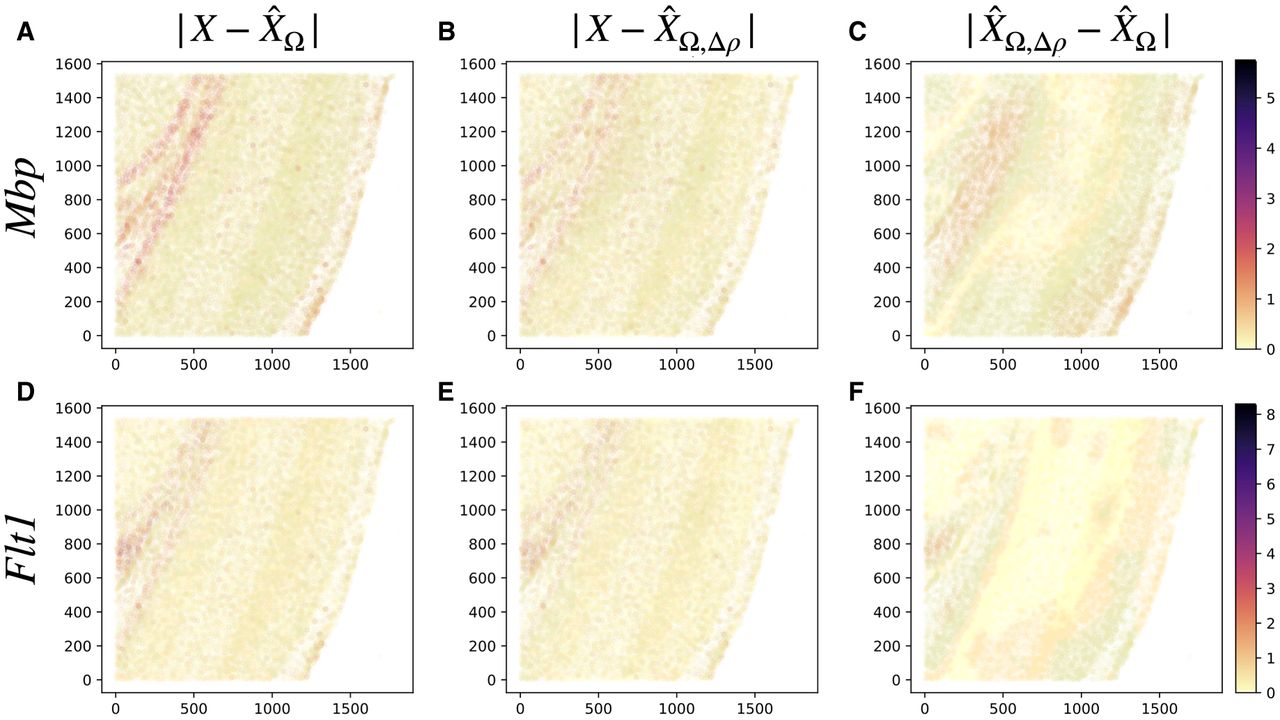
Figure 3.
Spatial interactions improve on goodness of fit. The figures show absolute prediction residuals for spatially associated genes
Mbp (top row) and Flt1 (bottom row) in the mouse visual cortex data from Wang et al. (2018) with respect to their position in space. The left column (A,D) shows the absolute residuals between the ground truth data and the predictions based on the intracellular model parameters
only,  . The middle column (B,E) displays the residuals if both intra- and intercellular interactions are considered,
 . The right column (C,F) shows the contributions from spatial interactions only,
  .
.


