
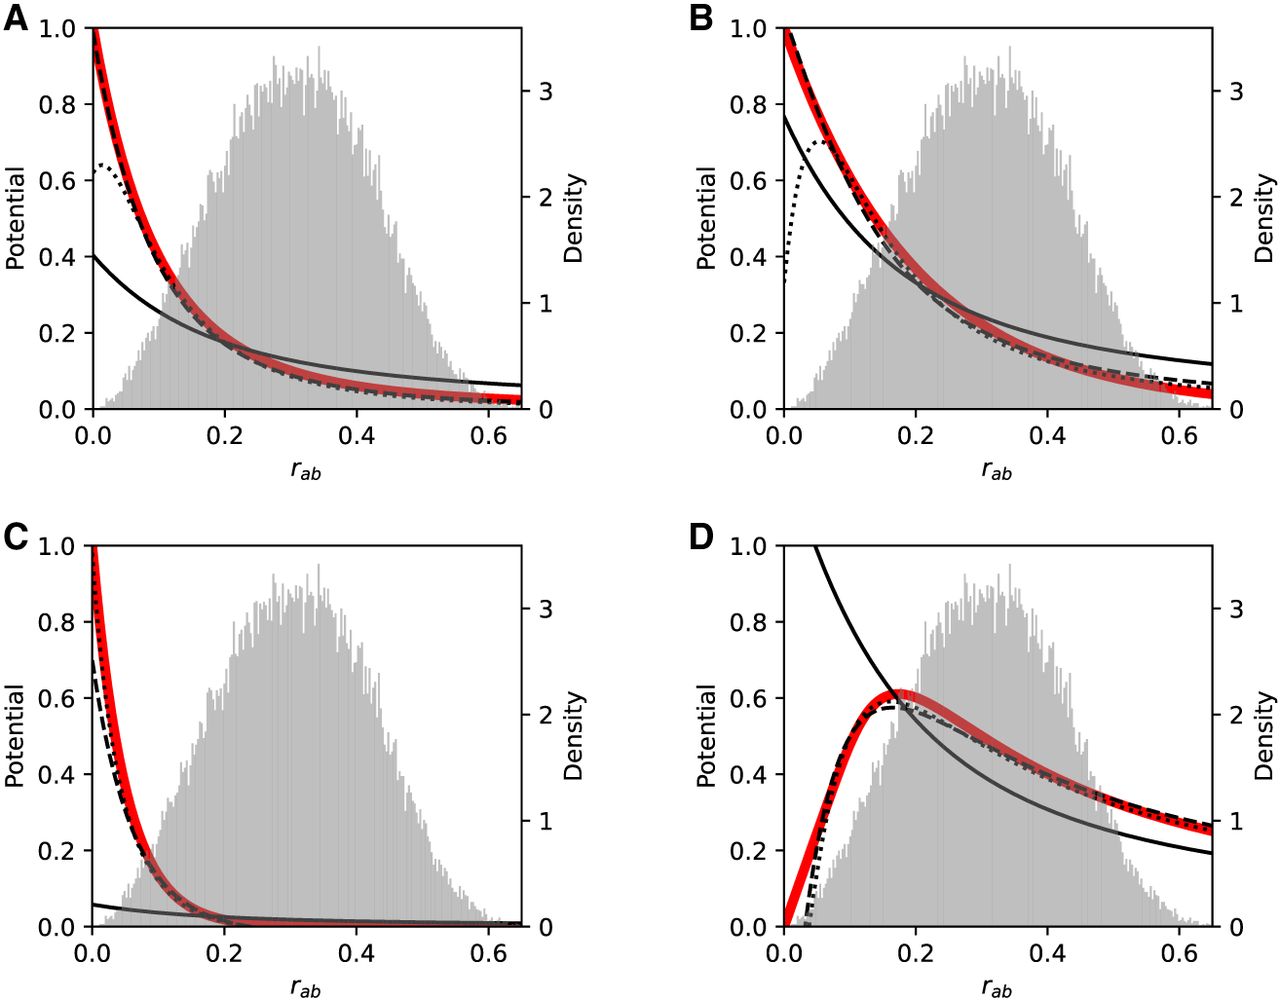
SpaCeNet can reconstruct diverse cellular interaction patterns. (A–D) Different potentials are used to simulate data in red in dependence on the distance between cells rab. Potentials inferred by SpaCeNet are shown for three different expansion orders: L = 1 (black solid lines), L = 3 (black dashed lines), and L = 10 (black dotted lines), illustrating that with higher order, increasingly complex cellular interactions can be reconstructed.
The corresponding ground-truth potentials (red lines) are (A) a standard decreasing potential corresponding to the second-order term in the series expansion, ρ(rab) = (1 − exp(−rab/r0))2(r0/rab)2 with r0 = 1/10, (B) a long-range exponential potential  , (C) a short-range exponential potential
  , and (D) a potential
  which increases for small rab and then decreases again. The corresponding densities of the pairwise distances rab are shown as histograms in the background of the figures with the respective y-axis depicted at the figures' right axis. For more details about data simulation see Supplemental Section 1.


