
A fast and adaptive detection framework for genome-wide chromatin loop mapping from Hi-C data
- Siyuan Chen1,2,3,8,
- Jiuming Wang4,8,
- Inkyung Jung5,
- Zhaowen Qiu6,
- Xin Gao1,2,3 and
- Yu Li4,7
- 1Computer Science Program, Computer, Electrical and Mathematical Sciences and Engineering (CEMSE) Division, King Abdullah University of Science and Technology (KAUST), Thuwal 23955-6900, Kingdom of Saudi Arabia;
- 2Center of Excellence on Smart Health, King Abdullah University of Science and Technology (KAUST), Thuwal 23955-6900, Kingdom of Saudi Arabia;
- 3Center of Excellence for Generative AI, King Abdullah University of Science and Technology (KAUST), Thuwal 23955-6900, Kingdom of Saudi Arabia;
- 4Department of Computer Science and Engineering, The Chinese University of Hong Kong (CUHK), Hong Kong SAR 999077, China;
- 5Department of Biological Sciences, Korea Advanced Institute of Science and Technology (KAIST), Daejeon 34141, Republic of Korea;
- 6Institute of Information and Computer Engineering, NorthEast Forestry University, Harbin 150040, China;
- 7The CUHK Shenzhen Research Institute, Hi-Tech Park, Nanshan, Shenzhen 518057, China
-
↵8 These authors contributed equally to this work.
Abstract
Chromatin loop identification plays an important role in molecular biology and 3D genomics research, as it constitutes a fundamental process in transcription and gene regulation. Such precise chromatin structures can be identified across genome-wide interaction matrices via Hi-C data analysis, which is essential for unraveling the intricacies of transcriptional regulation. Given the increasing number of genome-wide contact maps, derived from both in situ Hi-C and single-cell Hi-C experiments, there is a pressing need for efficient and resilient algorithms capable of processing data from diverse experiments rapidly and adaptively. Here, we propose YOLOOP, a novel detection-based framework that is different from the conventional paradigm. YOLOOP stands out for its speed, surpassing the performance of previous state-of-the-art (SOTA) chromatin loop detection methods. It achieves a 30-fold acceleration compared with classification-based methods, up to 20-fold acceleration compared with the SOTA kernel-based framework, and a fivefold acceleration compared with statistical algorithms. Furthermore, the proposed framework is capable of generalizing across various cell types, multiresolution Hi-C maps, and diverse experimental protocols. Compared with the existing paradigms, YOLOOP shows up to a 10% increase in recall and a 15% increase in F1-score, particularly noteworthy in the GM12878 cell line. YOLOOP also offers fast adaptability with straightforward fine-tuning, making it readily applicable to extremely sparse single-cell Hi-C contact maps. It maintains its exceptional speed, completing genome-wide detection at a 10 kb resolution for a single-cell contact map within 1 min and for a 900-cell-superimposed contact map within 3 min, enabling fast analysis of large-scale single-cell data.
The chromatin loop serves as a crucial structural variant that bridges promoters with regulatory regions, playing a pivotal role in DNA replication and gene transcription. It is closely related to DNA replication and gene transcription. Moreover, it serves as a vital regulator, enabling the binding of transcription factors (TFs) to their target sites with high precision and efficacy. Furthermore, chromosome structural variations can induce chromatin loop reorganization through enhancer hijacking events, leading to severe cancer and primary tumor development (Spielmann et al. 2018; Wang et al. 2021; Xu et al. 2022). Therefore, an accurate algorithm for calling chromatin loops through three-dimensional (3D) genomics can help pinpoint genetic alterations involved in disease development and progression. Various experimental methodologies have been developed to locate the precise gene loci involved in loop structures. Derived from chromosome conformation capture (3C) (Fullwood et al. 2009) technology, Hi-C (Lieberman-Aiden et al. 2009) utilizes high-throughput sequencing technology to study the relationship between the entire chromatin DNA in the whole genome, and obtains high-resolution information about the 3D chromatin structure. Apart from 3C-based technologies, numerous experiment techniques have also emerged for comprehensive genome-wide 3D structural mapping. One notable example is chromatin interaction analysis by paired-end tag sequencing (ChIA-PET) (Fullwood et al. 2009), which leverages chromatin immunoprecipitation (ChIP)–based enrichment to capture diverse facets of chromatin organization. Subsequently, in situ Hi-C (Rao et al. 2015) emerged, offering increased resolution to 1 kb and more efficient splicing of chromatinized DNA. Similar to ChIA-PET, proximity ligation-assisted ChIP-seq (PLAC-seq) (Fang et al. 2016) reduces the number of input materials and improves the sensitivity and robustness by conducting proximity ligation prior to chromatin shearing and immunoprecipitation. Another notable approach is HiChIP (Mumbach et al. 2016), which empowers the genome-wide mapping of protein-directed topological features. HiChIP significantly lowers the input requirements and enhances the yield of chromatin-interacting reads by more than 10-fold compared with ChIA-PET (Han et al. 2018). Another commonly used method for investigating nuclear structure is the split-pool recognition of interactions by tag extension (SPRITE) technique (Quinodoz et al. 2022). The above-mentioned protocols empower researchers to capture a wide spectrum of chromatin interaction patterns within contact maps. Recently, this innovative approach has gained widespread adoption and application in various scenarios. For example, single-cell Hi-C (scHi-C) technology is further developed, which can capture 3D organizations in individual cells in a similar fashion. With the recent advances in scHi-C technologies, researchers are able to observe and study chromatin interactions at single-cell resolution. Interaction maps can be acquired from only a few given cell types (Nagano et al. 2017; Ramani et al. 2017; Li et al. 2019; Kim et al. 2020) to thousands of cells (Lee et al. 2019; Liu et al. 2021; Tan et al. 2021) from multiple complex tissues, leading to an exponential increase in analysis time. Therefore, detecting genome-wide chromatin patterns robustly from diverse data at a faster speed poses an emerging and challenging computational problem.
The first category of chromatin interaction detection algorithms falls under the statistical approach. Examples of such methods include Cloops (Cao et al. 2020), HiCCUPS (Rao et al. 2015), HiCExplorer (Ramírez et al. 2018), and FitHiC2 (Kaul et al. 2020). Statistical methods aim to identify chromatin loops by locating the statistically enriched interactions against the global or local backgrounds. The statistical methods are widely acknowledged in Hi-C analysis owing to their demonstrated efficacy across different Hi-C matrices (Cao et al. 2020; Matthey-Doret et al. 2020). However, statistical methods with fixed parameters lack the adaptability to refine their algorithms in response to newly released data, thereby constraining their potential for future improvements and adaptability. Later, various computational frameworks for chromatin interaction pattern detection (Ay et al. 2014; Rao et al. 2017; Ramírez et al. 2018; Cao et al. 2020; Kaul et al. 2020; Matthey-Doret et al. 2020; Salameh et al. 2020; Wang et al. 2022; Zhang and Blanchette 2022; Zhang et al. 2022) were proposed to address this problem, which can be categorized into two major classes. One major framework is using the binary classifier (Fig. 1A, top), including Peakachu (Salameh et al. 2020), RefHiC (Zhang and Blanchette 2022), and EagleC (Wang et al. 2022), which form the problem as a supervised learning task and train a binary classifier for genome-wide detection. The limitation of the supervised classification framework primarily manifests in its detection speed and relatively small reception fields. Genome-wide detection with a binary classifier can be computationally inefficient as the small window causes scanning to be resource-intensive and limits the scope of contextual features (Wolff et al. 2022), and it also requires further pooling or clustering as postprocessing to merge neighboring loops (Fig. 1A, upper panel). The other widely used framework is the kernel-based framework such as Chromosight (Fig. 1A, middle; Matthey-Doret et al. 2020). Inspired by computer vision, Chromosight compares the bin pairs with local backgrounds and identifies the high-correlation regions as loops. It accelerates the process by incorporating convolution kernels during prediction. However, comparative studies (Wolff et al. 2022) have shown that current computational pipelines can be further accelerated via general-purpose graphic processing unit (GPU) devices. Additionally, the existing classification methods offer significant potential for performance improvement, such as by optimizing the pooling step or enlarging the receptive field. The current kernel-based frameworks also require time-consuming preprocessing and balancing ahead of computation, which can be further optimized within each detection window using a divide-and-conquer approach, thereby reducing computational time.
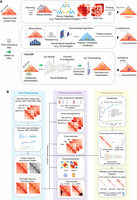
Framework and experimental design of YOLOOP. (A) Existing loop calling framework variations and comparison between the existing statistical methods, computational methods (classification or kernel-based), and the proposed detection framework for chromatin loop detection. (B) Overview of the detailed workflow and experiment design for YOLOOP in data preparation, training, evaluation, and application on single-cell analysis.
In this paper, we propose YOLOOP (YOLO for chromatin LOOP detection), a faster and adaptive genome-wide chromatin structure detection framework (Fig. 1A, bottom) along with the pretrained model. By combining an enhanced YOLOv8 (Redmon and Farhadi 2018; https://github.com/ultralytics/ultralytics) object detection engine with an optimized sliding-window mechanism, YOLOOP shows significant speed improvement (30-fold acceleration to the classification approach, up to 20-fold acceleration to the SOTA kernel-based framework, and fivefold acceleration to statistical programs) on multiple important cell lines, experiment protocols, and resolutions. As an end-to-end object detection algorithm, YOLOOP accelerates the pooling step with nonmaximum suppression (NMS) filtering. The initial normalization process is evenly distributed to each detection process, providing at least a 10-fold speed-up. In contrast to the classification framework that employs sliding windows for fragment classification, in which the classifier can only access local information around the contact map, YOLOOP excels in utilizing contextual information by employing a receptive field that is more than 2000 times larger. The proposed framework is also capable of generalizing to diverse data, including various cell lines, species, experiment protocols, and multiresolution contact maps, accurately with no need for retraining. Moreover, YOLOOP can achieve fast adaptation on the extremely sparse scHi-C contact maps with minimal fine-tuning and is still capable of effectively characterizing long-range interactions in the genome.
Results
Overview of YOLOOP
Given the high degree of conservation in loop positions and the distinctive patterns they exhibit, this computational problem aligns well with a data-driven detection framework. Following the method of Salameh et al. (2020), we assembled a collection of positive chromatin interactions for YOLOOP using experimentally validated long-range loop interactions identified through ChIA-PET or HiChIP, primarily those supported by CTCF and RAD21 binding factors (Fig. 1B). To ensure YOLOOP's generalization capabilities, our training incorporated multiple Hi-C contact maps derived from distinct cell types, including the GM12878, HCT-116, K562, and IMR-90 cell lines. The model was pretrained on 19 human autosomes within each TF. The evaluation was conducted on the remaining three held-out chromosomes with standard evaluation criteria: recall, precision, and F1-score. Although the proposed framework is general purpose in nature, YOLOOP can also be fine-tuned or adapted for specific tasks regarding various sparsity conditions, including extremely sparse scHi-C contact maps. For detailed information about the train-test split and benchmarking details, see Methods.
Benchmark and acceleration of YOLOOP in GM12878 Hi-C
To first validate YOLOOP's detection speed, we systematically compared the computing time and the prediction accuracy of YOLOOP with four existing methods on the Homo sapiens GM12878 Hi-C contact map (Rao et al. 2015) at high resolution (5 kb). HiCExplorer (Ramírez et al. 2018), HiCCUPS (Rao et al. 2017), Peakachu (Salameh et al. 2020), and Chromosight (Matthey-Doret et al. 2020) were selected as baselines for statistical approaches, classification framework, and kernel-based framework. YOLOOP adopts a different detection paradigm from the existing ones. Such an end-to-end detection scheme enables YOLOOP to achieve significant acceleration in comparison to traditional methods: 30-fold compared with HiCExplorer, 20-fold compared with Peakachu and Chromosight, and five- to 10-fold compared with HiCCUPS (Fig. 2F; Supplemental Figs. S1, S2). Owing to its impressive speed, YOLOOP can complete the detection across all 22 autosomes within a mere 4 min at 5 kb high resolution, demonstrating its exceptional efficiency in handling genome-scale data.
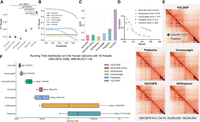
Performance and acceleration of YOLOOP in GM12878 Hi-C and comparison with baseline methods. (A) Statistical evaluation with F1-score, comparing YOLOOP against existing methods, with P-values calculated from the two-tailed t-test indicating the significance of the improvement. (B) Sensitivity evaluation. Each line represents the method's sensitivity to threshold selections. (C) Area under the curve (AUC) value of the sensitivity curve. (D) Precision-recall curve on GM12878 Hi-C with a 0.1 threshold gap with AUC reported across all benchmark methods. (For aesthetic purposes, we omitted connecting the (0,0) point.) (E) Visualization of orthogonal ChIA-PET CTCF binding sites and predicted loops by different methods. (F) Acceleration of YOLOOP compared with multiple baselines. The running time distribution is shown for four contact maps on human autosomes at 5 kb resolution, with five runs on each datum to increase statistical reliability. All multithreading-enabled algorithms were benchmarked with 16 CPU threads. Chromosight* indicates its running time after matrix balancing.
In addition, YOLOOP's significant improvement in speed does not compromise accuracy. We systematically compared the average recall, precision, and F1-score for each method against experimentally validated CTCF-mediated loops on the same contact map at 10 kb resolution (Fig. 2A,E; Supplemental Figs. S4, S5). A two-tailed t-test was employed to confirm the statistical significance of the observed difference. YOLOOP demonstrates superior performance with a significant margin in recognizing loop chromatin structures compared with other methods (HiCCUPS: P = 7.18 × 10⁻⁵; HiCExplorer: P = 3.07 × 10⁻⁵; Chromosight: P = 3.15 × 10⁻³; Peakachu: P = 2.07 × 10⁻³). Furthermore, we validated the consistency and versatility of YOLOOP's performance across various loop confidence score thresholds. The distribution of the F1-score across all threshold values for each method is shown in Figure 2B. As statistical methods, HiCCUPS (Rao et al. 2015) and HiCExplorer (Ramírez et al. 2018) assign P-values to each loop prediction instead of confidence scores, as reflected by their flat lines against thresholds (Fig. 2B). The area under the curve (AUC) for all methods’ sensitivity curves was also calculated as an indicator of the overall performance across varying thresholds (Fig. 2C). YOLOOP achieves the highest AUC for F1-score (∼0.41) with a large margin (∼0.25), showcasing YOLOOP's robust performance across threshold selections. Such information can be further validated with the precision-recall curve (see Fig. 2D). Overall, YOLOOP demonstrates a consistent superiority over existing methods across threshold selection, while also maintaining an exceptional detection speed on genome-scale contact maps.
Cell type cross-validation of YOLOOP and peak analysis
Chromosomes exhibit cell type–specific 3D structures, including chromatin loops, reflecting the selective gene expression across different cell types (Fig. 3B). To test our model's versatility, we conducted validations across multiple cell types using Hi-C data from four representative cell lines: GM12878, IMR-90, HCT-116, and K562 (see Methods subsection “Data and training” below) (Supplemental Tables S3, S5; Rao et al. 2015, 2017). GM12878, a lymphoblastoid line, serves as a baseline for chromatin spatial structure, DNA modification, and genetic traits analysis. IMR-90, comprising fibroblasts from normal lung tissue, is advantageous for studying tumorigenesis and other physiological mechanisms. HCT-116, a human colorectal cancer cell line, is commonly employed in cancer-related research. K562, a human myelogenous leukemia cell line, originates from human bone marrow. When evaluated on different cell lines, YOLOOP exhibits exceptional performance in discriminating loop chromatin structures across multiple cell lines, which is supported by statistical comparisons with baseline methods (HiCCUPS: P = 1.07 × 10⁻⁴; HiCExplorer: P = 1.05 × 10⁻⁴; Chromosight: P = 1.6 × 10⁻²; Peakachu: P = 2.2 × 10⁻³) (Fig. 3A).
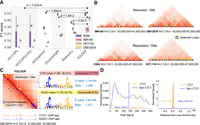
Application of YOLOOP on multiple cell lines and peak analysis. (A) Statistical evaluation with F1-score benchmarking YOLOOP against existing methods across four cell lines. Each box contains F1-score distributions evaluated on all test chromosomes. The P-values calculated from the two-tailed t-test indicates the significance of the average difference in F1-score between the YOLOOP and baseline methods across four cell lines. (B) Visualization of the detection results by YOLOOP on four cell lines. (C) Zoom-in detection results of YOLOOP on contact map of GM12878 cell for Chromosome 14 at 10 kb resolution. YOLOOP is able to recover the majority of the CTCF-enriched loops with a clear motif pattern (E-value denotes the statistical significance of the motif). The CTCF and RAD21 ChIP-seq signals in the anchors of the detected loops are shown under the contact map. (D, left) Density plots of the ChIP-seq signal value of the loops detected by YOLOOP against orthogonal CTCF binding sites in GM12878 cells. (Right) Density plots of the distance distribution for CTCF-supported loop anchors and non-CTCF-supported loop anchors.
One prominent feature of chromatin organization is the significant enrichment of CCCTC transcription factor (CTCF) binding sites at loop anchors across mammals, a pattern that can be captured by YOLOOP. When applied to the GM12878 cell line, YOLOOP is able to recover 88.23% of the 1470 CTCF binding peaks on Chromosome 14. This high recovery rate showcases YOLOOP's accuracy in loop detection and its ability to capture biologically relevant features of chromatin organization. Additionally, we collected loop anchors identified by YOLOOP. We compiled related sequences using their closest ChIP-seq CTCF binding peaks and performed Multiple Em for Motif Elicitation (MEME) analysis (Fig. 3C; Bailey and Elkan 1994; Bailey et al. 2015). Detailed explanations for the motif discovery and MEME analysis can be found in Supplemental Figure S11. Among all detection results on Chr 14, 1297 are CTCF-supported loops (µ = 145.19, σ = 89.44), compared with 5403 non-CTCF-supported loops (µ = 138.11, σ = 87.72) (Fig. 3D, left). A two-tailed t-test statistic is reported, which yields a t-statistic of 2.59 and a significant P-value of 0.012.
In addition to CTCF binding scores, we also examined the spatial relationship between predicted loop anchors and ChIP-seq peaks. We visualized the distribution of distances from each positive loop anchor to CTCF peaks, offering further insights into the accuracy of YOLOOP's loop predictions. The predicted CTCF-supported loops show a strong spatial correlation with CTCF peaks. They are predominantly concentrated within narrower regions, characterized by notably shorter distances (µ = 94.06 bp) from ChIP-seq peaks. In contrast, non-CTCF-supported loops exhibit a significantly greater average distance from ChIP-seq peaks (µ = 56,475.53 bp) (Fig. 3D, right; Supplemental Fig. S8). This spatial analysis confirms that YOLOOP's predictions are accurate not only in terms of CTCF binding scores but also in spatial proximity to actual CTCF binding sites, highlighting the efficacy of YOLOOP in accurately predicting chromatin loops and their association with key genomic markers.
Generalizing YOLOOP on multiresolution Hi-C contact maps
Advances in sequencing technologies, such as in situ Hi-C (Rao et al. 2015), have significantly enhanced the success rate of high-resolution library construction while reducing the complexities associated with dilute ligation Hi-C (standard Hi-C). These advancements now enable researchers to analyze in situ Hi-C contact maps at high resolutions, such as 5 kb or even 1 kb. However, the contact map shows distinct similarity cutoffs under various sparsity regarding sequencing depths. As the resolution increases, the contact maps tend to be sparser (52.7% at 25 kb resolution, 87.6% at 10 kb resolution, and 91.3% at 5 kb resolution) (Fig. 4B; for definition for sparsity, see Supplemental Information). As a result, chromatin loops at different resolutions may present various generic patterns. Given that chromatin loops are typically defined at resolutions ranging from 5 kb to 20 kb (Rao et al. 2015; Kong and Zhang 2019), it is essential for computational methods to have the robustness to process data across these varying resolutions.
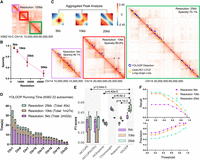
YOLOOP handling Hi-C maps on Homo sapiens K562 cells at multiple resolutions. (A) Sampled results on the K562 Hi-C contact matrix (Chr 14: 10,000,000–60,000,000). (B) Hi-C matrix sparsity statistics at 5 kb, 10 kb, and 25 kb resolution on Chromosome 14 of the H. sapiens K562 cell line. (C) Aggregated loop patterns and zoom-in detection results under multiple resolutions. (D) Running time for YOLOOP on 22 autosomes at multiple resolutions. (E) Statistical evaluation with F1-score benchmarking YOLOOP with existing methods across three different resolutions on the K562 cell line. Each box contains F1-scores distribution evaluated on all test chromosomes, with P-values calculated from the two-tailed t-test indicating the significance of the average differences across three resolutions. (F) The precision and recall curve of YOLOOP under various threshold selections.
Regardless of the similarity cutoffs, YOLOOP successfully captures distinct loop patterns at various sparsity levels across different resolutions, including 5 kb, 10 kb, and 25 kb (Fig. 4A,C). With a frame size of 512 × 512, the large receptive field allows the model to capture a broader context in the Hi-C map, enhancing its ability to accurately detect interaction regions in challenging scenarios across multiresolutions. For example, at 5 kb resolution, YOLOOP captures a large proportion of loop anchors (93.31%) that reflected loci under a 500 kb span, resulting in a relatively compact pattern. The pileup plot of the detected loops is more aggregated individually (Fig. 4C). However, at a lower resolution (25 kb), long-range loops are more concentrated on either side of the diagonal, resulting in a relatively more distinct pattern. Statistically, only 72.7% of the loop loci fall within a 500 kb distance at this resolution. Additionally, a greater proportion of loop loci (8.4%) at the 25 kb resolution fall within an extensive genomic span >1 Mb. This analysis emphasizes the resolution-dependent nature of chromatin loop patterns and highlights YOLOOP's ability to accurately capture these patterns across varying resolutions.
Moreover, YOLOOP is able to quickly generalize to multiresolution Hi-C maps with no need for additional training. Notably, the computational time and memory usage increase as the resolution increases (Fig. 4D; Supplemental Fig. S7). For instance, YOLOOP can complete genome-wide detection in ∼40 sec at a 25 kb resolution, and even at a higher resolution of 5 kb, it can still finish the detection process within ∼3 min (Fig. 4D). Meanwhile, YOLOOP demonstrates robust benchmark performances in terms of F1-score across three different resolutions (compared with HiCCUPS: P = 3.64 × 10⁻³; HiCExplorer: P = 4.42 × 10⁻⁵; Chromosight: P = 6.6 × 10⁻²; and Peakachu: P = 4.1 × 10⁻³) (Fig. 4E). As the resolution increases, loop calling gradually becomes more challenging. For instance, when applied to in situ Hi-C maps of K562 cells, YOLOOP identifies 9822 peaks at the 10 kb resolution in contrast to 21,903 peaks at the 25 kb resolution, leading to a relatively higher recall (40.9%) and lower precision (55.7%) at low resolution (25 kb). Conversely, when analyzing detection results at the finer 5 kb resolution, YOLOOP demonstrates a lower recall (23.3%) but achieves a significantly higher precision (85.4%) (threshold: 0.6) (Fig. 4F). This trade-off between recall and precision reflects the inherent challenges of peak detection at different resolutions.
Application of YOLOOP to different species and proximity ligation protocols
Beyond Hi-C, YOLOOP is also readily adaptable to multiple species, for example, human to mouse, and multiple ligation protocols, such as ChIA-PET, HiChIP, and Micro-C (Fig. 5A). The CTCF in situ ChIA-PET contact matrix on human GM12878 cells was produced by running the standardized Hi-C pipeline on ChIA-PET FASTQ files (Tang et al. 2015). HiChIP of cohesin GM12878 is produced with a similar protocol (Mumbach et al. 2016). When validated on mouse embryonic stem cell (mESC) Hi-C, YOLOOP is able to detect 11,167 loops, with a recovery rate of 26% out of orthogonal ChIA-PET interactions. As for generalizing across different chromatin interaction capture protocols, note that generalizing across these diverse protocols presents inherent challenges owing to their significant differences in sparsity (Fig. 5B). With the exception of Hi-C contact maps (average sparsity: 88.68% ± 0.07), the contact maps of ChIA-PET and HiChIP are notably sparser (ChIA-PET: 98.71% ± 0.03; HiChIP: 95.74% ± 0.01). This high level of sparsity could result in information loss, potentially leading to inaccuracies in interaction analysis. We found that the number of recovered loops in each protocol is positively correlated with the data coverage. Despite the variations in resolution, sparsity, and generic loop patterns across different protocols, YOLOOP demonstrates a high recovery rate across multiple approximation-ligation protocols, recovering an average of ∼30% long-range loop interactions with high confidence. For instance, YOLOOP uncovers a total of 10,600 loops in Hi-C GM12878 (recall: 31%; precision: 81.4%), 4248 loops in HiChIP GM12878 (recall: 11.7%; precision: 60.3%), 6437 loops in ChIA-PET GM12878 (recall: 10.8%; precision: 87.3%), and 179,000 loops in the Micro-C HFFc6 cell line. In addition, YOLOOP stands out as the top-performing method in cross-protocol evaluation when considering precision, and it is second only to Peakachu in terms of recall (Fig. 5C,D). We also report the precision-recall curve regarding each method's sensitivity to threshold control in Supplemental Figures S4 and S5. Approximately 80% of the detected loops are found within confidence intervals >95%. This analysis underscores YOLOOP's reliability as an analytical tool for data generated through a wide array of proximity ligation protocols.
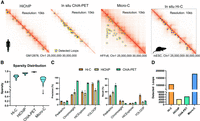
Fast adaptation of YOLOOP on multiple species and proximity ligation protocols. (A) YOLOOP is able to accurately capture loop anchors under multiple experimental protocols (ChIA-PET, HiChIP, Micro-C) in human and mouse cells. (B) Sparsity distribution for contact maps from various experiment protocols. (C) Statistical recovery rate and precision benchmarking YOLOOP against existing algorithms on Hi-C, ChIA-PET, and HiChIP GM12878 contact maps. (D) Enumeration of YOLOOP's predictions on contact maps from multiple protocols.
Fast adaptation of YOLOOP to single-cell Hi-C
YOLOOP, as a deep-learning-based model, presents a significant advantage in its ability to adapt to varying data conditions. By fine-tuning the model pretrained on bulk Hi-C data, YOLOOP can be readily adapted to accommodate the relatively sparse scHi-C contact matrices, which average a sparsity of 99.91% ± 0.01. Because of domain shift, existing algorithms, such as HiCExplorer (Ramírez et al. 2018) and Chromosight (Matthey-Doret et al. 2020), experienced a low recovery rate when applied to scHi-C contact matrices (Supplemental Fig. S9). Therefore, we validated YOLOOP's adaptive performance on more than 900 single-cell mESC sequencing data (Nagano et al. 2017) and benchmarked with SnapHiC (Yu et al. 2021), a tool specifically designed for loop calling on sparse single-cell data.
To investigate the conditions under which the loop patterns become distinct and to examine how the sparsity of contact matrices influences prediction speed, we systematically superimposed single-cell contact pairs from 100 to 900 cells to assess YOLOOP's ability to recover SMC1 loops at varying levels of sparsity (Fig. 6A,B). Notably, as the number of cells used for superimposition increases, the averaged generic pattern of detected peaks becomes more distinct (Fig. 6A), and the recovery rate increases proportionally. We observed an increasing recovery rate of 14.1% for 100 cells, 16.4% for 200 cells, 26.93% for 500 cells, and 75.1% for 900 cells. The majority of the conspicuous loops with low P-values (<0.001) are recovered by YOLOOP during genome-wide prediction.
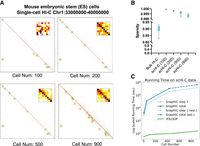
Fast adaptation of YOLOOP on single-cell data. (A) Superimposed single-cell contact matrices from 100 to 900 cells along with the detected loop patterns. (B) Sparsity comparison between bulk Hi-C and scHi-C data. (C) Prediction time comparison between YOLOOP and SnapHiC when increasing the imposed cell numbers. Time benchmarking for two methods both started from raw contact pair data. Estimations for SnapHiC's running time on 900 cells were interpolated owing to its time intensity.
In terms of computational speed, because YOLOOP adopts simple fine-tuning instead of extensive data normalization and augmentation to handle single-cell data's sparsity, it achieves a 1000-fold acceleration to SnapHiC (Yu et al. 2021) even with 32 threads. Notably, YOLOOP is capable of completing a genome-wide loop calling for 900 cells within 3 min (including binning time and contact matrix generation from single-cell contacting pairs), compared with the excessive time consumption by SnapHiC (more than 105 wall-clock seconds or 4 days to process the same number of single-cell data) (Fig. 6C). Therefore, it highlights YOLOOP's exceptional efficiency and promising potential in the research of large-scale single-cell data analysis (Supplemental Fig. S10).
Discussion
In this paper, we proposed YOLOOP, a fast and adaptive detection framework for chromatin 3D structure detection on genome-wide contact maps. We showed that YOLOOP can greatly accelerate loop calling while ensuring improved detection accuracy. In terms of utility, we provided the pretrained models that can be generalized to multiple cells, ligation protocols, species, multiresolution Hi-C maps, and sparse scHi-C matrices without retraining. Prior work has regarded this problem as a statistical estimation problem, a classification task, or a pattern recognition problem. As it is particularly challenging to boost the algorithm's speed within the existing paradigm, we developed an efficient and adaptive approach by regarding the problem as an object detection task. We believe that incorporating the YOLO detection engine for chromatin contact interaction is a well-motivated and intuitive idea. A robust detection engine can accurately identify true interactions while minimizing false positives and negatives. Furthermore, a suitable detection engine for Hi-C data is adaptable, allowing for updates and improvements to stay current with the latest advancements in 3D genomics.
By training with tens of thousands of loop patterns from multiple cell lines, YOLOOP facilitates a robust and general paradigm, which can be further applied to large-scale feature extraction and benefit downstream analysis on the vast amount of scHi-C data. YOLOOP also has the potential to be adapted for investigating hypergraph embedding, genome structure characterization, and cell type classification. Although the proposed YOLOOP is primarily a data-driven method, many more interesting downstream analyses could be done. For instance, because the loop structures can change dynamically both temporally and spatially (such as cell organization and development), YOLOOP can be utilized to facilitate future research, including enhancer-promoter loop detection, and joint analysis with ChIP-seq, RNA-seq, DNase-seq, and FAIRE-seq data. Given its robustness and fast adaption, it can also be helpful to assist researchers in the study of single-cell Hi-C.
Methods
Framework design
As an end-to-end trained model, the main part of YOLOOP is built upon the YOLOv8 (https://github.com/ultralytics/ultralytics) engine. We adopted its main CSPDarknet53 architecture as well as hyperparameters to fit well on the Hi-C contact map (see Supplemental Table S7). Primarily, we adopted the YOLOv8-nano architecture with fewer parameters and simplified layers, enabling it to efficiently process large Hi-C matrices at high speed.
Furthermore, as chromatin loops are rather small targets relative to the contact matrix, it is essential to enhance the model's accuracy to recall such small objects. We have customized the anchor boxes to better match the size distribution (<500 kb span) of the majority of the chromatin loops. Three sets of anchor boxes suitable for such a design are applied in YOLOOP for possible user-defined adjustments (see Supplemental Materials). By employing the anchor boxes, YOLOOP can estimate the size of the interaction targets more quickly and precisely, while simultaneously enhancing its robustness to accommodate positional variations of loop targets, thus improving the efficiency, precision, and robustness of its predictions.
Data and training
The in situ Hi-C data were collected from publicly available databases including the NCBI Gene Expression Omnibus (GEO; https://www.ncbi.nlm.nih.gov/geo/) (Rao et al. 2015), 4DN Portal (https://data.4dnucleome.org/) (Dekker et al. 2017), and ENCODE (https://www.encodeproject.org/) (Davis et al. 2018) (see Supplemental Tables S5, S6). The in situ Hi-C contact maps were derived from the 4DN Portal under the following accession codes: GM12878 (4DNFIXP4QG5B), IMR-90 (4DNFIJTOIGOI), HCT-116 (4DNFILP99QJS), and K562 (4DNFI4DGNY7J). The CTCF ChIA-PET long-range loops were obtained from the ENCODE project with the following accession codes: GM12878 (ENCSR184YZV), IMR-90 (ENCFF682YFU), HCT-116 (ENCFF558NWU), and K562 (ENCSR597AKG). RAD21 ChIA-PET for the GM12878 cell line were obtained from accession code ENCSR981FNA. ChIP-seq data for peak analysis are available at accession code ENCFF796WRU (GM12878 CTCF) and ENCFF662DRZ (GM12878 RAD21). The in situ ChIA-PET running on a standardized Hi-C pipeline was downloaded from 4DN Portal (4DNFI5HEOQO9). The HiChIP matrices for the human GM12878 cell line were from GEO under accession number GSE80820. The Micro-C data on the HFFc6 cell line were downloaded from 4DN Portal under accession number 4DNFI9FVHJZQ. The single-cell sequencing data for mESC were obtained from Nagano et al. (2017). For positive chromatin interactions, orthogonal ChIA-PET or HiChIP interactions were screened and subjected to rigorous quality control (see Supplemental Fig. S6; Supplemental Table S3). We developed specialized detection models trained on various cell types and binding factors and further refined these models on scHi-C maps. Pairs of Hi-C contact maps and orthogonal interactions were used for training each model for multiple cell types. Each cell type was individually evaluated against various benchmarks. We only fine-tuned the model under scHi-C data, given their notably sparse context.
Before training, the contact maps were partitioned into patches centered around each loop target and saved as one-channel images; loop targets were saved as bounding boxes with a uniform box size to increase computational efficiency and mitigate potential biases in the loss function. For in situ Hi-C, positive loop anchors are generated regarding various binding factors (e.g., CTCF, RAD21). We obtain training samples by chunking contact matrices centered on loop anchors at 10 kb resolution. Each sample might contain hundreds of loop objects spanning different genomic regions. For scHi-C data, we collected more than 900 single-cell mESC data and converted them to contact matrices with the standard cooler pipeline (Nagano et al. 2017; Abdennur and Mirny 2020). The single-cell data were further categorized into different mitosis phases based on their percentage of cis interactions in various bin intervals (see Supplemental Table S4; Nagano et al. 2017).
During the training stage of YOLOOP, 19 of the 22 autosomes in the human genome (or alternatively, 16 of the 19 chromosomes in the mouse genome) were selected to train the model, whereas Chromosomes 1, 9, and 14 were consistently excluded from training and reserved exclusively for final evaluation, in which they were selected to form a 4:1 train-test split and ensure no data leakage (Supplemental Fig. S3). To mitigate the risk of overfitting, models were trained and underwent cross-validation for each cell line over a period of 20 epochs, with the weight for the best-performing model saved. For training time comparison, see Supplemental Table S2.
Genome-wide detection
For genome-wide detection, YOLOOP accepts inputs in cooler formats (Abdennur and Mirny 2020), because they are compact and efficient, and can also be easily transformed from other file formats. During genome-wide detection, YOLOOP operates in three stages: partitioning, detection, and coordinate mapping. First, a sliding window traverses the genome-wide contact map, generating a series of one-channel images by partitioning the contact map. Each image then serves as an individual input to the detection module, with the total number of images ranging from approximately 100 to 500, depending on the exact chromosome sizes. The sliding window of 512 × 512 pixels is uniformly applied across all resolutions.
As the scanning process traverses the entire genome, the coordinates of predicted loop anchors, initially defined in each local detection frame, are transformed into genomic coordinates on the respective chromosomes. Through optimization of the time-consuming genome-wide prebalancing and pooling steps, YOLOOP excels in terms of both detection speed and accuracy.
Distributed normalization
YOLOOP employs a distributed normalization approach, conducting the normalization process concurrently with detection rather than prebalancing the entire genome. During detection, normalization is conducted within each sliding window, offering speed-up and focusing on local contexts, which are more relevant to genomic organizations like chromatin interactions. To balance between local and global contexts, we increased the frame size of the sliding window to 512 × 512, which increases the receptive field by more than 2000-fold compared with previous methods (Salameh et al. 2020; Zhang and Blanchette 2022). In addition, YOLOOP does not preclude the benefit of prebalanced matrices and preserves flexibility by allowing users to opt for prebalanced matrices, thus accommodating different analysis needs.
Nonmaximum suppression
The NMS technique is used primarily to eliminate highly redundant loop candidates. All detected bounding boxes, each with an associated confidence score, are sorted in descending order. The loop candidate with the highest score is selected, and its intersection over union (IoU) with other boxes is calculated. Redundant detections below a set IoU threshold are discarded. Each remaining loop candidate is then assigned a confidence score as the predicted loop probability. The final output of YOLOOP is a standard BEDPE file, with the seventh column representing the aforementioned predicted probability or confidence score. Importantly, NMS can maintain high-confidence detections while being performed in almost real time without iterative clustering, offering significant speed-up compared with the time-consuming pooling steps of previous methods.
Benchmarking
We systematically benchmarked YOLOOP's performance with Chromosight (Matthey-Doret et al. 2020), Peakachu (Salameh et al. 2020), HiCCUPS (Rao et al. 2015), and HiCExplorer (Ramírez et al. 2018) on bulk Hi-C data and with SnapHiC (Yu et al. 2021) on scHi-C data. Because Chromosight, HiCCUPS, and HiCExplorer were not designed for training with customized data sets, they were directly applied to our data to perform loop calling, with their recommended hyperparameter configurations. Those loop predictions were subsequently thresholded and evaluated. For Peakachu, following its official instructions, an individual random forest model was trained per chromosome using the remainder of the genome, followed by loop prediction on the isolated chromosome using this model. All baseline algorithms were updated to their latest versions (Chromosight v1.6.2-0, Peakachu v2.2, HiCExplorer v3.7.2, HiCCUPS: Juicer v1.6 [Durand et al. 2016], and SnapHiC v0.2.0). To achieve a fair and comprehensive comparison, we systematically evaluated the possible parameters in benchmarking methods and selected the recommended ones for evaluation (Supplemental Tables S7–S12).
For accuracy comparison, standard evaluation criteria—recall, precision, and F1-score—were applied throughout all experiments. Following established practices (Salameh et al. 2020), detected loop anchors within a 10-resolution proximity of a loop target were classified as true positives. False positives and false negatives were quantified as the remaining loops in the predicted set and the orthogonal set, respectively. The Hungarian algorithm was implemented to preclude duplicated mappings to the same target or prediction (for details of the accuracy evaluation method, see Supplemental Information). Consequentially, recall, precision, and F1-score were computed under different thresholds, and the AUC was evaluated for each metric.
For speed comparison, YOLOOP, Chromosight (Matthey-Doret et al. 2020), Peakachu (Salameh et al. 2020), HiCCUPS (Rao et al. 2015), HiCExplorer (Ramírez et al. 2018), and SnapHiC (Yu et al. 2021) were benchmarked under identical conditions on a Linux workstation with one NVIDIA Tesla V100 GPU and dual Intel Xeon gold 6226R CPUs (for a detailed hardware configuration, see Supplemental Table S1). We also conducted a thorough benchmark of the baseline methods’ running times across varying numbers of CPU threads. To ensure a fair comparison, we included the preprocessing time of Chromosight (Matthey-Doret et al. 2020) during its first run, given its requirement to first balance the contact matrix with the ICE algorithm (Imakaev et al. 2012). When benchmarking Peakachu (Salameh et al. 2020), the computing time included the pooling time during postprocessing. Details of running time benchmarking can be found in the Supplemental Information.
Software availability
The open-source implementation of YOLOOP is available in the Supplemental Code and at GitHub (https://github.com/WangJiuming/YOLOOP). Custom scripts for the reproduction of the work can be found at Code Ocean (https://codeocean.com/capsule/7974615/tree/v2).
Competing interest statement
The authors declare no competing interests.
Acknowledgments
The work was supported by the Fund of the Chinese University of Hong Kong (awards 4937025, 4937026, 5501517, 5501329); the King Abdullah University of Science and Technology (KAUST) Office Administration (ORA; awards FCC/1/1976-44-01, FCC/1/1976-45-01, REI/1/5234-01-01, REI/1/5414-01-01). This research was also funded by a Hong Kong PhD fellowship (PF22-73180 to J.W.) from the Research Grants Council, Hong Kong SAR, China.
Author contributions: S.C., J.W., X.G., and Y.L. designed the study. S.C. and J.W. constructed the YOLOOP framework, wrote the original code, and trained the detection pipeline. J.W. performed benchmarking experiments. S.C. conducted the primary analysis with bulk Hi-C data. J.W. prepared the evaluation metrics and prepared the scHi-C data. I.J. and Z.Q. helped with the primary analysis and improved the source code. S.C., J.W., X.G., and Y.L. generated the figures and wrote the manuscript.
Footnotes
-
[Supplemental material is available for this article.]
-
Article published online before print. Article, supplemental material, and publication date are at https://www.genome.org/cgi/doi/10.1101/gr.279274.124.
-
Freely available online through the Genome Research Open Access option.
- Received March 5, 2024.
- Accepted August 8, 2024.
This article, published in Genome Research, is available under a Creative Commons License (Attribution-NonCommercial 4.0 International), as described at http://creativecommons.org/licenses/by-nc/4.0/.


