
Single-cell analysis reveals transcriptional dynamics in healthy primary parathyroid tissue
- Aarthi Venkat1,10,
- Maximillian J. Carlino2,3,10,
- Betty R. Lawton2,3,10,
- Manju L. Prasad4,
- Matthew Amodio5,6,
- Courtney E. Gibson7,
- Caroline J. Zeiss8,
- Scott E. Youlten9,
- Smita Krishnaswamy1,2,5,9,11 and
- Diane S. Krause2,3,4,11
- 1Computational Biology and Bioinformatics Program, Yale University, New Haven, Connecticut 06511, USA;
- 2Yale Stem Cell Center, Yale School of Medicine, New Haven, Connecticut 06520, USA;
- 3Department of Laboratory Medicine, Yale School of Medicine, New Haven, Connecticut 06510, USA;
- 4Department of Pathology, Yale School of Medicine, New Haven, Connecticut 06520-8023, USA;
- 5Department of Computer Science, Yale University, New Haven, Connecticut 06511, USA;
- 6Broad Institute of MIT and Harvard, Cambridge, Massachusetts 02142, USA;
- 7Department of Surgery, Yale School of Medicine, New Haven, Connecticut 06520, USA;
- 8Department of Comparative Medicine, Yale School of Medicine, New Haven, Connecticut 06520, USA;
- 9Department of Genetics, Yale School of Medicine, New Haven, Connecticut 06510, USA
Abstract
Studies on human parathyroids are generally limited to hyperfunctioning glands owing to the difficulty in obtaining normal human tissue. We therefore obtained non-human primate (NHP) parathyroids to provide a suitable alternative for sequencing that would bear a close semblance to human organs. Single-cell RNA expression analysis of parathyroids from four healthy adult M. mulatta reveals a continuous trajectory of epithelial cell states. Pseudotime analysis based on transcriptomic signatures suggests a progression from GCM2hi progenitors to mature parathyroid hormone (PTH)–expressing epithelial cells with increasing core mitochondrial transcript abundance along pseudotime. We sequenced, as a comparator, four histologically characterized hyperfunctioning human parathyroids with varying oxyphil and chief cell abundance and leveraged advanced computational techniques to highlight similarities and differences from non-human primate parathyroid expression dynamics. Predicted cell–cell communication analysis reveals abundant endothelial cell interactions in the parathyroid cell microenvironment in both human and NHP parathyroid glands. We show abundant RARRES2 transcripts in both human adenoma and normal primate parathyroid cells and use coimmunostaining to reveal high levels of RARRES2 protein (also known as chemerin) in PTH-expressing cells, which could indicate that RARRES2 plays an unrecognized role in parathyroid endocrine function. The data obtained are the first single-cell RNA transcriptome to characterize nondiseased parathyroid cell signatures and to show a transcriptomic progression of cell states within normal parathyroid glands, which can be used to better understand parathyroid cell biology.
Parathyroid (PT) glands are critical for maintaining calcium (Ca2+) and phosphate homeostasis. In response to low serum Ca2+ levels, PT glands secrete parathyroid hormone (PTH), which increases blood Ca2+ levels by promoting Ca2+ release from bone and Ca2+ reabsorption in the kidney and indirectly by promoting Ca2+ absorption in the intestine. PT pathologies include hyperparathyroidism and hypoparathyroidism (HP). Primary hyperparathyroidism occurs with an estimated incidence of ∼0.86% of the U.S. population and most commonly occurs owing to formation of uniglandular enlarged PTs (Bilezikian et al. 2018). HP, with approximately 30 cases per 100,000 person-years, occurs owing to congenital defects, autoimmunity, and, most commonly, inadvertent surgical damage to the glands, all of which necessitate therapeutic intervention to maintain normal Ca2+ and phosphate levels (Mannstadt et al. 2017; Gafni and Collins 2019). In some patients, HP can be managed adequately with dietary vitamin D and Ca2+, but in others, unstable physiological levels of Ca2+ can lead to severe symptoms including muscle cramping, tetany, convulsions, and chronic fatigue (Gafni and Collins 2019). In surgical cases in which inadvertent damage to PT glands or their vascular supply may occur, fragments of functional PT tissue can be cryopreserved and used for auto-transplantation into muscle tissue to restore PT function if the patient were to develop HP (Casella et al. 2018; Nasiri et al. 2022). Thus, PT tissue contains epithelial cells or stem/progenitor cells that can sustain or restore PT function upon engraftment at exogenous sites. For most patients with HP, autologous tissue is not available, and transplantation of functional PT cells differentiated from autologous or allogeneic pluripotent stem cells represents a potential curative approach. Although progress has been made in differentiating pluripotent stem cells toward PT lineage (Bingham et al. 2009; Lawton et al. 2020), such studies have been hampered by a lack of data regarding the gene expression signature(s) and heterogeneity of epithelial cells in normal PT tissue. The adult human PT contains two apparent functional cell types: oxyphil and chief cells. Both types secrete PTH in response to low serum Ca2+, but oxyphil cells have higher levels of mitochondrial DNA and protein (Ritter et al. 2012; Shi et al. 2014; Mao et al. 2022). Transcriptomic studies of normal PT tissue have been limited to microarrays and bulk RNA sequencing of combined heterogeneous cell types within the glands (Chai et al. 2019; Hu et al. 2021; Mao et al. 2022). To provide cell type–resolved transcriptomic data on PTs, we conducted single-cell RNA sequencing (scRNA-seq) of normal PT glands from adult non-human primates (NHPs) and from hyperfunctioning human PT tissue. By examining the transcriptome of the PT epithelial cells, we provide data that will allow a clearer understanding of different epithelial subtypes including oxyphil and chief cells.
Results
To advance the study of PT biology, we conducted scRNA-seq and analysis of normal primary PT cells from four healthy NHPs and four human hyperfunctioning PT glands (Fig. 1).
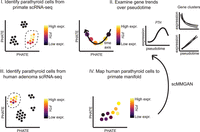
Overview of the computational analysis pipeline. (I) Identify parathyroid (PT) cells from scRNA-seq of normal non-human primate samples by high PTH, GCM2, CASR, or CHGA expression. (II) Analyze PTH+ cells and characterize gene trends over pseudotime by gene-based clustering. (III) Identify PT cells from scRNA-seq of hyperfunctioning human PTs. (IV) Map human PT cells to primate manifold with scMMGAN, which generates a representation of human PTH+ cells in the primate space for direct comparison.
NHP PT gland scRNA-seq
PT glands for scRNA-seq were obtained from four healthy Macaca mulatta, aged 22–23 years old, using infrared fluorescence to guide dissection (Paras et al. 2011). From each primate, we recovered two PT glands ranging from 1.1 to 2.1 mm on their longest axis and from 0.3 to 0.7 mm on their shortest, which were digested and processed together for scRNA-seq as one sample per primate. Histologically, the NHP PT glands are more cellular than human PT glands and have almost no adipose tissue (Fig. 2A). The glands showed a normal vascular stroma with epithelial cells organized in trabecular and tubuloglandular patterns. Nuclei are round to oval with indistinct nucleoli and thin nuclear membranes. Using criteria for assessing chief versus oxyphil cells in human tissues, the NHP PT glands are comprised predominantly (80%) of cells with features of both chief cells and oxyphils and thus are classified as transitional cells (Chaudhry et al. 1979). Specifically, they have an unevenly stained slightly eosinophilic cytoplasm with a moderate nuclear/cytoplasmic ratio, with many showing perinuclear clearing in their cytoplasm. Approximately 10% of the epithelial cells exhibit clear oxyphil morphology with dark uniform eosinophilic staining, and 10% resemble human chief cells. No mitoses were observed.
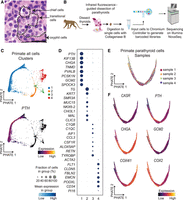
Primate PT single-cell RNA sequencing. (A) Hematoxylin and eosin (H&E)–stained primate PT tissue (scale bar, 30 µm). (B) Schematic depicting workflow of tissue preparation to generate cDNA libraries. (C) PHATE embedding of filtered primate cells colored by cluster number for five clusters and PTH expression levels. (D) Dot plot representing the frequency and expression levels of the eight most differentially expressed genes between clusters for each cluster. (E) A subset from the original data set representing primate PT cells (cluster 1) was re-embedded with PHATE and colored by sample origin. (F) PHATE embeddings colored by expression level of PT-relevant genes in PHATE plots.
Single-cell cDNA libraries were generated for each sample using the 10x Genomics platform and sequenced via Illumina high-throughput sequencing (Fig. 2B). Each primate data set was filtered for the minimum number of genes expressed in each cell, minimum total counts per cell, and minimum number of cells expressing each gene. We used a conservative filter for mitochondrial gene expression to preserve an oxyphil signature, which may contain high mitochondrial read counts. After filtration, there were 26,437 cells (6560, 5315, 5859, and 8703 cells from samples 1, 2, 3, and 4, respectively) expressing 19,708 genes. After preprocessing, there appeared to be ambient RNA cross-contamination between cells as indicated by a background of PTH transcript detected in all cell clusters. DecontX was used on the combined samples to remove the effects of ambient RNA (Supplemental Fig. S1; Supplemental Table S6; Yang et al. 2020). Furthermore, we mitigated batch effects by batch-mean centering the data and leveraging a mutual nearest neighbor (MNN) kernel to build the cellular graph (Haghverdi et al. 2018). PHATE was used to visualize the data by dimensionality reduction (Moon et al. 2019).
PHATE embedding showed distinct cell types within the NHP PT. Leiden clustering to partition cells highlighted four cell clusters (Fig. 2C; Traag et al. 2019). PyDESeq2, a pseudobulk-based statistical test, was used to identify and rank annotated differentially expressed genes (DEGs) for each cluster (Fig. 2D; Supplemental Table S1; Wilcoxon 1945; Muzellec et al. 2023). Cluster 1 is enriched for PTH-expressing cells; cluster 2 represents thyroid follicular cells expressing thyroglobulin (TG); cluster 3 is enriched for CD52 and CSF1R, representing immune cells; and cluster 4 contains endothelial cells as indicated by FLT1 and PECAM1 expression. We show the top genes are differentially enriched across replicates (Supplemental Fig. S4A) and provide genome-scale heatmaps before (i) and after (ii) batch correction to demonstrate reproducibility (Supplemental Fig. S4B).
To analyze PT cells in greater detail, the PTH+ cluster 1 was subsetted and re-embedded with PHATE, retaining 5483, 4531, 5210, and 6950 cells in samples 1, 2, 3, and 4, respectively. The resulting data distribution indicates a continuum of cells with approximately equal distribution from each of the four animal samples (Fig. 2E). Expression of the known functional PT genes CASR, PTH, CHGA, and GCM2, as well as transcripts for the mitochondrial genes COX2 and COX4I1, the most highly expressed mitochondrial transcripts in the data set, exhibits distinct localizations along the cell continuum (Fig. 2F). To assess conservation of gene–gene relationships in PT cells between replicates, we pseudobulked each replicate and built gene–gene graphs based on their denoised and pseudobulked correlation within each sample. Then, we computed the pairwise correlation across these graphs (van Dijk et al. 2018), which showed relatively high concordance between NHP replicates (R = 0.60–0.73) (Supplemental Fig. S2).
Pseudotime analysis and pseudotime gene clusters
Given the representation of the data as a continuous trajectory with PHATE, we characterized genes with dynamic expression throughout the trajectory. Pseudotime was calculated from the first diffusion eigenvector, which robustly captures the temporal order of differentiating cells (Coifman and Lafon 2006). This yields a pseudotime axis (Fig. 3A) beginning with GCM2hiPTHlo cells on the upper left and ending with GCM2lo cells that are high in PTH and CHGA, both of which are critical genes for Ca2+ regulatory functions (Fig. 3B). Although some mitochondrial genes (e.g., COX1, COX2) are expressed early in pseudotime and then decrease, most (e.g., COX4I1, TOMM20, MFN1) are expressed at higher levels later in pseudotime, reflecting a mitochondria-rich oxyphil cell phenotype (Fig. 3B). The pseudotime axis and directionality was reinforced by scVelo (Pearson's R = 0.969), a tool that infers pseudotemporal ordering of cells based on transcriptional splicing kinetics (Supplemental Fig. S10A; Bergen et al. 2020). scVelo exhibits high confidence (mean = 0.899) in the velocity estimation across all cells (Supplemental Fig. S10B).
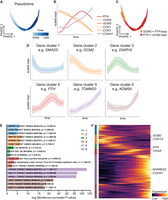
Expression dynamics of PT epithelial cells from adult NHPs. (A) PHATE embedding colored by computed pseudotime, progressing from left to right. (B) Z-Score normalized rolling average of expression of PT-relevant genes in cells along the pseudotime axis. (C) Orange cells, corresponding to the earliest part of the trajectory, denote higher scaled expression of GCM2 than PTH, and red cells have higher PTH than GCM2. (D) Gene trend clusters for all measured genes, in which the solid line corresponds to the mean Z-score normalized gene trend for all genes in a gene cluster, and the error bars correspond to 1 SD. (E) Bar chart of significantly enriched transcription factor binding site gene sets per gene cluster, their identifiers, and Bonferroni-corrected P-values. (F) Visualization of expression dynamics of each gene ordered by cluster (colors in E and F correspond to those of D).
We examined the DEGs between GCM2hi (orange) and GCM2lo (red) cells (Fig. 3C; Supplemental Table S2) and found GCM2hi cells are weakly enriched for generic ATP synthesis-related processes. In contrast, the GCM2lo cells are enriched for ribosomal genes and retinoic acid receptor responder 2 (RARRES2). The data show nonlinear patterns of gene expression that cannot be clearly characterized by cell clustering or linear correlation. As such, we constructed a genome-wide view of expression dynamics during the differentiation course. Genes were clustered by their rolling expression over pseudotime into six gene clusters (Fig. 3D), representing six patterns ordered by peak expression. Supplemental Table S3 lists genes in each cluster, along with annotations of transcription factors according to the TRRUST data set and reference list of transcription factors (Han et al. 2015; Lambert et al. 2018). Highly variable genes from each cluster were used as queries for gene set enrichment analysis (GSEA) using ToppFun to identify transcription factor target data sets. The top three enriched transcription factor binding site data sets and Bonferroni-corrected P-values from each cluster are represented in Figure 3E, except in the case of cluster 4, which was weakly enriched for TF target gene sets, yet significantly enriched for the “parathyroid gland” gene set in the Human Protein Atlas. Figure 3F illustrates the expression dynamics of all genes in the six clusters. The reproducibility of these dynamics across replicates is summarized in Supplemental Figure S5, and robustness to gene variability cutoff is demonstrated in Supplemental Figure S9.
Gene cluster 1 contains 2629 genes, 324 of which are highly variable, that have high expression that immediately drops off. This cluster includes genes encoding transcription factors implicated in PT development, including TBX1 and PAX1 (Kameda 2023). Pharyngeal segmentation requires the expression of TBX1, and mutations in TBX1 can result in a disorder characterized by HP, hypoplasia of the thymus, craniofacial defects, and cardiovascular abnormalities (Xu et al. 2005; Yutzey 2010). Gene cluster 2, with 2429 genes, of which 379 are highly variable, starts with high expression and gradually decreases along the trajectory. This cluster contains GCM2, which encodes a transcription factor critical for PT development and maintenance (Gordon et al. 2001; Yamada et al. 2019). GSEA indicates that this cluster is also enriched for GCM2 target genes as identified by the ENCODE data set ENCSR407MOM, including HERC4, RIF1, TEAD1, and STAT5B (Subramanian et al. 2005; Sloan et al. 2016; Kolmykov et al. 2021). Although derived from Drosophila cells, this ChIP-seq data set has 2444 candidate target genes with human or primate orthologs, of which 2134 are represented in our data.
Gene cluster 3, which peaks in the middle of the pseudotime progression, has 1301 genes, of which 95 are highly variable, and is enriched for genes associated with cytoskeletal organization (GO:0030036; Bonferroni-corrected P = 0.0225), including ARHGEF5 and DIAPH2. The role these and other cytoskeletal genes play in PT tissue has not been studied.
Gene cluster 4 has 1643 genes, of which 142 are highly variable, and is characterized by genes that start low in expression, increase and peak late, and then decrease in expression. This cluster includes many of the genes classically associated with PT function, including PTH, CASR, MAFB, KL, and CHGA. This cluster was moderately enriched for CBFA2T3 target genes and is enriched for genes in the Human Protein Atlas Coexpression Atlas’ “parathyroid gland” gene set (Uhlén et al. 2015). MAFB, which encodes a transcription factor that is essential for regulation of PTH in cooperation with GCM2, is present in cluster 4, suggesting that this cluster may represent the transcriptomic profile of mature, active secretory PT cells (Kamitani-Kawamoto et al. 2011).
Gene cluster 5, which exhibits a steady increase in expression over pseudotime, has 7830 genes, of which 3276 are highly variable, and is significantly enriched for genes encoding components of mitochondrial protein complexes such as TOMM20 and COX4I1; the ATP–ADP nucleotide transporter SLC25A4, ATP5F1A, and many other ATP synthase subunits; and the mitochondrial fusion regulator MFN1. This expression profile may be consistent with mitochondria-rich oxyphilic cells (Giacomello et al. 2020). GSEA showed enrichment for transcription factor target genes, most significantly NFRKB, ZNF711, and NFE2L1, whose function in PT is unknown. RARRES2 was among the most highly expressed transcripts in the entire data set and was contained in this cluster. RARRES2 has not previously been described in normal PT cells.
Gene cluster 6, defined by an increase toward the end of pseudotime, contains 3877 total genes, of which 917 are highly variable. This cluster is most significantly enriched for target genes of JDP2, which has been implicated in modifying gene expression by altering chromatin assembly to promote senescence, consistent with a terminal transcriptomic signature (Huang et al. 2011). Histone modifying genes are also enriched in cluster 6, including HDAC3 and NCOR1, which encode proteins in the histone deacetylase complex (You et al. 2013). These epigenetic modifiers could be important regulators of PT function.
Human hyperfunctioning PT gland scRNA-seq
To serve as a comparator to the NHP data, scRNA-seq was performed on fresh PT tissue from four patients with hyperfunctioning PT glands that had varying oxyphil/chief proportions based on histological analysis of H&E slides derived from the same samples that were used for sequencing. Sample Y7 was composed of ∼90% chief cells in richly vascularized clusters with fibrosis; Y9 showed a multinodular proliferation of PT cells with transitional appearance on a background of sheets of chief cells; Y11 exhibited transitional cells intermixed with 20% oxyphil cells; and Y13 was composed almost entirely of oxyphil cells with substantial fibrosis (Fig. 4A; Supplemental Table S8).
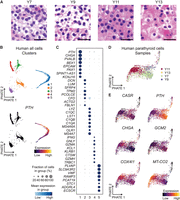
Human hyperfunctioning PT gland single-cell RNA sequencing. (A) Histology of tissue sections from the samples from which sequencing libraries were derived (H&E stain; scale bar, 30 µm). (B) PHATE embedding of filtered human cells colored by cluster number and PTH expression in the human single-cell data set. (C) Dot plot representing the frequency and expression levels of the top eight differentially expressed genes between clusters. (D) Human PT cells (cluster 1) subsetted from the original data set and re-embedded with PHATE, colored by sample origin. (E) Embedding colored by expression of PT-relevant genes in PHATE plots.
scRNA-seq data from the human hyperfunctioning PT samples were preprocessed and analyzed with the same computational pipeline as the NHP samples, except for batch-mean centering the data, as this would remove the expression-level differences between heterogeneous samples. This resulted in five clusters (Fig. 4B). Cluster 1 was enriched for several known PT-related genes such as PTH, CHGA, GATA3, PAX1, CASR, and GCM2. Cluster 2 expressed several extracellular matrix–related transcripts such as DCN, LUM, and PCOLCE. Clusters 3 and 4 reflected hematopoietic cells by expression of CD14, C1QC, CD96, and CD3E, and Cluster 5 represented endothelial cells exemplified by abundant VWF (Fig. 4C). The top 100 DEGs as determined by PyDESeq2 for each cluster are listed in Supplemental Table S4. We provide dot plots of the top genes resolved by sample (Supplemental Fig. S6A) and genome-scale heatmaps before (i) and after (ii) batch correction to demonstrate reproducibility (Supplemental Fig. S6B).
To examine human hyperfunctioning PT cells in greater detail, cluster 1, which was enriched for PTH+ cells, was subsetted and re-embedded using PHATE, retaining 1563, 96, 1062, and 272 cells for Y7, Y9, Y11, and Y13, respectively (Fig. 4D). In this embedding, the oxyphil-rich samples Y11 and Y13 are separated from Y7 and Y9. Samples Y11 and Y13 have higher levels of mitochondrial transcripts (e.g., COX4I1, MT-CO2) and lower levels of PTH than the chief cell–enriched Y7 and Y9. Unlike in the NHP tissue, GCM2 was not differentially expressed between groups of PTH+ cells in the hyperfunctioning PTs (Fig. 4E). To assess the correlation in gene expression between primary human samples, we pseudobulked the PT cells from each replicate and built gene–gene graphs based on their denoised and pseudobulked correlation within each sample and computed the correlation. We found low concordance (0.09–0.28) between samples (Supplemental Fig. S2).
To determine whether the scRNA-seq data from chief cell–enriched and oxyphil-enriched PT glands showed comparable gene expression differences to previously published bulk RNA data sets, we used pseudobulks from the scRNA-seq data on subsetted human PT cells from Y7 and Y9 as chief-rich samples and Y11 and Y13 as oxyphil-rich samples. Using DESeq2 to identify DEGs between oxyphil and chief cells, we filtered for those with log2 fold change > 2, adjusted P < 0.01 (Love et al. 2014). Our data showed low concordance with published data representing three oxyphil-rich and three chief-rich PT nodules (Supplemental Fig. S2; Mao et al. 2022). Of 20 genes with significantly higher expression in human chief cell–rich samples from our data, two genes (PIP5K1B, FLRT3) were consistent with the prior report, two were previously reported as down-regulated (ADIRF, CCDC153), and the remaining 16 were not reported as up- or down-regulated. These genes were not significantly enriched for any GO terms. Of 74 genes with higher expression in oxyphil-rich samples, two (ZFR2, MTRNR2L8) were consistent with the previous report, seven (GCLM, ARL5B, EIF2AK3, DUSP6, PPP1R15B, ST3GAL1, CRY1) were previously reported with lower expression in oxyphil-rich samples, and the remainder were not previously reported (Supplemental Table S5).
Comparison of human hyperfunctioning PT cells and NHP PT cells
We compared scRNA-seq data from NHP with that of human hyperfunctioning PTs. Mapping human hyperproliferative cells to primate normal PT cells is not trivial owing to species-specific and condition-specific variation. Furthermore, it is not a batch integration task; rather than integrate data sets into a combined representation, we aimed to map the human cells onto the primate embedding to characterize the biology of the hyperfunctioning PT cells with respect to normal tissue. We leveraged scMMGAN (Fig. 5A, i), which uses adversarial learning to combine data from multiple data sets for synthesizing information and direct comparison (Amodio et al. 2022). After scMMGAN mapping of cells based on similar gene expression across all genes (Fig. 5A, ii), we observed that the human cells mapped across the entire primate manifold (Fig. 5B). Visualizing the density of each patient sample individually, distinct patterns are apparent. The chief-rich samples Y7 and Y9 have the highest cell density near the middle of the pseudotime trajectory, whereas samples Y11 and Y13 with oxyphil predominance are more localized to the earlier portion of the trajectory.
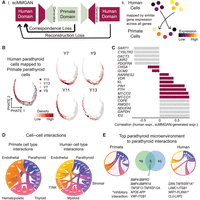
Comparison of human and primate PT cells. (A) Schematic of scMMGAN approach, which uses an adversarial framework to transform gene expression in the human data set to align to the primate manifold. (B) Human cells from each of four human samples mapped onto primate embedding. (C) Correlation of true human expression and scMMGAN-generated human expression for highest and lowest correlated genes, as well as key PT-relevant genes. (D) Predicted cell–cell interactions between cell types for NHP (left) and human (right) scRNA-seq. (E) Overlap of curated cell–cell interactions from PT microenvironment cell types to the PT cells between two species.
We validate the effectiveness of our mapping by visualizing the encoded NHP sample expression versus the mapped human expression across all ortholog-mapped genes after pseudobulking across time (Supplemental Fig. S7A). We also visualize gene dynamics for each human sample along the pseudotime axis after mapping (Supplemental Fig. S7B), highlighting consistency in gene trends for each sample. Additionally, we demonstrate the preservation of the human expression signature by comparing correlation before and after mapping from scMMGAN versus CycleGAN using 10-fold cross-validation (Supplemental Fig. S8; Zhu et al. 2017). scMMGAN shows consistently higher correlation than CycleGAN for each fold, for each sample, and on average. This shows that, across all genes, scMMGAN is preserving a consistent signature between NHP and human samples. However, not all genes showed a consistent signature between the two modalities. To interrogate concordant and discrepant genes between normal NHP and hyperfunctioning human PT samples, we utilized aggregate mapping and examined genes that showed discrepancy with the mapping, characterized by the correlation between the original expression and the mapped expression. In this way, we show both the most successful mapping and describe similarities and differences between the human and NHP samples. The human and NHP samples showed positive correlation for RARRES2, KL, VDR, PTH, and PIN1 and some mitochondrial genes (MT-CO1, MT-ATP6, MT-ND2, MT-ND3, MT-ND5). They showed poorer correlation for CHGA and GCM2 (Fig. 5C), consistent with the primary PT cells from normal NHP having a cluster of distinctly GCM2hi cells whereas the human hyperfunctioning PT cells did not.
We analyzed cell–cell interaction patterns within and across species. Performing a permutation test as described by CellPhoneDB using the OmniPath database of intercellular interactions, we identify many potentially interacting proteins between cell types (Fig. 5D; Supplemental Table S7; Türei et al. 2016; Efremova et al. 2020). The highest number of potential interactions for both the NHP and human samples was between endothelial cells and PT cells. We curated the OmniPath interactions (see Methods section) and focused on source–target interactions from the microenvironment cells to PT cells (Fig. 5E; Supplemental Table S7). This identified genes encoding 25 protein interactions in NHP samples and 54 interactions in human samples, with nine overlapping interactions. Two of the shared interactions involve the TNF pathway (TNFSF12 from endothelial cells and TNFRSF12A on PT cells), two involve BMPR signaling (BMP4 on nonepithelial cells and BMPR2 and/or BMPR1A on PT cells), and two involve ITGB1 potentially interacting with VWF or LAMC1. The remainder of the genes encoding potential receptors on PTH+ cells include APP, PLXNA1, and LRP2.
RARRES2 is abundantly expressed in primate PT cells and human hyperfunctioning PT cells (Supplemental Table S4). The relative expression of RARRES2 in the primate PHATE plot is shown in Figure 6A. In the NHP PT PHATE embedding, RARRES2 is enriched in gene cluster 5 (Fig. 3D,E), which increases throughout pseudotime. To confirm expression of the RARRES2 protein, we immunolabeled normal primate and hyperproliferative human PT tissue with antibodies targeting RARRES2 and PTH. RARRES2 was widely expressed in the cytoplasm of normal primate PTH+ cells, frequently colocalizing with PTH as determined by pixel-wise correlation and statistically testing colocalization masks against pixel-randomized images (Costes P = 1.00) (Fig. 6B). In human hyperproliferative PT, the RARRES2 protein was strongly expressed in a smaller percentage of cells than in NHP tissue, and localization was not correlated with PTH intensity (Pearson's R = –0.26) (Supplemental Fig. S11B).
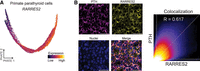
RARRES2 mRNA and protein are broadly expressed in PT cells. (A) RNA transcript distribution of RARRES2 in normal primate PT cells across scRNA-seq data sets. (B) Confocal micrograph immunolabeled with anti-PTH-, anti-RARRES2-, and DAPI-stained nuclei on slide from formalin-fixed paraffin-embedded normal primate PT tissue and pixel-wise colocalization heatmap of PTH and RARRES2 from a 21-slice Z-stack with 90 nm pixel size and 0.30 µm slice spacing. Scale bar, 30 µm. The vertical and horizontal lines indicate thresholds determined for each channel by Costes regression analysis, below which to not consider colocalization, and the diagonal line with slope 1.034 and Pearson's R = 0.617 indicates the best fit for pixels above thresholds in each channel.
Discussion
We performed scRNA-seq on normal primate and human hyperfunctioning PT tissues to provide the first single-cell transcriptomic atlas of primary PT glands. PHATE was used to generate embeddings of the data for visualization because it preserves both local and global nonlinear structure (see Supplemental Note S1). The lack of branching or otherwise distinct cell clustering suggests, but does not prove, that oxyphil and chief cells arise in a single maturation pathway. Additionally, unbiased assessment of RNA velocity through scVelo yielded a single trajectory beginning with GCM2hiPTHlo cells. Because GCM2 is necessary for PT organogenesis and maintenance throughout adulthood, these data reflect that GCM2hi cells represent the origin of the observed maturation axis (Liu et al. 2007; Yamada et al. 2019). Consistently, several other genes implicated in development of PTs (PAX1, PAX9, TBX1, SIX1, SIX4, EYA1, and GATA3) are expressed at high levels by a few cells near the GCM2hiPTHlo cells (Supplemental Fig. S3A; Su et al. 2001; Moore-Scott and Manley 2005; Grigorieva and Thakker 2011; Kearns et al. 2013). Genes known to be critical for mature PT regulatory function, such as PTH, CASR, and CHGA, are most highly expressed at the opposite extreme of the trajectory, further supporting the directionality of the axis. Analyzing and clustering gene expression by pseudotime kinetics showed the progression of GCM2hiPTHlo to PTHhiCHGAhiGATA3hi cells to mitochondria-rich PTH-expressing cells, consistent with an oxyphilic cell phenotype. The concept that PT oxyphil cells may be derived from chief cells has been based on known cytological associations of oxyphil predominance in the context of redox stressors, such as aging, chronic kidney disease, and calcimimetic treatments (Ritter et al. 2012; Basile and Lomonte 2017). Electron microscopy studies of short-term in vitro cultures of Mongolian gerbil PTs have shown that chief cells could be induced to an oxyphilic phenotype (Boquist 1975). Our results agree with prior work suggesting that oxyphil cells represent the terminal maturation phenotype of parathyrocytes.
Some mitochondrial transcripts (e.g., MT-CO1, MT-CO2) that have been associated with oxyphils from studies on adenomas are highest in the GCM2hi PTHlo portion of the continuum and decrease toward the GCM2lo PTHhi cells (Fig. 3B; Müller-Höcker et al. 2014). However, most key mitochondrial genes were enriched in gene cluster 5, which increases later in the continuum. Given the opposite patterns of these genes in normal NHP cells, we hypothesize that the continuum observed for COX1 and COX2 (human MT-CO1 and MT-CO2) may represent a signature unique to hyperfunctioning PTs rather than an oxyphil-specific signature.
Comparisons between normal NHP PT glands and hyperfunctioning human tissues revealed that hyperfunctioning PTs exhibit low overall gene expression correlations with one another and are further distinct from normal primate PTs. In contrast to normal primate PTs, the cells from human hyperfunctioning PT tissue showed relatively uniform GCM2 expression in oxyphil-enriched versus chief cell–enriched samples. Examination of development-associated genes reveals little pattern within the human data (Supplemental Fig. S3B). Analysis of pseudobulk data from these samples compared with previous bulk RNA sequencing revealed minimal DEG agreement, which could be a result of general disorder underlying the pathology of the primary samples obtained. Mapping human samples onto NHP data further illustrated the transcriptional noise of cells from hyperfunctioning tissue relative to normal homeostasis, underscoring the importance of studying normal tissue to provide insight into PT cell biology.
Predicted cell–cell communication analysis revealed several avenues for future investigation. Top microenvironment-to-PT interactions shared between NHP and human PTs highlighted genes with known impact on migration during PT development, such as BMP4 acting on BMPR2 and BMPR1A (Gordon et al. 2010). An interaction between VWF from endothelial cells to ITGB1 in PT cells was predicted for both NHP and human cells, and endothelial cells were predicted to have most interactions with PT cells, alluding to a supportive role between endothelial cells and PT cells. An interaction between NRP1 and PLXNA1 has been linked to Sema3a signaling to form lymphatic valves (Bouvrée et al. 2012). SEMA3D, a secreted glycoprotein, is known to be important during PT development (Singh et al. 2019). Further studies on these interactions between PT cells are needed.
Our data showed that RARRES2 is highly expressed in PTH+ cells, consistent with a recent transcriptional analysis of hyperfunctioning PT cells (Lu et al. 2023). We confirmed that RARRES2 is nearly ubiquitous in normal NHP PTH+ cells by immunofluorescence microscopy. The observation that this gene is highly expressed in two different species and in both diseased and normal tissue suggests that RARRES2 plays a key role in PT glands, either metabolically or potentially as part of the secretory pathway. Rarres2 knockout mice exhibit impaired insulin secretion mediated in part through MAFA (Takahashi et al. 2011). Although MAFA has not been identified as an important factor in PT function, the lack of MAFB has been associated with extremely low levels of PTH expression and secretion and failure of PT progenitors to migrate from the thymus during development (Kamitani-Kawamoto et al. 2011). RARRES2 could be acting through MAFB to potentiate PTH secretion in a manner similar to insulin in pancreatic cells, although further research is needed to elucidate this mechanism.
A limitation to this study is the lack of availability of primary human normal PT tissue that could be rapidly processed for scRNA-seq. Although tissue from autopsy was not available for this study, it could potentially be used if the postmortem time to tissue collection were short enough to avoid transcriptomic artifacts generated by RNA degradation. With this limitation, we cannot conclude that the patterns and differences we report between the human and NHP samples are effects of interspecies variability or normal versus hyperfunctioning cell behavior. Additionally, sex-specific transcriptomic differences could not be assessed in this work. Nonetheless, our analysis of normal NHP cells yielded insight into cell-state relationships in adult PT glands and the transcriptome of potential repopulating progenitors within adult PTs, which may reflect human cell population heterogeneity based on histological evaluation.
Methods
Tissue acquisition and preparation
Species, sex, medications, age of subjects, cell composition of PTs, and analyses performed on each sample are summarized in Supplemental Table S8. Trachea blocks were obtained from M. mulatta animals aged 6–28 years following humane euthanasia for unrelated studies. PTs were dissected from trachea blocks with infrared fluorescence guidance using a dissection microscope (American Optical) outfitted with a 720 nm LED light source (LED supply), a BP850 filter (Midwest Optics), and a Leica DFC420 camera (Paras et al. 2011). PTs were minced into <0.5 mm3 pieces and then dissociated in 1 mL of 1.5 mg/mL collagenase B (StemCell Technologies 07438) at 37°C with trituration by manual pipetting every 15 min until adequate cell quantities were obtained (<45 min total digestion time). Overall tissue processing to cDNA library generation occurred within 3 h of euthanasia for all animal specimens. Human PT tissue was further dissociated with a brief gentleMACS treatment (mouse spleen program 1). The digestate was then passed through a 100 µm cell strainer, rinsed with 4 mL ice-cold RBC lysis buffer (155 mM NH4Cl, 10 mM KHCO3, 0.1 mM EDTA or BD Pharm Lyse solution from Becton Dickinson 555899), and pelleted by centrifugation at 200g for 3 min. Supernatant was discarded, and cells were resuspended again in 5 mL RBC lysis buffer, pelleted, and then resuspended in sterile PBS. Cells were counted, pelleted again, and then resuspended at a concentration of 1 × 10⁶ cells/mL in sterile PBS containing 0.1% BSA in preparation for downstream processing.
Human samples included in this work were identified in cases of primary hyperparathyroidism with clinically and serologically proven hyperfunctioning solitary enlarged glands. The collection and use of human tissue was performed in compliance with the Declaration of Helsinki, with signed informed consent under a university institutional review board–approved protocol.
Single-cell RNA sequencing
Cell suspensions were processed for scRNA-seq according to the manufacturer's instructions using the 10x Genomics Next GEM single-cell 3′ V3.1 platform. Briefly, suspensions of 1 × 10⁶ cells/mL were loaded into 10x Genomics Chip B with partitioning oil and gel beads, and then GEMs were generated using the 10x Chromium Controller. The generation of cDNA libraries and subsequent indexing were performed following the manufacturer's instructions. Sequencing was performed on an Illumina NovaSeq. Primate samples were mapped to an updated index, which was generated with STAR using input of M. mulatta genome assembly MMul_10 (GCA_003339765.3) and Ensembl gene annotation v10.104 (Dobin et al. 2013). Each sequencing run was mapped against this index using Cellranger Count v. 6.0.1 and yielded 5775–10,407 cells sequenced per sample, with 13,000–48,000 mean reads per cell and 1155–2411 median genes detected per cell (Supplemental Table S1), yielding a data set composed of a total of 31,212 cells. Human hyperfunctioning PT samples were processed similarly but mapped to GRCh38 using Cellranger Count v. 6.01, yielding 1872–3501 cells per sample, with 33,000–180,000 mean reads per cell and 714–1525 median genes detected per cell.
Primate scRNA-seq processing pipeline
The primate libraries were further processed in Python using the scprep package (https://github.com/KrishnaswamyLab/scprep). Cells with fewer than 500 expressed genes and with a library size of fewer than 1000 unique molecular identifiers (UMIs) were removed. Mitochondrial expression was lightly filtered to maintain both the comparability of primate and human samples and the identity of mitochondrial-rich cells, removing only 18 cells from which >40% of transcripts were mitochondrial. Finally, rare genes (expressed in fewer than five cells) were removed.
After the above filtering steps, the distribution of PTH expression reflected contamination of ambient RNA. We employed DecontX with default parameters to remove contamination between cell types present in the tissue digestate (Yang et al. 2020). Notably, although contamination was present, it was not a prominent feature of the raw data, as evidenced by the contamination estimates from DecontX (Supplemental Table S6). After DecontX, the data were then normalized by library size to 1000 counts per cell, square root–transformed, and batch-mean-centered.
We then built an MNN cell–cell graph between primate samples to remove batch effect. We embedded the graph with PHATE to visualize the cells in two dimensions based on transcriptomic profiles, enabling comparison of local and global similarities between cells. This resulted in the visualization of distinct clusters, suggesting more than one cell type was present. Therefore, we clustered the cells with Leiden clustering at a resolution of 0.5. Then, for cluster characterization, we annotated the M. mulatta gene IDs with human orthologs using BioMart (Ensembl version 107) and subset to genes with human annotation. We then characterized a given cluster by identifying human-annotated genes with higher median expression versus the other clusters using a DESeq2 implementation in Python, accounting for each replicate as a covariate. Based on the top 100 human-annotated genes per cluster, we defined the cell types and subsetted to those which were defined as PT cells, characterized primarily by high PTH expression. We then rebuilt the MNN graph between primate samples for only PT cells and visualized this graph with PHATE. For this analysis, 22,174 PT cells were retained for downstream analysis. For GSEA, highly variable genes were selected for robustness, in accordance with best practices (Zhang et al. 2020; Heumos et al. 2023). Variability was computed as the deviation from a LOESS fit to the rolling median of the mean-variance curve using the scprep package (https://github.com/KrishnaswamyLab/scprep), in which highly variable genes were those with variability above a cutoff of 0.05. This resulted in 5132 total highly variable genes, representing the higher end of the common range to balance identifying genes that contribute strongly to cell-to-cell variation and preserving as much putative biology as possible (Luecken and Theis 2019). To test if this cutoff is robust, we performed gene set enrichment with four additional cutoffs (0.01, 0.025, 0.075, and 0.1), and we show that enriched GO terms are more likely to be identified at more than one cutoff (Supplemental Fig. S9).
Human scRNA-seq pipeline
We followed the same pipeline as above for the human samples for direct comparison, with the only exceptions being the following: (1) no batch-mean centering; as for the human samples, each batch is associated with a distinct phenotype, and this would remove differences; and (2) no need for annotation of genes with BioMart. As for the NHP samples, this included decontamination with DecontX for fair comparison, but contamination was again not a prominent aspect of the data, evidenced by low contamination estimates (Supplemental Table S6). We then mapped the human cells onto the primate manifold using scMMGAN. For this analysis, 2988 PT cells were retained for downstream analysis.
Computational methods
DecontX
Droplet-based microfluidic devices are widely used for scRNA-seq, but they can suffer from cross-contamination from ambient RNA in each droplet. Cross-contamination occurs when mRNA released in the cell suspension is incorporated into the droplets and is barcoded and amplified with the cell's native mRNA. A common indicator is when highly expressed cell type–specific genes are observed at low levels in other cell populations, which was reflected in our data set, with low levels of PTH in all measured cells.
DecontX addresses this issue via a Bayesian framework for estimating the percentage of cross-contamination within each cell (Yang et al. 2020). In this model, each cell is treated as a mixture of two multinomial distributions—one from the native transcript counts and one from contaminating transcript counts—and deconvolutes the original data to keep only the native counts. In this analysis, we utilized version 1.12.0 of DecontX.
MNN kernel
Merging information from different replicates for both primate samples and human samples is a necessary part of data analysis and interpretation. To do this, we used a MNN kernel to build a cell–cell graph, which contains cells from all replicates. This approach identifies cells with similar expression between different experimental replicates. Intuitively, if a pair of cells from each replicate is contained in each other's set of nearest neighbors, those cells are considered MNNs. These pairs are then interpreted as containing cells that belong to the same cell type or state, and any systemic difference in expression level is caused by batch effect.
Given the relatedness of the replicates and human samples, we assume that each replicate contains at least one shared population with another replicate, the batch effect is almost orthogonal to the biological subspace, and the batch effect is much smaller than the biological variation between cell states. Together, this motivates and enables performing MNN-based batch integration.
PHATE
We utilized PHATE (v.1.0.11) to dimensionally reduce and visualize cells. PHATE captures local and global nonlinear geometry by applying a diffusion framework popularized by diffusion maps, which define a random walk on the cell–cell graph through state transition probabilities, termed diffusion probabilities. That is, two points with multiple short paths between them have a higher diffusion probability than two points with long walks, or few walks, connecting them. This paradigm has been shown to capture multiscale structure but typically encodes such information in multiple dimensions. PHATE extends this framework for visualization by squeezing variation into two or three dimensions.
Pseudotime
Pseudotime was calculated from the same diffusion map that was used by PHATE (Coifman and Lafon 2006). Diffusion maps have previously been used for inferring trajectory structure from scRNA-seq data, and given that PHATE reveals one major axis of variation, the first diffusion eigenvector captures the major cellular trajectory (Haghverdi et al. 2016). The first diffusion eigenvector is equivalent to the first nontrivial eigenvector of the graph Laplacian, also known as the Fiedler vector. In computer science, the Fiedler vector has shown great utility for graph partitioning and pseudotime-related analyses, in which nodes are ordered based on the Fiedler vector value (Ding et al. 2001; Ding and He 2004). Splicing kinetics to infer pseudotime directionality were performed using scVelo (v. 0.2.5) (Bergen et al. 2020).
Leiden clustering
For global clustering of the major cell types comprising the PT tissue, we leveraged Leiden clustering, a faster and more precise version of the Louvain algorithm. The Louvain algorithm detects communities as groups of cells that have more links between them than expected and recursively coarse-grains communities. Both Louvain and Leiden have seen wide application to biological networks and scRNA-seq.
Gene clustering
Within the PT cell type, we did not perform cell clustering because there was no reason to assume modular, community-like structure in the graph; the boundaries between PT cell states are less clear than between tissue-level cell types. As such, we clustered the genes based on distinct trends of expression over the time axis with k-means clustering of their rolling trend. This approach has been used in related work on investigating and characterizing expression dynamics over single-cell axes (van Dijk et al. 2018; Tong et al. 2023).
Importantly, these relationships are nonlinear, meaning we can capture clusters of genes that first increase and then decrease in expression over time, as well as subtle monotonic changes such as when and how the gene expression increases. Such clustering also smooths over noise by capturing the salient shape and timing of the genes in each cluster.
scMMGAN
To map the human samples onto the characterized primate embedding, we leveraged scMMGAN, a neural network that takes data from one modality or setting (e.g., human samples) and generates a representation of that data in another modality (e.g., primate samples). Unlike MNN-based batch integration, scMMGAN allows us to map the human cells without deforming the primate manifold to match human.
scMMGAN uses a generative adversarial network (GAN) architecture for domain adaptation, in which the model is trained to preserve relationships between data points and ensure the original data can be reconstructed from the generated output.
The full model architecture is provided in detail by Amodio et al. (2022) In summary, scMMGAN is composed of three main losses: first, the GAN loss, which optimizes a minimax objective. This trains the generator to generate samples that closely match the target distribution, such that the discriminator cannot distinguish between the generated and target distributions:
Second, the cycle consistency loss ensures the generators can reconstruct a point after it moves to the target domain and back. This also ensures the discriminators are not able to distinguish batches of true and mapped points:
Between these two losses, the model architecture is able to align two data manifolds at the distribution level. However, scMMGAN adds an additional loss, termed the correspondence loss, which imposes a constraint on a single point's representation in domain i and domain j.
In this work, scMMGAN was run on density-subsampled points to ensure fair performance across cells at all points of the progression. The correspondence loss is the sum of the Pearson's correlation for each cell between the input data and the generated mapping and the Pearson's correlation for each gene between the input data and the generated mapping.
Each generator and discriminator are composed of three dense layers each, and the model is trained via Adam optimization with 15,000 steps, batch size of 128, learning rate of 0.0001, λcycle of five, and λcorrespondence of 10.
Performance was evaluated based on gene correlation between the original input distribution and the target distribution (Supplemental Fig. S8). We provide the gene correlation across all cells as well as resolved per human sample on test sets using 10-fold cross-validation, and we show consistently positive correlation across all samples. Notably, unlike other GANs, such as CycleGAN, the scMMGAN architecture is designed not only to map data from one domain to another but also to preserve as much of the original input distribution measurements as possible for a feasible and meaningful mapping. We highlight this point by comparing the scMMGAN results with CycleGAN results, and we show that scMMGAN consistently produces higher correlation than CycleGAN, which outputs gene correlations close to zero owing to the inability to preserve this information.
Cell–cell communication
Cell–cell interactions were discovered using the permutation test implemented by Efremova et al. (2020). We searched for interactions to those found in the intercellular OmniPath database (squidpy v. 1.2.3), a comprehensive database that integrates prior interactions from multiple sources, and limited the putative list to those interactions with P-value < 0.05 after Bonferroni correction, as well as including those genes that are expressed in >0.1% of the interacting cell type. We describe this full list of interactions in Figure 5D and Supplemental Table S7. We then perform additional filtering steps to curate the list of interactions, namely, subsetting to interactions in which (1) the target gene was enriched in PT cells, (2) there was a consensus on the direction of the interaction, (3) the source or target gene had more than one reference, and (4) the source or the target was plasma membrane, transmembrane, or secreted. We present this full list in Supplemental Table S7 and compare the overlap of interactions between NHP and human samples.
Pseudobulk and RNA-seq comparison
Pseudobulks were generated via ADPBulk from data subsets representing exclusively PT cells, that is, as in Figures 2E and 4E. PyDESeq2 (v. 0.4.1) was also used for differential expression analysis of pseudobulk data.
Bioinformatics analysis of scRNA-seq data
GCM2 target genes were identified from the ENCODE Project data set ENCSR407MOM, which is a Drosophila melanogaster GCM2-ChIP-seq data set, by exporting peaks and annotating with HOMER to Drosophila genome version dm6 (Heinz et al. 2010). Human orthologs for these data were identified by querying the FlyBase data set dmel_human_orthologs_disease_fb_2023_01, filtering for targets identified in the ENCODE data set, and using the ortholog for each gene that had the highest DIOPT score (Gramates et al. 2022).
GSEA was performed using ToppFun with default parameters (Chen et al. 2009). Gene set enrichments for transcription factor target genes were selected based on a Bonferroni-corrected P-value. Various gene sets from our data were enriched in several different reference data sets, including The Human Protein Atlas’ RNA Tissue Gene Data PT gland annotations (v22.0) (Uhlén et al. 2015; https://www.proteinatlas.org/download/rna_tissue_hpa.tsv.zip).
Immunofluorescence microscopy
For tissue sections, PT tissue was fixed overnight at room temperature in 4% paraformaldehyde and then transferred to 70% ethanol and processed to be embedded in paraffin. Sections of 5 micron thickness were deparaffinized in xylenes (3 × 5 min) and rehydrated in 100% ethanol (2 × 3 min), 95% ethanol (1 × 3 min), 70% ethanol (1 × 3 min), and water (1 × 3 min). Antigen retrieval was performed with a 10 mM citrate buffer solution (pH 6.0) containing 0.05% Tween 20 for 30 min in a steamer and then cooled for 20 min at room temperature. Sections were blocked for 1 h using 3% BSA in PBS and then incubated overnight at 4◦C with primary antibodies against PTH (Santa Cruz 57419) at 1:50, and Chemerin at 1:100 (GeneTex GTX32518) in humid conditions. Secondary antibodies conjugated to FITC (Abcam ab97050) or Alexa Fluor 647 (Invitrogen A21463) were added at 1:100 for 30 min at room temperature in humid conditions. Slides were then incubated with 0.1% Sudan black (Fisher BP109-10) in 70% ethanol for 3 min to quench autofluorescence and then rinsed in PBS. Specimens were mounted in Vectashield with DAPI (Vector H-1200) and coverslipped for microscopy. Imaging was performed using either a Leica Stellaris DIVE or Leica SP8 confocal system using a pixel size of 90 nm. Colocalization analysis was performed with an estimated point spread function of 3.0 pixels using the ImageJ Colocalization Threshold and Coloc2 plugins. Regions of interest with few autofluorescent granules were selected for colocalization analysis.
Data access
All raw and processed sequencing data generated in this study have been submitted to the NCBI Gene Expression Omnibus (GEO; https://www.ncbi.nlm.nih.gov/geo/) under accession number GSE233962. Code to generate all the above figures and tables is available as a Supplemental Code file, as well as on GitHub (https://github.com/KrishnaswamyLab/single-cell-parathyroid-atlas).
Competing interest statement
The authors declare no competing interests.
Acknowledgments
We acknowledge assistance with computational analysis from Kisung You, access to primary PT tissue from Lisa Halliday and Glenda Callender, use of a 10x Chromium Controller from Zachary D. Smith, the Yale Center for Genomic Analysis High Performance Computer supported by National Institutes of Health (NIH) grant 1S10OD030363-01A1, and the Yale Center for Cellular and Molecular Imaging for access to confocal microscope systems. A.V. is supported by the Gruber Foundation Science Fellowship. S.K. is supported by NIH grant nos. R01GM135929, R01GM130847, 1R21AI166387, and 1R01EY034234; National Science Foundation career grant no. 2047856; Chan-Zuckerberg initiative grants CZF2019-182702 and CZF2019-002440; and the Sloan Fellowship grant FG-2021-15883. D.S.K. and B.R.L. acknowledge support from Yale Stem Cell Center Chen Innovation award, NIH R21CA240660, and Women's Health Research at Yale.
Author contributions: D.S.K., M.J.C., B.R.L., A.V., and S.K. wrote the paper. D.S.K., M.J.C., and B.R.L. conceptualized the study. C.E.G., C.J.Z., and M.J.C. obtained and dissected PT samples. M.L.P. and C.J.Z. performed histologic analysis. M.J.C. and B.R.L. performed experiments. A.V., M.A., M.J.C, S.E.Y., and S.K. performed computational analysis. S.K. and D.S.K. analyzed data and oversaw the study.
Footnotes
-
[Supplemental material is available for this article.]
-
Article published online before print. Article, supplemental material, and publication date are at https://www.genome.org/cgi/doi/10.1101/gr.278215.123.
- Received July 1, 2023.
- Accepted June 3, 2024.
This article is distributed exclusively by Cold Spring Harbor Laboratory Press for the first six months after the full-issue publication date (see https://genome.cshlp.org/site/misc/terms.xhtml). After six months, it is available under a Creative Commons License (Attribution-NonCommercial 4.0 International), as described at http://creativecommons.org/licenses/by-nc/4.0/.


