
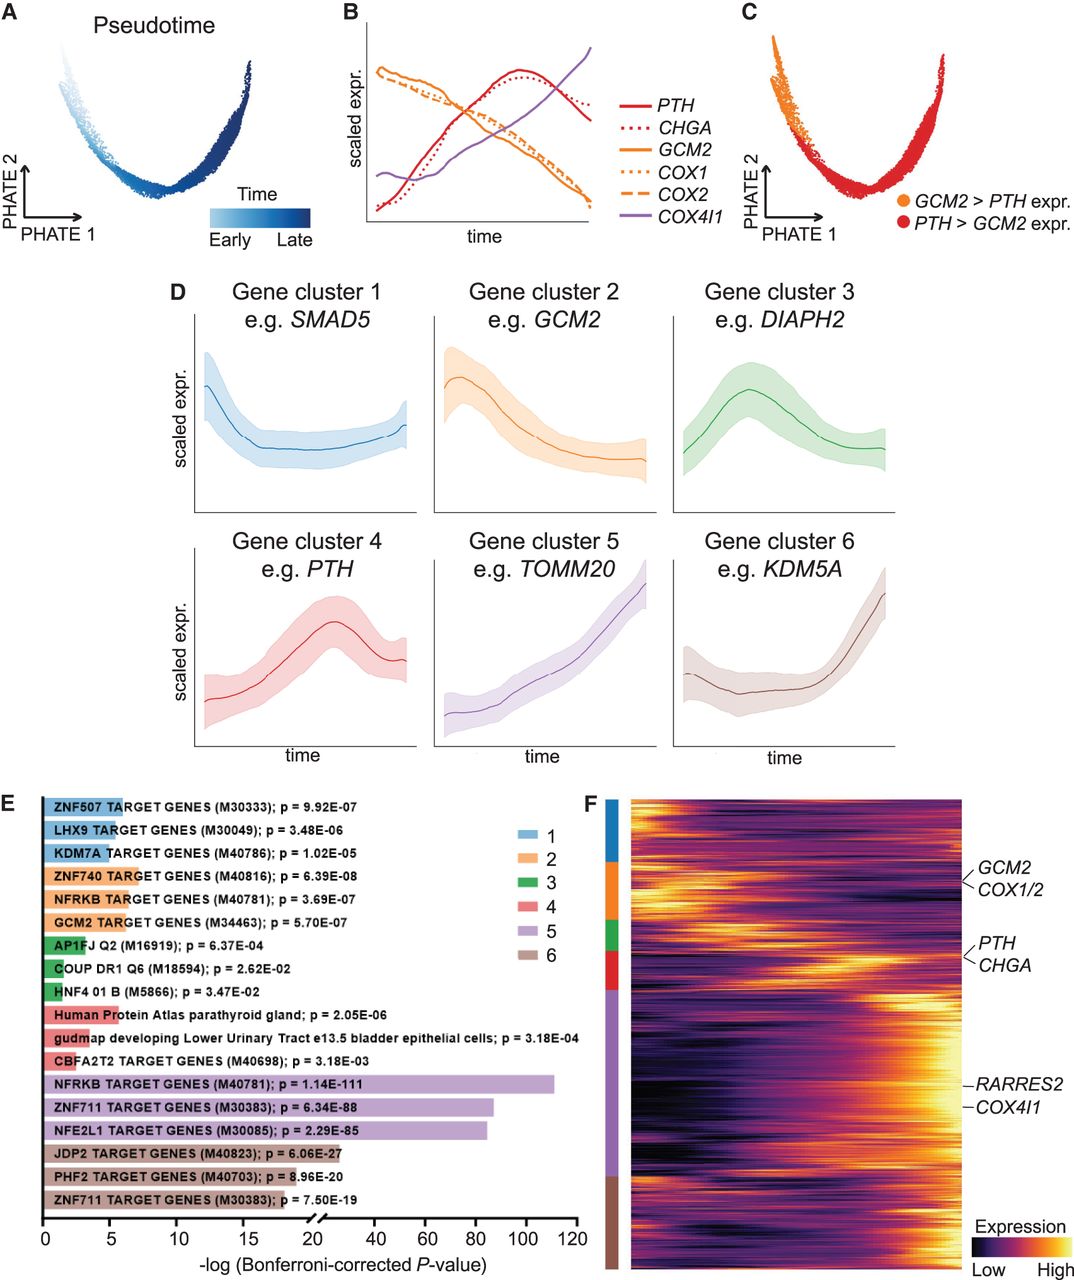
Expression dynamics of PT epithelial cells from adult NHPs. (A) PHATE embedding colored by computed pseudotime, progressing from left to right. (B) Z-Score normalized rolling average of expression of PT-relevant genes in cells along the pseudotime axis. (C) Orange cells, corresponding to the earliest part of the trajectory, denote higher scaled expression of GCM2 than PTH, and red cells have higher PTH than GCM2. (D) Gene trend clusters for all measured genes, in which the solid line corresponds to the mean Z-score normalized gene trend for all genes in a gene cluster, and the error bars correspond to 1 SD. (E) Bar chart of significantly enriched transcription factor binding site gene sets per gene cluster, their identifiers, and Bonferroni-corrected P-values. (F) Visualization of expression dynamics of each gene ordered by cluster (colors in E and F correspond to those of D).


