
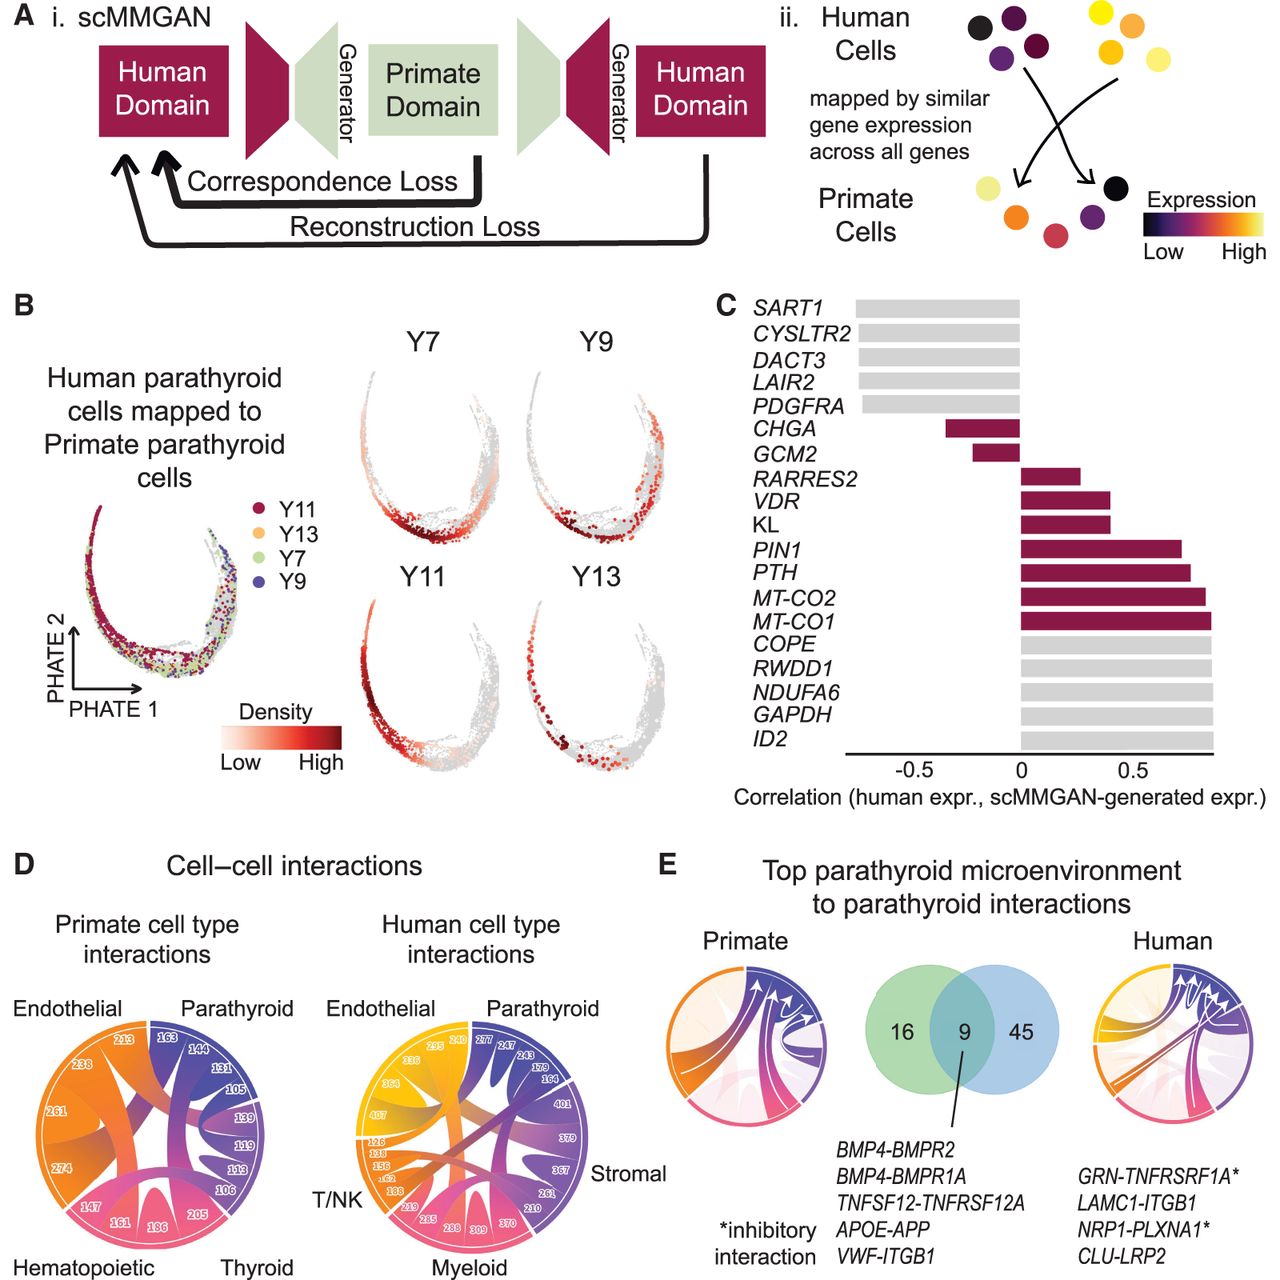
Figure 5.
Comparison of human and primate PT cells. (A) Schematic of scMMGAN approach, which uses an adversarial framework to transform gene expression in the human data set to align to the primate manifold. (B) Human cells from each of four human samples mapped onto primate embedding. (C) Correlation of true human expression and scMMGAN-generated human expression for highest and lowest correlated genes, as well as key PT-relevant genes. (D) Predicted cell–cell interactions between cell types for NHP (left) and human (right) scRNA-seq. (E) Overlap of curated cell–cell interactions from PT microenvironment cell types to the PT cells between two species.


