
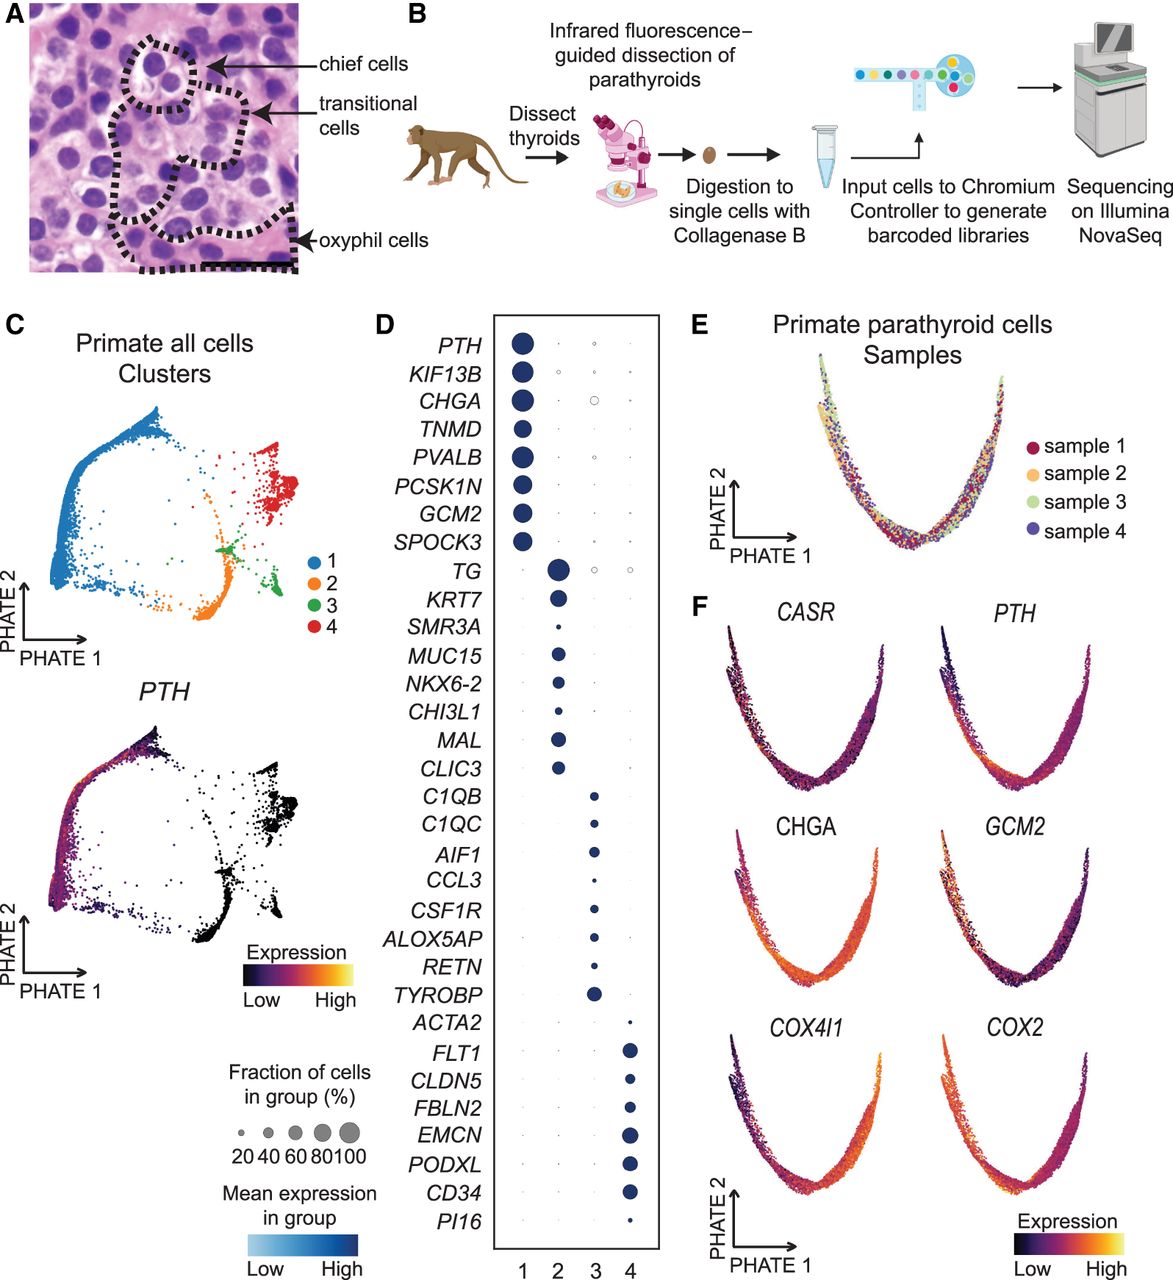
Figure 2.
Primate PT single-cell RNA sequencing. (A) Hematoxylin and eosin (H&E)–stained primate PT tissue (scale bar, 30 µm). (B) Schematic depicting workflow of tissue preparation to generate cDNA libraries. (C) PHATE embedding of filtered primate cells colored by cluster number for five clusters and PTH expression levels. (D) Dot plot representing the frequency and expression levels of the eight most differentially expressed genes between clusters for each cluster. (E) A subset from the original data set representing primate PT cells (cluster 1) was re-embedded with PHATE and colored by sample origin. (F) PHATE embeddings colored by expression level of PT-relevant genes in PHATE plots.


