
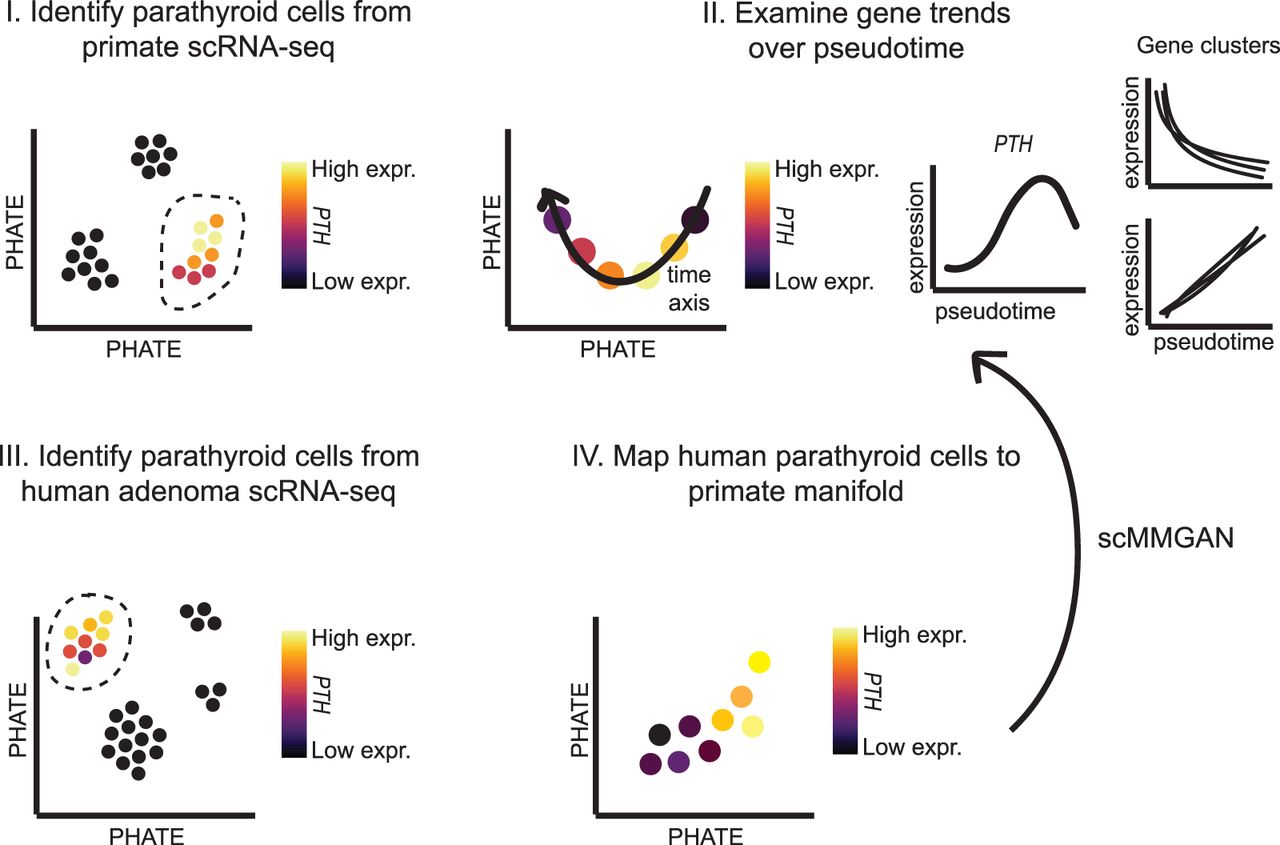
Figure 1.
Overview of the computational analysis pipeline. (I) Identify parathyroid (PT) cells from scRNA-seq of normal non-human primate samples by high PTH, GCM2, CASR, or CHGA expression. (II) Analyze PTH+ cells and characterize gene trends over pseudotime by gene-based clustering. (III) Identify PT cells from scRNA-seq of hyperfunctioning human PTs. (IV) Map human PT cells to primate manifold with scMMGAN, which generates a representation of human PTH+ cells in the primate space for direct comparison.


