
Suv39h-catalyzed H3K9me3 is critical for euchromatic genome organization and the maintenance of gene transcription
- Christine R. Keenan1,2,4,6,
- Hannah D. Coughlan1,2,4,
- Nadia Iannarella1,
- Andres Tapia del Fierro1,2,
- Andrew Keniry1,2,
- Timothy M. Johanson1,2,
- Wing Fuk Chan1,2,7,
- Alexandra L. Garnham1,2,
- Lachlan W. Whitehead1,2,
- Marnie E. Blewitt1,2,
- Gordon K. Smyth1,3,5 and
- Rhys S. Allan1,2,5
Abstract
H3K9me3-dependent heterochromatin is critical for the silencing of repeat-rich pericentromeric regions and also has key roles in repressing lineage-inappropriate protein-coding genes in differentiation and development. Here, we investigate the molecular consequences of heterochromatin loss in cells deficient in both SUV39H1 and SUV39H2 (Suv39DKO), the major mammalian histone methyltransferase enzymes that catalyze heterochromatic H3K9me3 deposition. We reveal a paradoxical repression of protein-coding genes in Suv39DKO cells, with these differentially expressed genes principally in euchromatic (Tn5-accessible, H3K4me3- and H3K27ac-marked) rather than heterochromatic (H3K9me3-marked) or polycomb (H3K27me3-marked) regions. Examination of the three-dimensional (3D) nucleome reveals that transcriptomic dysregulation occurs in euchromatic regions close to the nuclear periphery in 3D space. Moreover, this transcriptomic dysregulation is highly correlated with altered 3D genome organization in Suv39DKO cells. Together, our results suggest that the nuclear lamina-tethering of Suv39-dependent H3K9me3 domains provides an essential scaffold to support euchromatic genome organization and the maintenance of gene transcription for healthy cellular function.
Gene silencing in regions of heterochromatin is critical to cell identity and appropriate cell-fate decisions during development and differentiation (Yadav et al. 2018; Nicetto et al. 2019; Keenan 2021). Within all eukaryotic nuclei, heterochromatin and euchromatin are spatially segregated, with euchromatin typically located in the nuclear interior and heterochromatin at the nuclear periphery in large lamina-associated domains (LADs) often spanning several megabases in size (van Steensel and Belmont 2017). The mechanisms driving the formation of these distinct compartments have been unclear, but recent modeling suggests that biophysical attractions between heterochromatic regions, and not euchromatic regions, drives the phase separation of active and inactive domains, leading to the subsequent tethering of heterochromatic domains to the nuclear lamina (Falk et al. 2019).
In mammalian cells, the heterochromatin-associated mark H3K9me3 is deposited by the suppressor of variegation 3–9 homolog (SUV39H) enzymes SUV39H1 and SUV39H2. This H3K9me3 histone mark is then recognized by chromobox 5 (Cbx5; also known as heterochromatin protein 1 [HP1]) corepressor reader molecules that self-oligomerize to impart gene silencing and facilitate the tethering of heterochromatin domains to the nuclear lamina (Bannister et al. 2001; Lachner et al. 2001; Towbin et al. 2012). H3K9me3-dependent heterochromatin is critical for the silencing of repeat-rich pericentromeric regions (Bulut-Karslioglu et al. 2014) and also has key roles in repressing lineage-inappropriate genes (Allan et al. 2012; Liu et al. 2015; Nicetto et al. 2019) and impeding the binding of diverse transcription factors (TFs) and RNA polymerase, unlike H3K27me3-marked domains (Becker et al. 2016, 2017).
Loss of heterochromatin has been proposed as a potential universal molecular cause of aging, whereby over time, heterochromatin domains lose integrity, leading to derepression of silenced genes and thus aberrant expression patterns and cellular dysfunction (Villeponteau 1997; Tsurumi and Li 2012). Loss of function of the immune system is a key feature of aging whereby elderly individuals become less responsive to vaccination and more susceptible to a range of infections (Keenan and Allan 2019). Mice deficient in both Suv39h1 and Suv39h2 enzymes (Suv39DKO) do not survive embryonic development on a pure C57Bl/6 background (Keenan et al. 2020), unlike those on a mixed background, in which some developmentally defective mice can survive to birth at submendelian ratios (Peters et al. 2001). We have recently developed a chimeric model in which we can reconstitute the entire hematopoietic compartment of donor mice with Suv39DKO donor stem cells to examine the premature aging of the Suv39DKO immune system (Keenan et al. 2020), providing us now with an opportunity to elucidate the molecular mechanisms of cellular dysfunction following heterochromatin loss. We here aim to investigate the molecular consequences of loss of heterochromatin in Suv39DKO primary immune cells by performing comprehensive transcriptomic and epigenomic analyses, including examination of the three-dimensional (3D) nucleome through Lamin B1 ChIP-seq and in situ Hi-C.
Results
Loss of Suv39-dependent H3K9me3 results in paradoxical gene repression
To investigate the molecular consequences of heterochromatin loss, we performed RNA-seq on Suv39DKO and littermate control CD4+ CD8+ double-positive (DP) thymocytes (Supplemental Fig. S1), an abundant primary immune cell type that we have previously shown to be >95% reduced in global H3K9me3 levels in the absence of both SUV39H enzymes (Keenan et al. 2020). Paradoxically, we identified a predominant down-regulation of gene expression, with 78% of differentially expressed (DE) genes showing a negative logFC (Fig. 1A; Supplemental Table 2). As expected, both Suv39h1 and Suv39h2 were included in these DEs (Supplemental Fig. S2; Supplemental Table 2).
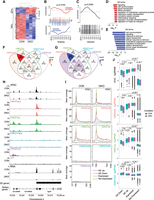
Suv39-dependent H3K9me3 loss causes predominant gene repression in euchromatic regions. (A) Heatmap showing change of expression (logRPKM) of differentially expressed (DE) genes between Suv39h1 and Suv39h2 double-knockout (DKO) and control cells. The proportions of genes down-regulated and up-regulated in Suv39DKO cells versus control are annotated. (B) Barcode enrichment plot showing ranking of aging-related genes from the GenAge database (de Magalhaes et al. 2009) among the DE genes. Genes are ranked right to left from most up-regulated to most down-regulated in DKO cells. The rank of genes associated with increased lifespan is marked by red vertical bars and that of genes associated with decreased lifespan by blue vertical bars. Red and blue worms show relative enrichment. ROAST gene set test P-values tests correlation. (C) Same as D but with directionality removed to include genes with contradictory annotated life span effects. (D,E) Gene Ontology (GO) enrichment in up-regulated (D) and down-regulated (E) DE genes. (F,G) quantification of overlap between up-regulated (F) and down-regulated (G) DE gene promoters (2 kbp upstream/500 bp downstream) and H3K4me3, H3K27ac, H3K27me3, and H3K9me3 ChIP-seq peaks from control DP thymocytes as called by HOMER. (H) Example tracks of the region surrounding the promoter of a down-regulated DE gene (Itga4) showing ATAC-seq, ChIP-seq (H3K4me3, H3K27ac, H3K27me3, H3K9me3, IgG), and RNA-seq data. (I) Plots of mean coverage from 3 kb upstream of the transcription start site (TSS) to 3 kb downstream of the transcription end site (TES) of up-regulated (DE Up), down-regulated (DE Down), and non-DE (divided into expressed and nonexpressed genes based on expression level in control cells) showing chromatin accessibility (ATAC) and H3K4me3, H3K27ac, H3K27me3, H3K9me3 H3K27ac, H3K9me3 ChIP-seq data. (J) Boxplots of ATAC, H3K4me3, H3K27ac, and H3K27me3 logRPKM across gene promoters (2 kbp upstream/500 bp downstream) that are up-regulated (DE Up), down-regulated (DE Down), and non-DE (divided into expressed and nonexpressed genes based on expression level in control cells). Box plots depict the interquartile range (IQR) ± 1.5 × IQR with median annotated. Distributions were compared by Wilcoxon test.
Given heterochromatin loss has been linked to premature aging in studies by us (Keenan et al. 2020) and others (Larson et al. 2012; Zhang et al. 2015), we performed gene-set enrichment analysis on aging-related genes from the GenAge Database (de Magalhães et al. 2009). We noted many aging-related genes have duplicated entries with conflicting effect annotations (i.e., annotated to both increase and decrease lifespan). Using only genes with unique annotation, we found a positive correlation (P = 0.0165) between the aging signature and the DE genes, suggesting genes that increase lifespan tend to be up-regulated in the DKO, whereas those that decrease lifespan tend to be down-regulated. However, examination of the resultant barcode plot (Fig. 1B) reveals this correlation is predominantly driven by down-regulated genes. When we include all aging-related genes (to include those genes with contradictory annotated life span effects), we find a similar enrichment in down-regulated genes (Fig. 1C).
To investigate whether the gene regulation observed in the Suv39DKO was a result of secondary effects such as through the dysregulated expression of particular TFs, we performed TF binding motif analysis. However, we found no statistically significantly (P < 0.05) enriched motifs in either our up- or down-regulated gene sets. We next performed Gene Ontology (GO) analysis, revealing many statistically enriched pathways for both up-regulated (Fig. 1D) and down-regulated genes (Fig. 1E). We noted that these pathways appear to be general cellular processes rather than aging-related, chromatin-related, or immune-system specific processes, suggesting that the gene regulation is not a result of disruption of a particular cellular pathway.
Genes regulated by Suv39-dependent H3K9me3 loss lie in euchromatic regions, despite reduced LADs
We were intrigued by the predominant down-regulation of genes following the loss of Suv39-dependent H3K9me3 so we next performed ChIP-seq against various histone modifications associated with both active (H3K4me3, H3K27ac) and repressive (H3K9me3, H3K27me3) regions, first confirming antibody specificity of the particular lots used by histone peptide array (Supplemental Fig. S3). Of note, H3K9me3 ChIP-seq was unable to be performed on Suv39DKO DP thymocytes owing to the lack of detectable H3K9me3 in these cells (Keenan et al. 2020). Remarkably, relatively few DE gene promoters (defined in 2 kp upstream of to 500 bp downstream from the transcription start site [TSS]) were marked by H3K9me3 (<25%), with the vast majority (∼85%) of DE genes marked by either the active marks H3K27ac and/or H3K4me3, regardless of whether genes are up-regulated (Fig. 1F; Supplemental Fig. S4A) or down-regulated (Fig. 1G; Supplemental Fig. S4B). Of note, both up- and down-regulated genes show lower levels of active marks (H3K27ac and H3K4me3) and higher levels of repressive marks (H3K27me3 and H3K9me3) at gene promoters compared with non-DE-expressed genes in control cells (Fig. 1H–J; Supplemental Fig. S5). Unsurprisingly, down-regulated genes show a reduction in active marks (H3K4me3 and H3K27ac) and an increase in the repressive mark H3K27me3, and conversely, up-regulated genes show the opposite (Fig. 1H–J). We next performed ATAC-seq to assess chromatin accessibility in control and Suv39DKO DP thymocytes and similarly found DE genes to predominantly lie in accessible regions, with accessibility significantly increased at the promoter of up-regulated genes and decreased at the promoter of down-regulated genes in the Suv39DKO (Fig. 1H–J). Taken together, these results suggest the loss of Suv39-dependent H3K9me3, the classical mark of heterochromatin, is affecting gene expression in euchromatic regions.
Given the role of the SUV39H-H3K9me3 pathway in facilitating association of heterochromatic domains with the nuclear periphery, we next performed Lamin B1 ChIP-seq on control and Suv39DKO DP thymocytes. As expected, the Lamin B1 signal was highly concordant with that of H3K9me3 in control cells (Fig. 2A) and was discordant with accessible, H3K27ac-, H3K4me3-enriched regions (Fig. 2A). Using the enriched domain detector (EDD) algorithm (Lund et al. 2014) specifically developed for Lamin ChIP-seq to call LADs, we found a reduced number of LADs in DKO cells (Fig. 2B; Supplemental Table 3), and those LADs that were retained were significantly smaller in size compared with the control cells (Fig. 2C; Supplemental Table 3). Given the binary nature of the EDD analysis in calling LADs, we also identified LADs using circular binary segmentation (CBS) to segment DNA with the DNAcopy package (Seshan and Olshen 2023) and the methods in LADetector (Harr et al. 2015; Luperchio et al. 2017). We used this method to assign a quantitative score that can be interpreted as LAD strength. Of note, we found a significant loss of LAD strength in the DKO cells using the CBS algorithm (Fig. 2D). We then classified LADs as disrupted if the LAD score was reduced by at least 0.1 (based on the standard deviation of control LAD scores) in the DKO compared with the control (Fig. 2A,E,F). We found a high level of concordance between the EDD and CBS approaches, with ∼78% overlap between the LADs lost from the EDD method (i.e., called as a LAD in control cells but not called as a LAD in DKO cells) and the disrupted LADs from the CBS method. Disrupted LADs were enriched for both repressive (H3K9me3/H3K27me3) and active marks (H3K4me3/H3K27ac) compared with nondisrupted LADs, and LAD/inter-LAD (iLAD) boundaries showed an expected enrichment for H3K9me3 in LAD regions, as well as depletion of H3K27ac/H3K4me3 and reduced chromatin accessibility (Fig. 2E,F). Of note, disrupted LADs showed higher levels of histone marks (both active and repressive) across LAD boundaries compared with nondisrupted LADs (Fig. 2E).
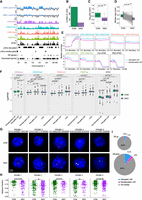
Suv39DKO reduces lamina-associated domains (LADs) without inducing gene activation. (A) Example tracks of Lamin B1 ChIP-seq from control and Suv39DKO DP thymocytes overlayed with H3K9me3, H3K27me3, H3K4me3, and H3K27ac ChIP-seq and ATAC-seq from control DP thymocytes. Disrupted LADs, not-disrupted LADS, DE genes, and expressed genes are also annotated. LADs are divided into LADs lost in DKO and LADs retained or gained. Lamin B1 ChIP-seq tracks are shown at 50-kb resolution, and all other tracks are shown at 10-kb resolution. (B) Number of LADs called by the enriched domain detector across all chromosomes in control and Suv39DKO DP thymocytes. (C) Distributions of LAD size from B in control and Suv39DKO DP thymocytes. Box plot depicts the IQR ± 1.5 × IQR and median annotated. Distributions were compared by Wilcoxon rank-sum test with continuity correction. (D) LAD strength score (seg.mean) from CBS algorithm in control and Suv39DKO DP thymocytes. Control and DKO scores were compared using a paired t-test. (E) Median coverage of H3K9me3, H3K27me3, H3K4me3, H3K27ac, and ATAC across LAD boundaries from CBS analysis showing disrupted LADs and nondisrupted LADs. (F) Distributions of H3K9me3, H3K27me3, H3K4me3, H3K27ac, and ATAC logRPKM in disrupted LADs (CBS score reduced by >0.1 in DKO vs. CON), not-disrupted LADs, and inter-LAD (iLAD) regions. Distributions are shown as box plots depicting the IQR ± 1.5 × IQR with median annotated. Distributions were compared by Wilcoxon rank-sum test with continuity correction. (G) DNA-FISH against LAD or iLAD loci in control and Suv39DKO DP thymocytes. (H) Quantification of G showing three-dimensional radial position of FISH foci between nuclear periphery (=1.0) and center of the nucleus (=0.0). (I) Proportion of DE genes between Suv39DKO and control cells that overlap disrupted LADs and nondisrupted LADs.
We further validated our Lamin B1 ChIP-seq results by performing DNA-FISH on control and Suv39DKO primary DP thymocytes. As expected, probes against loci predicted to be lamina-associated in control cells (probes 1, 3, and 5) (Supplemental Fig. S6) showed a higher distance fraction than those predicted to be non-lamina-associated (probes 2 and 4) (Fig. 2G,H; Supplemental Fig. S6). Moreover, probes that target loci in disrupted LADs (probes 1, 3, and 5) showed a significant radial shift from the periphery to the nuclear interior, whereas the non-lamina-associated probes were not significantly shifted in radial position in the DKO (Fig. 2G,H; Supplemental Fig. S6).
Finally, we explored whether DE genes lie in regions of LAD disruption and observed the vast majority of both up-regulated and down-regulated genes are in iLAD regions (Fig. 2I). Given the canonical role of Suv39-dependent H3K9me3 in gene silencing, we were surprised to find that a greater proportion of down-regulated genes in LAD-disrupted regions compared with up-regulated genes (Fig. 2I).
Heterochromatin loss causes switching of active to repressive compartments
To investigate how other forms of genome organization other than lamina-association were altered following the loss of heterochromatin, we performed in situ Hi–C on Suv39DKO and control DP thymocytes. We obtained high-quality libraries of about 120 million read pairs per biological replicate (after filtering) with two independent replicates per condition (Supplemental Fig. S7; Supplemental Table 1). First, we examined the large-scale genomic compartments of the interaction space comprising the euchromatic, gene-dense, so-called A compartment and the gene-poor, heterochromatic B compartment. We found a relatively large amount of compartment switching between the Suv39DKO and control DP thymocytes (∼1.5% of the genome) (Fig. 3A). However, despite the disruption of LADs in the Suv39DKO (Fig. 2A–C), most of this compartment switching was from an active A compartment in control cells to a repressive B compartment in the DKO (Fig. 3B). We found that no up-regulated DE genes fall in compartment-switched regions (Fig. 3C). However, a subset of down-regulated genes (7.5%) overlap compartment-switched regions, with all of these regions switching from A to B (Fig. 3C), consistent with the decrease in expression of these genes.
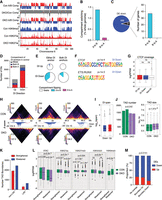
Heterochromatin loss causes a loss of chromatin interactivity in active regions and significant switching from active to repressive compartments. (A) Integrative Genomics Viewer (IGV) tracks of A/B compartments from Hi-C analysis of control and Suv39DKO DP thymocytes overlayed by H3K9me3 and H3K27ac ChIP-seq. (B) Proportion of genome that switches A/B compartments in Suv39DKO versus control cells (shown as a percentage of whole genome). (C) Overlap of down-regulated DE genes with compartment-switched regions. (D) Number of unclustered differential interactions (DIs) (FDR < 0.05) between Suv39DKO and control cells. Strengthened interactions (logFC > 0) are annotated as “up” and weakened (logFC < 0) as “down.” Overlap of the DI anchors with compartments A and B in control cells in shown. DIs in which both anchors are not contained in the same compartment or in which one or more anchor overlaps both compartments are annotated as “mixed.” (E) The proportion of DIs with anchors that overlap switched compartments. (F) Transcription factor (TF) binding motifs enriched in the anchors of DIs as determined by the HOMER pipeline. (G) CTCF ChIP-seq (Shih et al. 2012) coverage of the anchors of DIs versus the rest of the genome. Box plot depicts the IQR ± 1.5 × IQR and median annotated. Distributions were compared by Wilcoxon rank-sum test with continuity correction. (H) Hi-C contact matrices at 50-kbp resolution showing the top three DI regions between Suv39DKO and control cells. Color scale indicates the number of read bins per bin pair with visualization scaled to total library size to allow appropriate visual comparison. Unclustered DIs (FDR < 0.05) are shown as arcs (blue indicate a decrease in logFC, red an increase in logFC) in which the vertical axis is the −log10(P-value) of the DI. (I) The linear span between genomic anchors of strengthened (“up”) and weakened (“down”) DIs. Data shown as boxplot as in G. (J) Number and size of topologically associated domains (TADs) in each replicate sample of control and Suv39DKO cells. Data statistically compared by unpaired t-test with equal variance between the median of the TAD sizes and number of TADs. Boxplot for TAD size plotted as in G. (K) Number of TAD boundary changes between Suv39DKO and control cells divided into those overlapping LAD and non-LAD regions in control cells. (L) Density of ATAC, H3K27ac, H3K27me3, H3K27ac, H3K4me3, and H3K9me3 sequencing density (shown as logRPKM) of strengthened and weakened TAD boundaries in Suv39DKO and control cells. Data shown as boxplot as in G and compared by Wilcoxon rank-sum test with continuity correction. (M) Proportion of DE genes up-regulated versus down-regulated overlapping altered TAD boundaries and the rest of the genome. Data analyzed by chi-squared test.
Heterochromatin loss weakens genome organization in euchromatic regions, particularly in TAD boundaries
We next used the diffHic package (Lun and Smyth 2015) to identify discrete regions of altered three-dimensional genome organization between Suv39DKO and control cells. diffHic uses the statistical framework of the edgeR package (Robinson et al. 2010) to model biological variability and test for significant differences (termed differential interactions [DIs]). Using a resolution of 50 kb, we found more than 3000 DIs (FDR < 0.05) between Suv39DKO and control cells, with the majority of DIs identified as a weakening of structure (logFC < 0) rather than a gain of structure (Fig. 3D; Supplemental Table 4). We found that the majority of weakened DIs had both anchors (the physically interacting genomic regions mapped from the Hi-C read pairs) of the DI in the A compartment (Fig. 3D). Furthermore, a significant proportion of weakened DIs overlapped A-to-B compartment-switched regions even when only one DI anchor was in this region (Fig. 3E).
We next performed TF motif analysis in the anchors of the DI loops in order to identify putative regulators mediating these alterations in 3D genome organization. We found two motifs to be significantly enriched in weakened DI anchors, including that of CCCTC-binding factor (CTCF), the canonical regulator (together with cohesin complex) of chromatin architecture (Fig. 3F; Ong and Corces 2014; Rao et al. 2014; Tang et al. 2015). To explore whether CTCF occupancy affects which regions alter structure in the Suv39DKO, we overlayed downloaded publicly available CTCF ChIP-seq from DP thymocytes (Shih et al. 2012). However, we found no evidence that CTCF binding was enriched or depleted in structure altered in the Suv39DKO (Fig. 3G).
Visualization of our top differential interacting regions revealed that the altered structure in the Suv39DKO is of an impressive scale in the order of entire topologically associated domains (TADs) at 0.4–1 Mb size (Fig. 3H,I). We therefore next explored whether TAD structures are altered in the Suv39DKO using the TADbit package (Serra et al. 2017). We found slightly reduced TAD numbers in the DKO and a commensurate increase in average TAD size (Fig. 3J). To further explore the dynamics of TAD changes, we identified regions of changing contrast, that is, strengthening or weakening of TAD boundaries. The TAD caller TADbit uses a binary approach that cannot identify subtle changes in chromatin architecture such as the weakening of a boundary as opposed to its complete absence. Therefore, we used a different approach to identify regions where the TAD boundaries change in strength by adapting the statistical strategy recently described for differential methylation (Chen et al. 2017) and the diffHic package (Lun and Smyth 2015). This method directly assesses differential boundary strength relative to biological variation without needing to make TADs calls in individual samples. We first segmented the entire genome into 200-kb regions and then assessed whether the boundary strength at this region changed by assessing the contrast in upstream and downstream intensity. The ratio of upstream to downstream intensity in Suv39DKO and control cells was then compared using edgeR in a statistically robust manner. We found that TAD boundaries are more frequently weakened in the Suv39DKO regardless of whether the TADs are lamina-associated or not (in control cells) (Fig. 3K; Supplemental Table 5). Disruption of the TAD boundaries in the DKO was also associated with reduced H3K27me3 and H3K27ac histone marks and reduced chromatin accessibility, regardless of whether the TAD boundaries are strengthened or weakened in the DKO (Fig. 3L). Of note, 62% of DE genes fall in genomic regions where these TAD boundaries are modulated. Exploring the directionality of differential gene expression in relation to the strengthening or weakening of TAD boundaries, we found that genes that overlap weakened boundaries are more likely to be repressed compared with DE genes that overlap strengthened TAD boundaries or with DE genes that fall in other genomic loci (Fig. 3M).
Higher-order modeling of the 3D nucleome in Suv39DKO cells reveals heterochromatin loss affects the expression of genes positioned closer to the nuclear periphery in 3D space
We next explored whether higher-order chromatin organization was altered in Suv39DKO cells by assessing the clustering of noncontiguous TADs into so-called cliques (Paulsen et al. 2019). As has previously been reported in adipose progenitor cells, we could detect TAD cliques containing up to 11 interacting TADs in control DP thymocytes (Fig. 4A). However, in Suv39DKO cells, the detected TAD cliques near-uniformly-contained fewer interacting TADs (Fig. 4A,B). In contrast to what has previously been observed in adipose cells (Paulsen et al. 2019), the majority of TAD cliques were found in compartment A in our data from DP thymocytes (Fig. 4A,C). In the Suv39DKO, we saw a similar numerical reduction in the number of cliques from both compartments A and B (Fig. 4C). However, given cliques are predominantly in compartment A in control cells, those in compartment B were proportionally much more disrupted in the Suv39DKO (Fig. 4C).
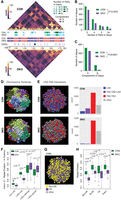
Higher-order modeling of the 3D nucleome in Suv39DKO cells reveals heterochromatin loss affects the expression of genes positioned closer to the nuclear periphery in 3D space. (A) Representative Hi-C contact matrices at 200-kbp resolution showing a loss of higher-order TAD–TAD cliques in Suv39DKO cells. Color scale indicates the number of read bins per bin pair with visualization scaled to total library size to allow appropriate visual comparison. A/B compartments are also annotated as are differentially expressed genes (DEGs; blue is down-regulated and red is up-regulated). (B) Number of higher-order TAD–TAD cliques detected in Suv39DKO and control cells. Data statistically compared by two-way ANOVA. (C) Number of higher-order TAD–TAD cliques in compartment A and compartment B in Suv39DKO and control cells. Proportion of cliques in each compartment data statistically compared by chi-squared test. (D,E) Representative Chrom3D modeling of the 3D nucleome of control and Suv39DKO cells colored as individual chromosome territories (each chromosome is arbitrarily colored; D) or higher-order TAD–TAD, TAD–TAD–LAD, or LAD interactions (E). (F) Measurements of LAD positioning from Chrom3D modeling in Suv39DKO and control cells. Box plot depicts the IQR ± 1.5 × IQR with median annotated from 100 independent modeling simulations from a separate seed value, with each simulation containing 5 million iterations. Distributions were compared by a Welch's unequal variances t-test. (G,H) Measurements of DE gene positioning from Chrom3D modeling as in F. Distributions were compared by a Welch's unequal variances t-test.
We next modeled the 3D nucleome of control and Suv39DKO cells using the computational platform Chrom3D (Paulsen et al. 2017, 2018). Chrom3D simulates the spatial position of chromosome domains as defined by TADs relative to each other from the Hi-C data and relative to the nuclear periphery from Lamin B1 ChIP-seq data. We produced 100 independent models for both control and Suv39DKO cells (for an example model for each cell type, see Fig. 4D). We examined higher-order structure of the chromosome domains, including LADs, TAD–TAD interactions, and TAD–TAD–LAD interactions, revealing a loss of TAD–TAD interactions (shown by an increase in “other” counts in the Suv39DKO), as well as a loss of TAD–TAD–LAD interactions from the nuclear periphery (Fig. 4E).
Quantification of the median position of domains with LAD interactions in each independent simulation of the control and Suv39DKO nucleome accords with our expectations showing LADs in control cells positioned closer to the nuclear periphery than non-LADs regardless of whether they are lost, retained, or gained in the Suv39DKO (Fig. 4F). Moreover, LADs lost in the Suv39DKO show a highly significant shift toward the nuclear interior (Fig. 4F). When we then overlayed our DE genes onto the Chrom3D models, we found that DE genes were positioned closer to the nuclear periphery compared with expressed non-DE genes (Fig. 4G,H), regardless of whether they were up- or down-regulated (Fig. 4H).
Altered 3D genome organization in LAD-proximal regions correlates with transcriptional regulation
We were intrigued by the mechanism by which these genes near the nuclear periphery were affected by the loss of heterochromatic structure. We hypothesized that the loss of LADs could be disrupting the 3D chromatin interactivity around nearby genes, thereby disrupting their expression. We therefore adapted our previously published gene-centric DI analysis (Chan et al. 2021) to explore this hypothesis. This approach calculates interaction counts between the promoters of coding genes and the rest of the genome in 15-kbp bins, filters these interaction counts using a distance-dependent approach, and then aggregates these counts for each gene. Gene-centric differential interactivity is then detected between samples using the quasi-likelihood (QL) framework of the edgeR package (Fig. 5A; Supplemental Fig. S8). We found that chromatin interactivity showed a similar pattern to transcriptional regulation (Fig. 1A), with interactivity at coding genes more frequently reduced in Suv39DKO cells (Fig. 5B; Supplemental Table 6). Similarly, interactivity around aging-associated genes showed a significant enrichment for weakened interactivity in this gene set (Fig. 5C), consistent with what we observed for gene expression (Fig. 1C). We next examined whether differential interactivity was related to proximity to the nuclear periphery. To do this, we divided the genome into bins based on the linear distance to the closest LAD (in control cells) and explored the differential interactivity (as LogFC between Suv39DKO and control) of genes within each bin. We found that genes on LADs show the largest loss of interactivity in Suv39DKO cells (although this gene number is relatively few), with proximal genes showing an intermediate loss of interactivity, with this effect being lost ∼3 Mb from the nearest LAD (Fig. 5D). Exploring the expression of all genes relative to adjacent LADs, we can similarly see RNA expression is diminished in the Suv39DKO within ∼3 Mb of an iLAD/LAD boundary when the LAD is disrupted, but it is unchanged when the LAD is retained (Fig. 5E). Of note, we found a significant correlation between the altered expression of genes in Suv39DKO cells and the altered interactivity of these genes (Fig. 5F), with interactivity predominantly lost and gene expression predominantly repressed (Fig. 5G). Together, these results suggests that the loss of lamina-associated heterochromatin could be disrupting euchromatic gene expression through a disruption of nearby 3D chromatin interactivity (Fig. 5H).
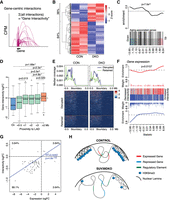
Altered euchromatic genome interactivity near LAD domains correlates with transcriptional dysregulation in Suv39DKO cells. (A) Schematic of gene-centric interactivity analysis. (B) Heatmap of the interactivity (log2CPM) of differentially interacting genes between Suv39DKO and control cells (FDR < 0.05). (C) Gene set enrichment analysis of genes with differential interactivity relative to aging-related genes from the GenAge database. Barcode enrichment plot shows the correlation of aging-related genes relative to differential interactivity. Genes are ordered on the plot from right to left (x-axis) from most increased in interactivity to most decreased in interactivity according to the moderated F-statistic. The P-value was calculated with the fry test. (D) The logFC of gene-centric interactivity for DE genes shown relative to linear genomic distance to the nearest LAD and statistically compared by Wilcoxon rank-sum test with continuity correction. (E) Coverage of RNA expression across iLAD/LAD boundaries with disrupted LADs in the Suv39DKO plotted separately from retained LADs. Summary plot shown as the median of the coverage. (F) Barcode enrichment plot showing the correlation of DE genes relative to differential interactivity. Genes are ordered on the plot from right to left (x-axis) from most up-regulated to most down-regulated according to the moderated F-statistic. The P-value was calculated with the fry test. (G) The logFC of gene-centric interactivity relative to logFC of transcriptional change for DE genes. (H) Schematic of putative mechanism by which the loss of heterochromatin causes transcriptional repression in euchromatic regions.
Discussion
We have here revealed that loss of Suv39-dependent H3K9me3 causes paradoxical gene repression, with DE genes principally in euchromatic regions rather than heterochromatic regions. We determined that DE genes are closer to the nuclear periphery and are highly correlated with altered 3D genome interactivity, which appears to be driven by the loss of lamina-association of Suv39DKO chromatin. Together, our results suggest that the nuclear lamina-tethering of Suv39-dependent H3K9me3 domains provides an essential scaffold to support euchromatic genome organization and the maintenance of gene transcription for healthy cellular function.
It is now well accepted that most genes within a genome are controlled by long-range cis-regulatory elements physically looping to interact with their target gene, even though these regulatory elements may lie many kilobases or megabases away (Sanyal et al. 2012; Dekker et al. 2013; Dixon et al. 2015). Our data showed a high level of concordance between differential gene expression and differential interactivity of that gene, suggesting either that gene expression per se is highly correlated to the interactivity of that gene with other genomic elements such as enhancers or other gene promoters or that the mechanism causing gene expression to alter similarly affects the interactivity around that gene. Given there are many complex regulatory mechanisms controlling the expression of individual genes, it seems implausible that chromatin interactivity could be the sole determinant of gene expression. Indeed, a study exploring cis-regulatory elements through ATAC-seq profiling has found that although the expression of most genes is dependent on long-range enhancers, a significant fraction is not, particularly for housekeeping and cell-cycle-related genes (Yoshida et al. 2019). Moreover, a study exploring chromatin interactivity and gene expression in T cell development found that only a subset of genes showed correlation between interactivity and expression, although these genes were deemed critical to the T cell development process (Hu et al. 2018). We therefore contend that the mechanism by which the loss of Suv39-dependent H3K9me3 causes altered transcription similarly affects the interactivity around that gene, especially given these differentially regulated genes are predominantly not marked by H3K9me3.
The temporal or causal relationship between chromatin interactivity and gene transcription has been challenging to untangle owing to the complex interdependency between the two processes. Some groups propose that genome reorganization often precedes gene expression changes (Stadhouders et al. 2018), whereas others propose that these interactions form concomitantly with gene expression (Oudelaar et al. 2020). Here, we propose that the structural alterations in chromatin organization caused by a disruption of LADs in the Suv39DKO are the driving force for the transcriptional change and are not a consequence of transcriptional alterations. Although we have not shown direct causality, we provide evidence that the magnitude of alteration of genome interactivity is inversely proportional to the proximity to a LAD, and we believe that this is readily explained by biophysical connectedness. It may be argued that we also show DE genes to be similarly proximal to the nuclear periphery through our modeling of the 3D nucleome. However, it is less obvious what mechanism would affect the transcription of nearby genes in the absence of an intermediate effect on genome organization. Increased levels of DNA damage may be a contributing factor (Nava et al. 2020). Indeed, we have previously shown that γH2AX levels are increased in bone marrow cells from Suv39DKO chimeric mice. However, it is not clear that DNA damage would result in the predominant down-regulation of gene expression we have observed in the absence of an intermediate effect on genome organization. Relocalization of CBX5 that has been liberated by the loss of H3K9me3 could also plausibly explain gene repression. However, in a previous study, we have shown CBX5 to be diffusely located throughout the nucleoplasm by immunofluorescence in Suv39DKO cells (Keenan and Allan 2019; Keenan et al. 2020) rather than adjacent to the nuclear periphery; therefore, we do not believe this mechanism can explain the phenomena observed. We explored the hypothesis that dysregulation of particular TFs may cause the altered gene transcriptional profile in the Suv39DKO given our laboratory and others have shown that TFs can alter both gene transcription and genome organization (Hu et al. 2018; Johanson et al. 2018; Stadhouders et al. 2018). However, we found no enriched TF motifs in the promoters of the DE genes. Therefore, we believe that the dysregulated gene expression we observe is not a result of secondary effects from TF dysregulation. Further, although we have previously shown that the primary DP thymocytes we investigate in this study develop normally (Keenan et al. 2020), there may be developmental defects that manifest from our previously observed hematopoietic stem cell dysfunction that contribute to the observed phenotypes.
Our findings here using our unique model of H3K9me3 loss in primary immune cells complement several recent papers in different models and systems. In particular, one study used mechanical stress to disrupt heterochromatin stability in skin epidermis stem/progenitor cells (Nava et al. 2020). The study also found a predominant down-regulation of gene expression, reduced lamina-association of heterochromatin domains, but was unable to find a correlation between H3K9me3-regulated regions and gene transcriptional changes (Nava et al. 2020). The vast majority of studies exploring H3K9me3-marked heterochromatin have been performed in mesenchymal cells, including mouse embryonic fibroblasts (MEFs) (Montavon et al. 2021; Fukuda et al. 2023), human mesenchymal progenitor cells (Liu et al. 2022), and the human BJ fibroblast cell line (Zhang et al. 2021). In these studies, loss of lamina association of chromatin was universally reported, as well as altered TAD boundaries and LAD/iLAD boundaries, consistent with what we have observed here in DP thymocytes and consistent with previous data suggesting that senescence of the IMR-90 lung fibroblast cell line affects the chromatin structure around LADs through the down-regulation of Lamin B1 (Shah et al. 2013). However, H3K27me3 appears to compensate for the loss of H3K9me3 in both mouse and human fibroblasts (Zhang et al. 2021; Fukuda et al. 2023), but we see minimal evidence of this in Suv39DKO DP thymocytes, suggesting cell type specificity in the epigenetic wiring of mechanisms of heterochromatin stability. Indeed, our in-house-generated Suv39DKO MEFs only show a reduction of H3K9me3 by 50%–60%, unlike DP thymocytes, which show >95% reduction, suggesting altered reliance on H3K9me3 methyltransferases in different cell types. A separate study examined the formation of senescence-associated heterochromatin foci (SAHF) in the oncogene-induced senescence of fibroblast cells, in which they found a gain of interactivity within 3 Mb of a newly formed heterochromatin domain (Sati et al. 2020). This perfectly complements our findings that genes within 3 Mb of LAD showed an overall decrease in interactivity compared with genes further away. Moreover, our conclusions are broadly complementary to the recent study suggesting heterochromatic regions drive the phase separation of active and inactive chromatin (Falk et al. 2019).
We have here revealed that down-regulated genes in the Suv39DKO are enriched for aging-associated roles, providing a new perspective on the potential molecular causes of cellular dysfunction in aging. This is not to suggest that a predominant down-regulation of genes occurs in physiological aging as we have seen here, as many studies have shown that different cell types and organisms do not show such a clear transcriptional effect but rather show an increased transcriptional variability (Bahar et al. 2006; Martinez-Jimenez et al. 2017). We instead contend that the molecular consequences of H3K9me3-marked heterochromatin loss are more complex than a simple derepression of silenced elements and that this transcriptional regulation in LAD-adjacent regions occurs with “physiological” heterochromatin instability, as is seen in aging; it was just hitherto unseen. Given we have focused on the transcriptional regulation of protein-coding genes, we do not know whether repetitive elements such as transposable elements have been activated as has been observed in other contexts (De Cecco et al. 2013a,b; Li et al. 2013; Wood et al. 2016). However, it is likely that multiple molecular mechanisms act in concert to result in the cellular dysfunction associated with aging. Through adding to our understanding of the molecular consequences of heterochromatin loss in different cell types, we hope intervention strategies may be designed to restore cellular function and prevent age-associated diseases.
Methods
Mice
Suv39h1 and Suv39h2 null mice (a generous gift from Thomas Jenuwein, Max Planck Institute) were backcrossed to the C57BL/6J strain on which background the Suv39 double-deficient (DKO) genotype was found to be embryonic-lethal (Keenan et al. 2020). We therefore used 8- to 12-wk-old chimeric mice for this study as previously described (Keenan et al. 2020). Briefly, chimeric mice were generated using Suv39h1 and Suv39h2 double-deficient (DKO) CD45.2+ fetal liver or bone marrow donor cells, which were injected into the tail vein of lethally irradiated (2 × 550 Gy) congenic (CD45.1+) recipient mice. These DKO cells are compared with littermate control cells (designated CON) of the Suv39h1+/ySuv39h2+/− genotype, as we used a mating strategy unable to produce wild-type cells to increase the frequency of the submendelian DKO genotype. Our previous studies have shown no defects in the development, function, or heterochromatin structure of Suv39h2−/− mice, making the Suv39h2+/− a reasonable surrogate for a true wild type. All mice were maintained at The Walter and Eliza Hall Institute animal facility under specific-pathogen-free conditions. All animal experiments were approved in advance by the Walter and Eliza Hall Institute animal ethics committee and conducted in accordance with published guidelines.
Flow cytometric sorting
Single-cell suspensions were generated from mouse thymus by mechanical homogenization following by red blood cell lysis (156 mM NH4Cl, 11.9 mM NaHCO3, 97 μM EDTA). Fluorochrome-conjugated antibodies against the following mouse antigens were then used for sorting by flow cytometry: CD45.2-FITC (clone 104) and CD19-PECy7 from BD Pharmingen and CD4-PE (clone GK1.5) and CD8α-APC (clone 53.6.7), which were generated internally. Surface staining was performed for 30 min at 4°C. Live (propidium iodide [Thermo Fisher Scientific] negative), CD45.2+CD19−CD4+CD8+ cells were sorted using a BD FACSAria cell sorter (Supplemental Fig. S1).
RNA-seq
RNA was extracted using an RNeasy plus mini kit (Qiagen) and quantified in a TapeStation 2200 using RNA ScreenTape (Agilent). Libraries for sequencing were prepared using the TruSeq RNA sample-preparation kit (Illumina) from 500 ng RNA, amplified with KAPA HiFi HotStart ReadyMix (Kapa Biosystems), size-selected to 200–400 bp, and cleaned up with AMPure XP magnetic beads (Beckman). Final libraries were quantified with TapeStation 2200 using D1000 ScreenTape for sequencing on the Illumina NextSeq 500 platform to produce 81-bp paired-end reads. Around 35 million read pairs were generated per sample.
All read pairs were aligned to the mouse genome, build mm10, using align from the Rsubread package (Liao et al. 2019) v1.24.0 in R (R Core Team 2023). Over 91% of all read pairs were successfully mapped for each sample. The number of read-pair-overlapping genes were summarized into counts using Rsubreads featureCounts (Liao et al. 2014). Of those successfully mapped, an average of 89% of these read pairs were assigned to a gene. Genes were identified using GENCODE annotation to the mm10 genome, version M22. Differential expression analyses were then undertaken using the limma (Ritchie et al. 2015) and edgeR (Robinson et al. 2010) software packages, versions 3.42.2 and 3.28.1, respectively.
Before analysis, all genes with no symbol, non-protein-coding, and Riken genes were removed. Expression-based filtering was also performed. All genes were required to achieve a count per million reads (CPM) greater than 0.4 in at least three samples to be retained. Following filtering 11,036 genes remained. Compositional differences between samples were then normalized using the trimmed mean of M-values (TMM) method (Robinson and Oshlack 2010). All counts were transformed to log2-CPM with associated precision weights using voom (Law et al. 2014). Differential expression between the knockout and wild-type samples was evaluated using linear models and robust empirical Bayes moderated t-statistics relative to a fold-change threshold of 1.2 (McCarthy and Smyth 2009; Phipson et al. 2016). P-values were adjusted to control the false-discovery rate (FDR) <5% using the Benjamini and Hochberg method.
Analyses of the GO terms (The Gene Ontology Consortium 2019) was performed using limma's goana function. Gene set testing of the aging signature and corresponding barcode plots were generated using limma's roast and barcodeplot functions. The aging signature was evaluated using both directional and nondirectional roast tests with 9999 rotations. The heatmap was generated using the pheatmap package available through CRAN.
Lamin B1 ChIP-seq
Cells (>5 M) for Lamin B1 ChIP-seq were fixed in 1% formaldehyde for 20 min at room temperature with mixing and then quenched by the addition of glycine to a final concentration of 125 mM. Fixed cells were washed twice with ice-cold PBS and then the cell membrane was lysed by incubation in ChIP buffer (150 mM NaCl, 50 mM Tris, 5 mM EDTA, 0.5% (v/v) NP-40, 1% (v/v) Triton X-100) containing 1× protease inhibitors (Roche) on ice for at least 10 min before Dounce homogenization. Chromatin within intact nuclei was then digested for 5 min with micrococcal nuclease (NEB M0247, 500 U/1 M cells) before nuclei lysis by Covaris sonication. Nuclear lysate was then cleared by centrifugation (>15,000g for 1 min); a small aliquot was taken as a whole-cell extract (WCE) control; and Lamin B1 antibody (Abcam ab16048, 3 μg) was added to the remaining cleared lysate and incubated overnight at 4°C with rotation. Immunoprecipitation was performed using Protein G Dynabeads (Thermo Fisher Scientific), and then chromatin was eluted from beads using elution buffer (1% (v/v) SDS, 0.1 M NaHCO3). ChIP and WCE samples were then adjusted to 200 mM NaCl, digested with RNase A (20 μg/sample) overnight at 65°C, and then digested with Proteinase K (20 μg/sample) for a further 1 h at 65°C. DNA was then extracted using a Zymo ChIP DNA clean and concentrator kit (D5205), and sequencing libraries were prepared using an Illumina TruSeq DNA sample prep kit using half volumes of all reagents. Libraries were sequenced on an Illumina NextSeq 500 to produce 81-base-length paired-end reads. Independent biological duplicates were prepared for each condition and sequenced to a depth of about 50 million reads.
Lamin B1 ChIP-seq processing and peak calling
Biological replicate FASTQ files were combined for ChIP and WCE samples. FASTQ files were aligned to the mouse genome (mm10) with Rsubread package v1.28 (Liao et al. 2019). BAM files were sorted with Rsamtools, and duplicate reads were removed with MarkDuplicates (Picard suite v1.117) (https://broadinstitute.github.io/picard/). WCE samples were down-sampled to the size of the corresponding ChIP libraries (about 53 million reads) using DownsampleSam from Picard tools with strategy chained and accuracy 0.001. For viewing and plotting, bedGraph files of the log of the ratio of the ChIP coverage to the WCE coverage were created with bamCoverage from deepTools (Ramírez et al. 2016) and R (R Core Team 2023). Tracks were visualized in IGV (Robinson et al. 2011). Enriched domain detector (EDD) (Lund et al. 2014) was used to call LADs on the control and DKO samples separately using the WCE as input for the corresponding ChIP. EDD was run 10 times without specifying the bin size and gap penalty. The mean of the estimated bin size and gap penalty from the 10 trials was used to call LADs (wild-type: gap penalty 4.79 and bin size 6 kbp; KO: gap penalty 9.1 and bin size 8 kbp). LADs called on the Y and scaffold chromosomes were excluded from subsequent analyses. LADs were also defined with methods based on circular binary segmentation (CBS) and LADetector (Harr et al. 2015; Luperchio et al. 2017). With the down-sampled BAM, we used featureCounts to create the log2 ratio of the ChIP to WCE in 10-kbp bins. Bins overlapping blacklisted regions or gaps in the genome (e.g., telomere, centromere) were excluded. We partitioned this ratio using the DNAcopy package in R (Seshan and Olshen 2023) with alpha = 0.001. LADs were classified as regions > 100 kb in size of positive signal (seg.mean), allowing for smaller regions of negative signal < 10 kb in size on autosomes and Chr X; iLADs were classified the same but with negative signal. After defining LADs in the CON sample, we calculated the median seg.mean in each LAD for DKO and CON. LADs with a median seg.mean decreasing by more than 0.1 were classified as “disrupted,” and all other LADs were classified as “nondisrupted.”
Histone mark ChIP-seq
ChIP-seq was performed as previously described (Lee et al. 2006) with amendments. Briefly, 2 × 10⁶–5 × 10⁶ cells per IP were cross-linked by adding 1/10 volume of fresh 11% formaldehyde solution (50 mM HEPES-KOH at pH 7.4, 100 mM NaCl, 1 mM EDTA, 1 mM EGTA, 11% formaldehyde) to a 1 × 10⁶ cells/mL cell suspension for 20 min at room temperature with mixing. Then, 1/12.5 volumes of 2.5 M glycine was added to quench formaldehyde, and cells were washed twice in ice-cold PBS. Cross-linked cells were lysed in lysis buffer 1 (50 mM HEPES-KOH at pH 7.5, 140 mM NaCl, 1 mM EDTA, 10% [v/v] glycerol, 0.5% [v/v] IGEPAL CA-630, 0.25% [v/v] Triton X-100, 1× Roche cOmplete, EDTA-free protease inhibitor cocktail) for 10 min at 4°C with rocking, pelleted at 1350g for 5 min at 4°C and then with lysis buffer 2 (10 mM Tris-HCl at pH 8.0, 200 mM NaCl, 1 mM EDTA, 0.5 mM EGTA, 1× Roche cOmplete, EDTA-free protease inhibitor cocktail) for 10 min at room temperature with rocking, pelleted again at 1350g for 5 min at 4°C, then resuspended in lysis buffer 3 (10 mM Tris-HCl at pH 8.0, 100 mM NaCl, 1 mM EDTA, 0.5 mM EGTA, 0.1% [w/v] sodiam deoxycholate, 0.5% [v/v] N-lauroylsarcosine, 1× Roche cOmplete, EDTA-free protease inhibitor cocktail), and transferred to Covaris miniTUBEs. Cell lysates were sonicated using a Covaris S220 focused-ultrasonicator with the following settings to shear DNA to a size of 300–500 bp suitable for high-throughput sequencing: fill level 10, duty cycle 10, PIP 175, cycles/burst 200 for 60 sec. Then 1/10 volume of 10% (v/v) Triton X-100 was added to the sonicated lysate, and cellular debris was pelleted at 20,000g for 10 min at 4°C. Immunoprecipitation was then performed overnight at 4°C with rotation using ProteinG Dynabeads (50 μL per IP) precoupled with antibody (5 μL per IP) in 0.5% BSA/PBS for >5 h. Antibodies used were H3K9me3 Rabbit pAb (Abcam 8898 lot GR3217836-1), H3K27ac (Abcam ab4729 lot 3357415-3), H3K27me3 (Cell Signaling Technology 9733S lot 16), H3K4me3 (EMD Millipore 07-472, lot 3746), and rabbit IgG pAb (Abcam ab46540). Antibody specificity was empirically confirmed by MODified histone peptide array (Active Motif) (Supplemental Fig. S3). Following immunoprecipitation, beads were collected using a magnet and washed five times with wash buffer (50 mM HEPES-KOH at pKa 7.55, 500 mM LiCl, 1 mM EDTA, 1% (v/v) IGEPAL CA-630, 0.7% (w/v) sodium deoxycholate) and then one time with Tris-EDTA-NaCl buffer (10 mM Tris-HCl at pH 8.0, 1 mM EDTA, 50 mM NaCl). DNA was then eluted from beads by incubation in elution buffer (50 mM Tris-HCl at pH 8.0, 10 mM EDTA, 1% (w/v) SDS) for 30 min at 65°C with shaking. Bead-free supernatant was reverse crosslinked by incubation for 6–15 h at 65°C, diluted with equal volume of TE buffer (10 mM Tris-HCl at pH 8.0, 1 mM EDTA), and then digested sequentially with RNase A (0.2 mg/mL) for 2 h at 37°C and Proteinase K (0.2 μg/mL) for 2 h at 55°C. Final immunoprecipitated DNA was then purified using a Zymo ChIP DNA clean and concentrator kit and prepared for sequencing using an Illumina TruSeq ½ reaction library preparation kit. Final libraries were quantified using an Agilent TapeStation using a D1000 screentape. Libraries for H3K9me3 were sequenced on an Illumina NextSeq 500, generating 76-bp paired-end reads, and all other libraries were sequenced on an Illumina NextSeq 2000, generating 66-bp paired-end reads.
Histone mark ChIP-seq processing and peak calling
FASTQ files of H3K27ac, H3K27me3, H3K4me3, H3K9me3, and IgG from CON and H3K27ac, H3K27me3, H3K4me3, and IgG from DKO-aligned were with Rsubread with the mm10 reference genome. Duplicate reads were removed with Picard tools. The HOMER pipeline was used to call peaks (Heinz et al. 2010). Tag directories were created for each library with the genome specified. For ChIP-seq samples, the findPeaks function was used to find peaks with style as histone, size as auto, and the corresponding IgG sample as input.
ATAC-seq
ATAC-seq was performed using the Omni-ATAC method (Corces et al. 2017). Briefly, 50,000 cells were pelleted at 500g for 5 min at 4°C and then lysed on ice for 3 min in 50 μL ATAC-RSB buffer (10 mM Tris-HCl at pH 7.4, 10 mM NaCl, 3 mM MgCl2) also containing 0.1% (v/v) IGEPAL CA-630, 0.1% (v/v) Tween-20, and 0.01% (w/v) digitonin. After lysis, 1 mL of ATAC-RSB containing only 0.1% (v/v) Tween-20 but no IGEPAL CA-630 or digitonin was added, and nuclei were pelleted at 500g for 10 min at 4°C. All supernatant was aspirated and discarded, and each pellet of nuclei was resuspended in 50 μL of transposition mix (25 μL 2× TD buffer, 2.5 μL Tn5 transposase [100 nM final], 16.5 μL PBS, 0.1 μL 5% digitonin, 0.5 μL 10% Tween-20, 5 μL H2O) and incubated for 30 min exactly at 37°C in a thermomixer with 1000 RPM mixing. DNA was then purified using a Zymo DNA clean and concentrator-5 kit to generate 20 μL of product, which was preamplified for five cycles using NEBNext 2X master mix (E7649A) and indexed primers as previously described (Buenrostro et al. 2013). Five microliters of preamplified DNA was then used in a 15 μL qPCR reaction using Promega GoTaq qPCR master mix to determine the required number of additional cycles to yield minimally amplified DNA for optimal library diversity for massively parallel sequencing. Amplified DNA was then purified using NucleoMag NGS clean-up and size select beads (Macherey-Nagel) using a 0.5× ratio of beads to DNA to initially clear large DNA fragments from the library and then a 1.5× ratio of beads to supernatant to adsorb DNA fragments of appropriate size for sequencing. DNA-bound beads were then washed twice with 80% EtOH, and size-selected DNA was eluted in nuclease-free water. Final libraries were quantified using an Agilent TapeStation using a D5000 screentape and sequenced using an Illumina NextSeq 2000 to generate about 50 million paired-end 165-bp reads per library.
ATAC-seq data were analyzed as previously described (Milevskiy et al. 2023). Briefly, Nextera adapter sequences were trimmed with trim_galore (https://github.com/FelixKrueger/TrimGalore), and then reads were mapped to the mm10 genome with Bowtie 2 with arguments ‐‐maxins 2000 ‐‐minins 38 ‐‐very-sensitive -p 48 -k 10. Duplicates were marked with sambamba (Tarasov et al. 2015). SAMtools (Danecek et al. 2021) was used to remove reads on Chr M and reads with FLAG 1804 (including duplicates and multi-mapped reads). BAM files of the biological replicates were merged with SAMtools. The HOMER pipeline was used to call peaks with the findPeaks function with style as factor and size as auto.
DNA fluorescence in situ hybridization
DNA fluorescence in situ hybridization (DNA-FISH) was performed on control and Suv39DKO primary DP thymocytes as previously described (Tapia Del Fierro et al. 2023) with 40- to 48-h hybridization time. BAC DNA (BACPAC resources) was isolated using a large-construct kit (Qiagen) and converted to fluorescently labeled DNA-FISH probes by a nick translation reaction (Abbott Laboratories). BACs used in this study are RP24-263I20 (Chr 12: 19,359,827–19,451,909), RP23-277F6 (Chr 2: 31,162,711–31,356,593), RP24-284I15 (Chr 1: 99,904,338–100,058,959), RP23-305P17 (Chr 6: 30,032,262–30,187,634), and RP24-391L20 (Chr 3: 72,874,595–73,009,096). Stained cells were visualized on an LSM 880 (Zeiss) microscope with Airyscan processing.
Microscopy data were analyzed automatically with a custom written macro in FIJI (Schindelin et al. 2012). Briefly, nuclei were segmented from the background with a 3D autothreshold and labeled on a scaled-down version of the DAPI channel. FISH foci were detected and assigned to a location within the nuclei via the 3D maxima detector and the EVF calculator in the 3D ImageJ suite (Ollion et al. 2013). The radial position was computed as the fractional distance of all detected foci between the nuclear periphery and center, with a maximum of two foci per nucleus (based on intensity) used in analysis. The P-value between groups was determined with a Wilcoxon test.
Hi-C
In situ Hi-C was performed on fixed cells as previously described (Johanson et al. 2018). Libraries were sequenced on an Illumina NextSeq 500 to produce 81-base-length paired-end reads. Independent biological duplicates were prepared for each condition and sequenced to a depth of about 200 million reads (Supplemental Table 1).
Hi-C data processing
Data preprocessing and analysis were performed as previously described with changes in the parameters (Johanson et al. 2018). Samples were aligned to the mm10 genome using the diffHic package v1.14.0 (Lun and Smyth 2015), which uses cutadapt v0.9.5 (Martin 2011) and Bowtie 2 v2.2.5 (Langmead and Salzberg 2012) for alignment and Picard suite v1.117 (https://broadinstitute.github.io/picard/) for fixing mate pair information and marking duplicate reads. Dangling ends and self-circling artifacts were identified and removed if the pairs of inward-facing or outward-facing reads were separated by <1000 bp (inward-facing) or 2000 bp (outward-facing). Read pairs with fragment sizes >1000 bp were removed. The proportion of reads removed through each processing step is tabulated in Supplemental Table 1.
The HOMER Hi-C pipeline (Heinz et al. 2010, 2018) was also used for Hi-C analysis. After processing with the diffHic pipeline, libraries in HDF5 format were converted to the Hi-C summary format with R. Then input-tag directions were created for each library with the makeTagDirectory function, with the genome (mm10) and restriction-enzyme-recognition site (GATC) specified. Summed biological-replicate tag directories for each cell type were also created.
To confirm the reproducibility of the libraries, the HiCRep R package was used to quantify the similarity between all libraries with the stratum adjusted correlation coefficient (SCC) (Yang et al. 2017). For every combination of libraries, the raw contact matrices (50-kbp resolution) of individual chromosomes for each replicate were used to compute the SCC with a smoothing parameter of three and a maximum distance considered at 5 Mbp. For each pairwise comparison, a median SCC was calculated across all chromosomes (Supplemental Fig. S7).
Plaid plots were constructed using the contact matrices and the plotHic function from the Sushi R package (Phanstiel et al. 2014). The inferno color palette from the viridis package (Garnier et al. 2024; https://sjmgarnier.github.io/viridis/) was used. The range of color intensities in each plot was scaled according to the library size of the sample to facilitate comparisons between plots from different samples. DI arcs were plotted with the plotBedpe function of the Sushi package. The z-score shown on the vertical access was calculated as −log10 (P-value).
Detection of A/B compartments
A/B compartments were identified at a resolution of 100 kbp with the method outlined by Lieberman-Aiden et al. (2009) using the HOMER Hi-C pipeline (Lin et al. 2012). With the summed biological replicate tag directories, the runHiCpca.pl function was used on each library with −res 100,000 and the genome (mm10) specified to perform principal component analysis to identify compartments. To identify changes in A/B compartments between libraries, the getHiCcorrDiff.pl function was used to directly calculate the difference in correlation profiles. A region was considered to flip compartment if the difference in correlation profile was <−0.1 and was determined from control cell A/B compartments. Chr Y was excluded from the analysis.
Detecting DIs
DIs between the different libraries were detected using the diffHic package v1.16.0 (Lun and Smyth 2015). Read pairs were counted into 50-kbp bin pairs for all chromosomes. Bins were discarded if they had a count of fewer than 10, contained blacklisted genomic regions as defined by ENCODE for mm10 (The ENCODE Project Consortium 2012), or were within a centromeric or telomeric region. Filtering of bin pairs was performed using the filterDirect function, in which bin pairs were only retained if they had average interaction intensities more than threefold higher than the background ligation frequency. The ligation frequency was estimated from the interchromosomal bin pairs from a 1-Mbp bin pair count matrix. Diagonal bin pairs were also removed. The counts were normalized between libraries using a loess-based approach with bin pairs <100 kbp from the diagonal normalized separately from other bin pairs. Tests for DIs were performed using the QL framework (Lund et al. 2012; Chen et al. 2016) of the edgeR package v3.26.5 (Robinson et al. 2010). A design matrix was constructed using a one-way layout that specified the group to which each library belonged. A mean-dependent trend was fitted to the negative binomial dispersions with the estimateDisp function. A generalized linear model (GLM) was fitted to the counts for each bin pair (McCarthy et al. 2012), and the QL dispersion was estimated from the GLM deviance with the glmQLFit function. The QL dispersions were then squeezed toward a second mean-dependent trend, using a robust empirical Bayes strategy (Phipson et al. 2016). A P-value was computed against the null hypothesis for each bin pair using the QL F-test. P-values were adjusted for multiple testing using the Benjamini–Hochberg method. A DI was defined as a bin pair with a FDR <5%. DIs adjacent in the interaction space were aggregated into clusters using the diClusters function to produce clustered DIs. DIs were merged into a cluster if they overlapped in the interaction space. The significance threshold for each bin pair was defined such that the cluster-level FDR was controlled at 5%. Cluster statistics were computed using the csaw package v1.18.0 (Lun and Smyth 2016). Overlaps between unclustered bin pairs and genomic intervals were performed using the InteractionSet package (Lun et al. 2016). Differential interactivity for DE genes was calculated from 50-kbp interactions with P-value < 0.05 before clustering and multiple testing. For each DE gene, the mean logFC from overlapping interactions was calculated.
Detecting TAD boundaries
TAD breakpoints were detected in each Hi-C library with TADbit v0.2.0.5 (Serra et al. 2017). Read pairs were counted into 50-kbp bin pairs (with bin boundaries rounded up to the nearest MboI restriction site). The TADbit tool find_tad was run on the raw counts specifying normalized = false. Only TAD boundaries with a score of seven or higher were included in the results.
Detecting differential TADs
Differential TAD boundaries (DTBs) between groups were detected with the diffHic and edgeR packages (Lun and Smyth 2015) using the approach described in chapter 8 of the diffHic user's guide. This approach adapts the statistical strategy recently described for differential methylation (Chen et al. 2017) to identify DTBs. The strength of a putative TAD boundary was assessed based on the upstream versus downstream intensity contrast at genomic loci, defined as the ratio of upstream to downstream Hi-C reads anchored at that genomic region. edgeR was used to test whether the ratio at the loci significantly increased or decreased in absolute size between groups. This method directly assesses differential boundary strength relative to biological variation without needing to make TADs calls in individual samples. Upstream and downstream read counts were determined for 200-kbp genomic regions and for 2 Mbp up- and downstream. Low-abundance regions with average log2-counts per million below two were removed along with regions in blacklisted regions, telomeres, or centromeres. Tests for DTBs were performed using the QL framework of edgeR. Regions with FDR below 0.05 were considered to be DTB.
Detecting differentially interacting promoters
Differentially interacting promoters (DIPs) were detected across all libraries with the diffHic package (Lun and Smyth 2015) and the method described previously (Chan et al. 2021) with alterations in parameters. Gene TSSs were defined with the mouse GENCODE gene set annotation (v. M24). Promoter regions (upstream 10 kbp and downstream 5 kbp) were defined with the promoter function from the GenomicFeatures package v1.36.2. Interactions between the promoters and the genome in 15-kbp bins were counted with the connectCounts function. Interchromosomal interactions or interactions in blacklisted regions or with an anchor >20 kbp or in the diagonal were excluded. A loess curve (span 0.1) was fitted to the average log counts per million (logCPM) for all libraries as a function of distance ^ 0.25 (loessFit function from the limma package v3.40.2) (Ritchie et al. 2015). An interaction was required to have an abundance larger than the fitted curved plus two times the mean of the absolute values of the residuals from the loess fit. Interactions for each promoter were then aggregated to produce a count matrix. Low-abundance promoters were filtered using edgeR's filterByExpr function. Only promoters for protein-coding genes were retained. Obsolete Entrez gene indentifications were removed, as were mitochondrial, Riken, and olfactory genes. The counts were normalized between libraries using a loess-based approach with the normOffsets function from the csaw package v1.18.0 (Supplemental Fig. S7).
DIPs were detected with the QL framework (Lund et al. 2012; Chen et al. 2016) of the edgeR package. A design matrix was constructed with a one-way layout that specified the cell type. Using the promoter counts, the estimateDisp function was used to maximize the negative binomial likelihood to estimate the common dispersion across all promoters with trend = none and robust = TRUE (Chen et al. 2014). A GLM was fitted to the counts (McCarthy et al. 2012), and the QL dispersion was estimated from the GLM deviance with the glmQLFit function with robust = TRUE and trend.method = none. The QL dispersions were then squeezed toward a second mean-dependent trend, with a robust empirical Bayes strategy (Phipson et al. 2016) to share information between genes. A P-value was calculated for each promoter using a moderated t-test with glmQLFTest. The Benjamini–Hochberg method was used to control the FDR <5%. Heatmaps of the filtered and normalized logCPM value were plotted with the coolmap function from the limma package. Gene set enrichment was tested using limma's fry function and visualized using limma's barcode enrichment plot.
Coverage plots and coverage of genomic features
For viewing and plotting, bedGraph files were created for ChIP-seq samples with bamCoverage from deepTools with arguments: normalizeUsing RPGC, bs 10, -e, and effectiveGenomeSize 2652783500. For bedGraph files from ATAC-seq samples, the arguments used were as follows: normalizeUsing RPGC, bs 10, and effectiveGenomeSize 2652783500. Coverage plots were created with computerMatrix and plotHeatmap from deepTools. For genes, the arguments used were as follows: scale-regions -S, -a 3000 -b 3000, -bs 10 –, and regionBodyLength 8000. For LAD boundaries with ChIP, the arguments used were as follows: reference-point -S, -a 500000 -b 500000, -bs 10000, and ‐‐averageTypeSummaryPlot median. For LAD boundaries with RNA-seq the argument -bs was changed to 20,000. Blacklisted regions were excluded.
ChIP-seq and ATAC-seq read coverage (log2 of the read per kilobase per million) of different genomic features (gene promoters, LADs, iLADs, and TAD boundaries) was determined with featureCounts from Rsubread with allowMultiOverlap = TRUE and the rpkm function from R package edgeR with log = TRUE. The read coverage of genes was determined from regions that are 2 kbp upstream of and 500 kbp downstream from the TSS. Nondifferentially expressed genes survived filtering in the DE analysis and adjusted P-value > 0.05. For LADs/iLADs, DIs and differential TAD boundary regions the genome regions excluded blacklisted regions. The P-value between groups was determined with a Wilcoxon test.
Overlaps between genomic features
Overlaps between genomic regions were identified with the overlapsAny function of the IRanges package v2.20.2 (Lawrence et al. 2013). Distances between nearest genomic features was calculated with the distanceToNearest function from the GenomicRanges package (Lawrence et al. 2013).
Motif enrichment
Motif enrichment was performed with the HOMER pipeline on genomic regions with the findMotifsGenome.pl function and specifying the genome as mm10 and size given and for genes with the findMotifs.pl function with mouse specified as the genome. For DIs, enrichment was performed on the unique anchor regions of unclustered DIs relative to a background of the same number of not-significant DI anchors (FDR > 0.05).
Identification of TAD cliques and modeling with Chrom3D
The Chrom3D pipeline was used to analyze the clique structure and model the 3D chromosome structure of the wild-type and DKO cells (Paulsen et al. 2017, 2018) with some modifications. For creating the input GTrack file we used the following: intrachromosomal interactions at 100 kbp, interchromosomal interactions at 1 Mbp, the LADs as determined by EDD in the wild-type and DKO libraries separately, and a diploid cell. Beads were created from TADbit segmentation at 50 kbp of summed biological replicates of the wild-type libraries excluding the Y Chromosome with the boundary rounded down to the nearest 50 kbp. As there were no overlapping TADs, we did not merge beads. For calculating the significance of the intrachromosomal interactions, we used fdr_bh with a cutoff of 1.5 and threshold of 0.05; for interchromosomal interactions, a cutoff of two and threshold of 0.05. TAD cliques were identified as previously described (Paulsen et al. 2019). For each sample type, we simulated 100 independent Chrom3D models, each with a separate seed value. We ran each simulation for 5 million iterations with a 5-μm radius, the nucleus flag, and 0.3 scale. Bead measurements were calculated as the median radius of beads of each feature type for a given model. Distributions of these measurements were compared by Welch's unequal variances t-test.
Data access
All raw and processed sequencing data generated in this study have been submitted to the NCBI Gene Expression Omnibus (GEO; https://www.ncbi.nlm.nih.gov/geo/) under accession number GSE156297.
Competing interest statement
The authors declare no competing interests.
Acknowledgments
We thank Thomas Jenuwein (MPI, Frieburg) for the Suv39h-deficient mice (Peters et al. 2001). We acknowledge the tremendous technical assistance from the staff of the core facilities at the Walter and Eliza Hall Institute, particularly Stephen Wilcox and Sarah MacRaild in the WEHI genomics hub, the staff of the Flow Cytometry facility (WEHIFACS), and WEHI Bioservices. This work was supported by grants and fellowships from the National Health and Medical Research Council (NHMRC) of Australia (C.R.K. and H.D.C.: 2010571; C.R.K.: 1125436; T.M.J.: 1124081; R.S.A.: 1100451, 1158531, 2001131; G.K.S.: 1154970), and the Australian Research Council (R.S.A.: 130100541). H.D.C. was supported by the Marian and E.H. Flack fellowship. This study was made possible through the Victorian State Government Operational Infrastructure Support and Australian Government NHMRC Independent Research Institute Infrastructure Support scheme.
Author contributions: C.R.K., N.I., A.T.d.F., A.K., T.M.J., and W.F.C. performed experiments. H.D.C., A.L.G., and L.W.W. performed formal analysis. M.E.B. provided critical resources. C.R.K., H.D.C., and R.S.A. wrote the paper. G.K.S. and R.S.A. supervised the research.
Footnotes
-
[Supplemental material is available for this article.]
-
Article published online before print. Article, supplemental material, and publication date are at https://www.genome.org/cgi/doi/10.1101/gr.279119.124.
-
Freely available online through the Genome Research Open Access option.
- Received February 16, 2024.
- Accepted April 3, 2024.
This article, published in Genome Research, is available under a Creative Commons License (Attribution-NonCommercial 4.0 International), as described at http://creativecommons.org/licenses/by-nc/4.0/.


