
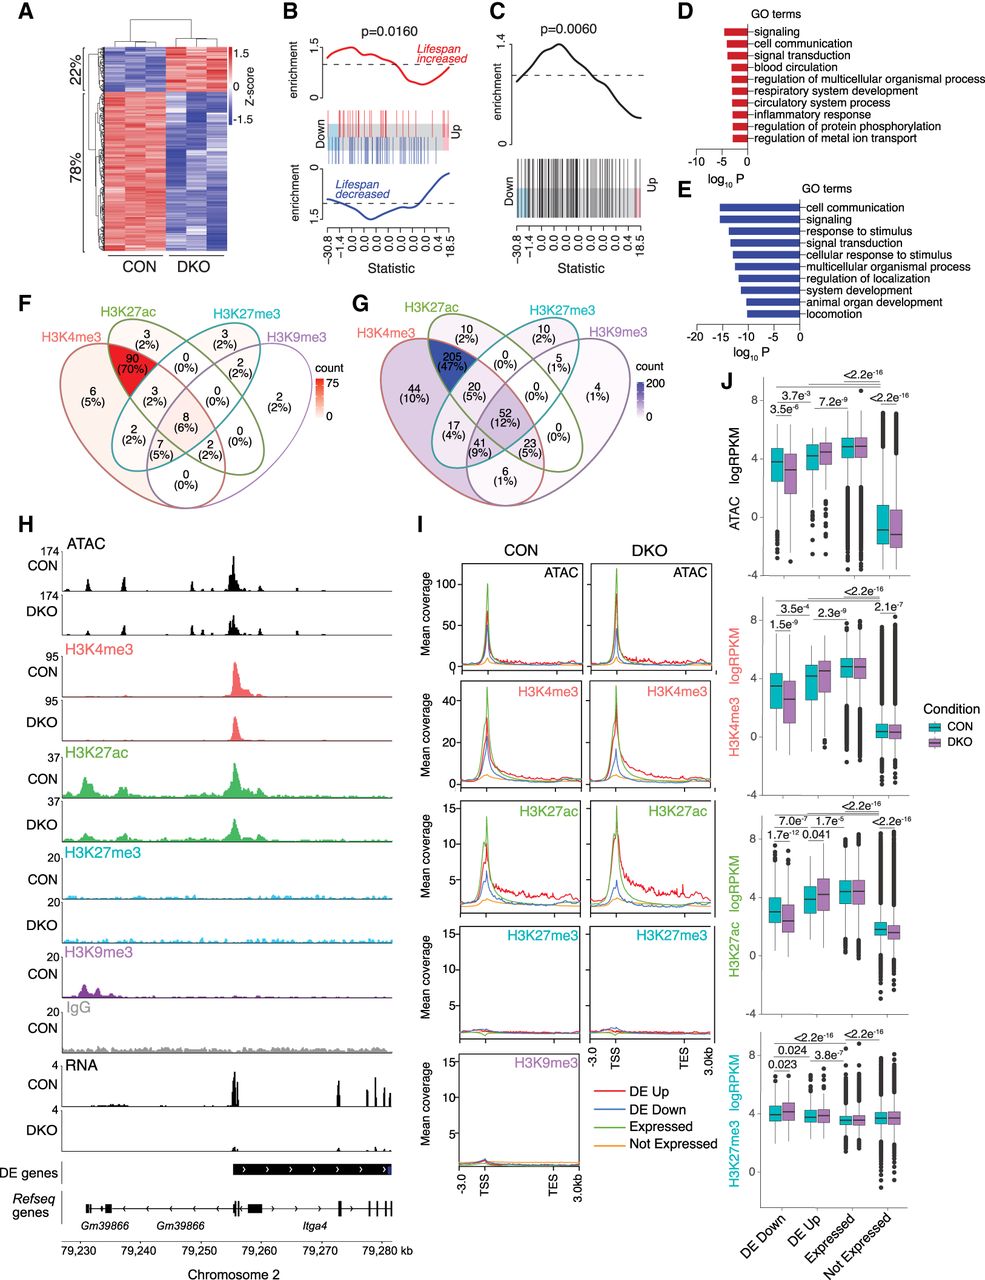
Suv39-dependent H3K9me3 loss causes predominant gene repression in euchromatic regions. (A) Heatmap showing change of expression (logRPKM) of differentially expressed (DE) genes between Suv39h1 and Suv39h2 double-knockout (DKO) and control cells. The proportions of genes down-regulated and up-regulated in Suv39DKO cells versus control are annotated. (B) Barcode enrichment plot showing ranking of aging-related genes from the GenAge database (de Magalhaes et al. 2009) among the DE genes. Genes are ranked right to left from most up-regulated to most down-regulated in DKO cells. The rank of genes associated with increased lifespan is marked by red vertical bars and that of genes associated with decreased lifespan by blue vertical bars. Red and blue worms show relative enrichment. ROAST gene set test P-values tests correlation. (C) Same as D but with directionality removed to include genes with contradictory annotated life span effects. (D,E) Gene Ontology (GO) enrichment in up-regulated (D) and down-regulated (E) DE genes. (F,G) quantification of overlap between up-regulated (F) and down-regulated (G) DE gene promoters (2 kbp upstream/500 bp downstream) and H3K4me3, H3K27ac, H3K27me3, and H3K9me3 ChIP-seq peaks from control DP thymocytes as called by HOMER. (H) Example tracks of the region surrounding the promoter of a down-regulated DE gene (Itga4) showing ATAC-seq, ChIP-seq (H3K4me3, H3K27ac, H3K27me3, H3K9me3, IgG), and RNA-seq data. (I) Plots of mean coverage from 3 kb upstream of the transcription start site (TSS) to 3 kb downstream of the transcription end site (TES) of up-regulated (DE Up), down-regulated (DE Down), and non-DE (divided into expressed and nonexpressed genes based on expression level in control cells) showing chromatin accessibility (ATAC) and H3K4me3, H3K27ac, H3K27me3, H3K9me3 H3K27ac, H3K9me3 ChIP-seq data. (J) Boxplots of ATAC, H3K4me3, H3K27ac, and H3K27me3 logRPKM across gene promoters (2 kbp upstream/500 bp downstream) that are up-regulated (DE Up), down-regulated (DE Down), and non-DE (divided into expressed and nonexpressed genes based on expression level in control cells). Box plots depict the interquartile range (IQR) ± 1.5 × IQR with median annotated. Distributions were compared by Wilcoxon test.


