
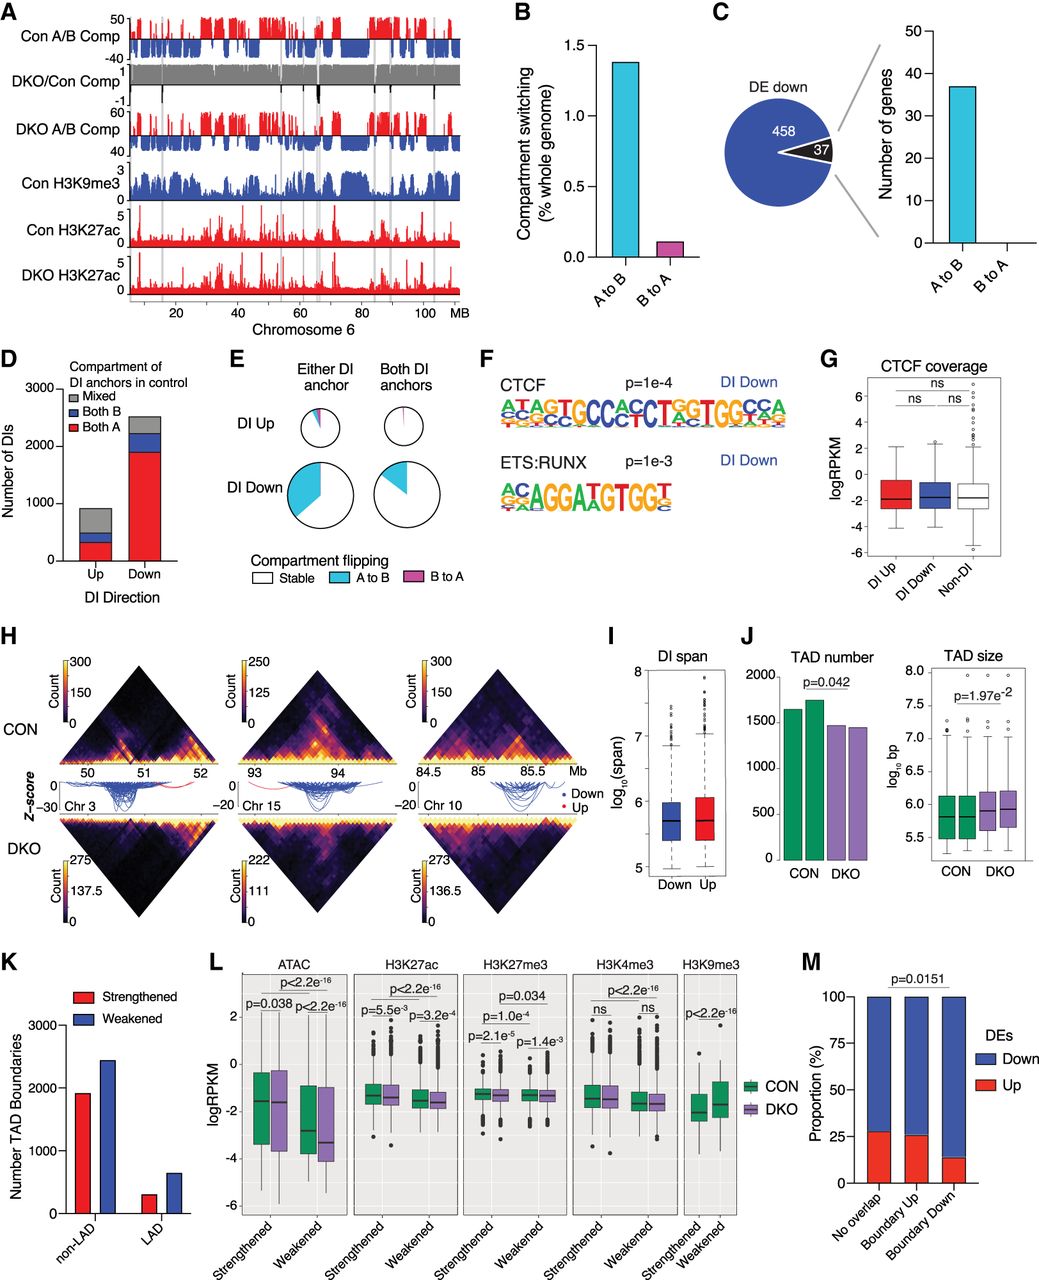
Heterochromatin loss causes a loss of chromatin interactivity in active regions and significant switching from active to repressive compartments. (A) Integrative Genomics Viewer (IGV) tracks of A/B compartments from Hi-C analysis of control and Suv39DKO DP thymocytes overlayed by H3K9me3 and H3K27ac ChIP-seq. (B) Proportion of genome that switches A/B compartments in Suv39DKO versus control cells (shown as a percentage of whole genome). (C) Overlap of down-regulated DE genes with compartment-switched regions. (D) Number of unclustered differential interactions (DIs) (FDR < 0.05) between Suv39DKO and control cells. Strengthened interactions (logFC > 0) are annotated as “up” and weakened (logFC < 0) as “down.” Overlap of the DI anchors with compartments A and B in control cells in shown. DIs in which both anchors are not contained in the same compartment or in which one or more anchor overlaps both compartments are annotated as “mixed.” (E) The proportion of DIs with anchors that overlap switched compartments. (F) Transcription factor (TF) binding motifs enriched in the anchors of DIs as determined by the HOMER pipeline. (G) CTCF ChIP-seq (Shih et al. 2012) coverage of the anchors of DIs versus the rest of the genome. Box plot depicts the IQR ± 1.5 × IQR and median annotated. Distributions were compared by Wilcoxon rank-sum test with continuity correction. (H) Hi-C contact matrices at 50-kbp resolution showing the top three DI regions between Suv39DKO and control cells. Color scale indicates the number of read bins per bin pair with visualization scaled to total library size to allow appropriate visual comparison. Unclustered DIs (FDR < 0.05) are shown as arcs (blue indicate a decrease in logFC, red an increase in logFC) in which the vertical axis is the −log10(P-value) of the DI. (I) The linear span between genomic anchors of strengthened (“up”) and weakened (“down”) DIs. Data shown as boxplot as in G. (J) Number and size of topologically associated domains (TADs) in each replicate sample of control and Suv39DKO cells. Data statistically compared by unpaired t-test with equal variance between the median of the TAD sizes and number of TADs. Boxplot for TAD size plotted as in G. (K) Number of TAD boundary changes between Suv39DKO and control cells divided into those overlapping LAD and non-LAD regions in control cells. (L) Density of ATAC, H3K27ac, H3K27me3, H3K27ac, H3K4me3, and H3K9me3 sequencing density (shown as logRPKM) of strengthened and weakened TAD boundaries in Suv39DKO and control cells. Data shown as boxplot as in G and compared by Wilcoxon rank-sum test with continuity correction. (M) Proportion of DE genes up-regulated versus down-regulated overlapping altered TAD boundaries and the rest of the genome. Data analyzed by chi-squared test.


