
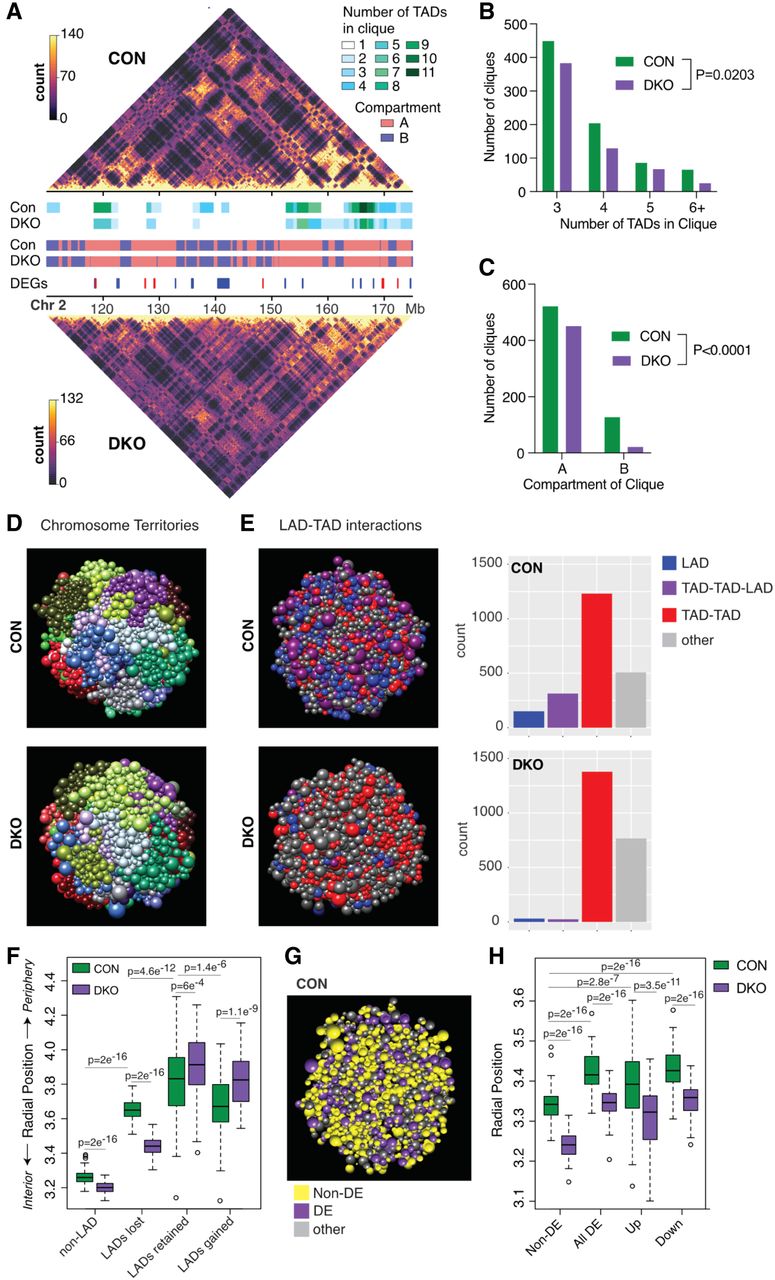
Higher-order modeling of the 3D nucleome in Suv39DKO cells reveals heterochromatin loss affects the expression of genes positioned closer to the nuclear periphery in 3D space. (A) Representative Hi-C contact matrices at 200-kbp resolution showing a loss of higher-order TAD–TAD cliques in Suv39DKO cells. Color scale indicates the number of read bins per bin pair with visualization scaled to total library size to allow appropriate visual comparison. A/B compartments are also annotated as are differentially expressed genes (DEGs; blue is down-regulated and red is up-regulated). (B) Number of higher-order TAD–TAD cliques detected in Suv39DKO and control cells. Data statistically compared by two-way ANOVA. (C) Number of higher-order TAD–TAD cliques in compartment A and compartment B in Suv39DKO and control cells. Proportion of cliques in each compartment data statistically compared by chi-squared test. (D,E) Representative Chrom3D modeling of the 3D nucleome of control and Suv39DKO cells colored as individual chromosome territories (each chromosome is arbitrarily colored; D) or higher-order TAD–TAD, TAD–TAD–LAD, or LAD interactions (E). (F) Measurements of LAD positioning from Chrom3D modeling in Suv39DKO and control cells. Box plot depicts the IQR ± 1.5 × IQR with median annotated from 100 independent modeling simulations from a separate seed value, with each simulation containing 5 million iterations. Distributions were compared by a Welch's unequal variances t-test. (G,H) Measurements of DE gene positioning from Chrom3D modeling as in F. Distributions were compared by a Welch's unequal variances t-test.


