
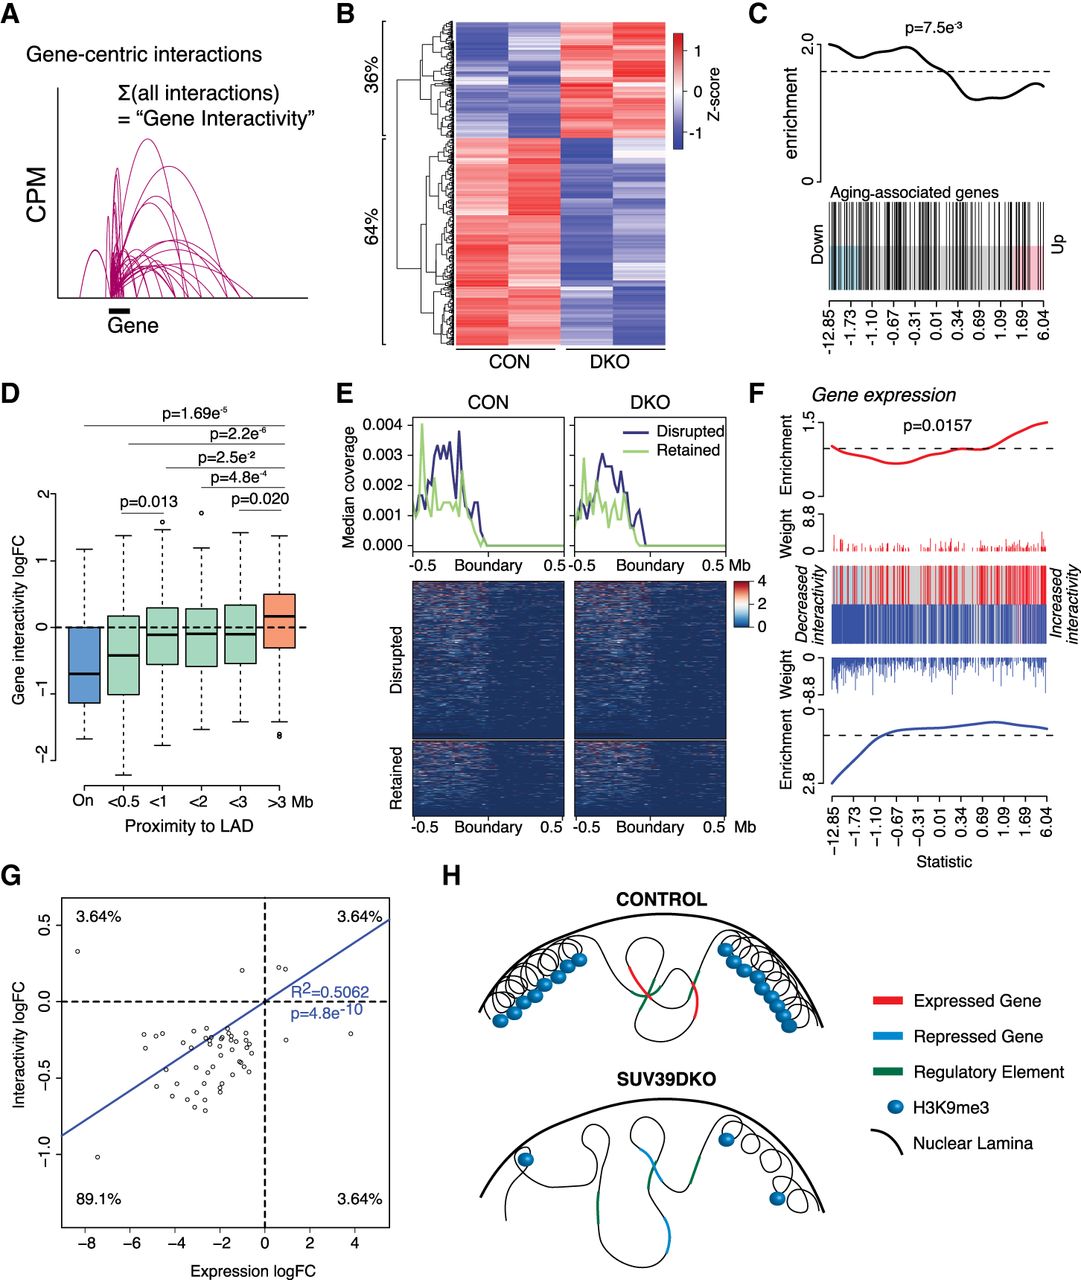
Altered euchromatic genome interactivity near LAD domains correlates with transcriptional dysregulation in Suv39DKO cells. (A) Schematic of gene-centric interactivity analysis. (B) Heatmap of the interactivity (log2CPM) of differentially interacting genes between Suv39DKO and control cells (FDR < 0.05). (C) Gene set enrichment analysis of genes with differential interactivity relative to aging-related genes from the GenAge database. Barcode enrichment plot shows the correlation of aging-related genes relative to differential interactivity. Genes are ordered on the plot from right to left (x-axis) from most increased in interactivity to most decreased in interactivity according to the moderated F-statistic. The P-value was calculated with the fry test. (D) The logFC of gene-centric interactivity for DE genes shown relative to linear genomic distance to the nearest LAD and statistically compared by Wilcoxon rank-sum test with continuity correction. (E) Coverage of RNA expression across iLAD/LAD boundaries with disrupted LADs in the Suv39DKO plotted separately from retained LADs. Summary plot shown as the median of the coverage. (F) Barcode enrichment plot showing the correlation of DE genes relative to differential interactivity. Genes are ordered on the plot from right to left (x-axis) from most up-regulated to most down-regulated according to the moderated F-statistic. The P-value was calculated with the fry test. (G) The logFC of gene-centric interactivity relative to logFC of transcriptional change for DE genes. (H) Schematic of putative mechanism by which the loss of heterochromatin causes transcriptional repression in euchromatic regions.


