
Inferring and comparing metabolism across heterogeneous sets of annotated genomes using AuCoMe
- Arnaud Belcour1,4,
- Jeanne Got1,4,
- Méziane Aite1,
- Ludovic Delage2,
- Jonas Collén2,
- Clémence Frioux3,
- Catherine Leblanc2,
- Simon M. Dittami2,
- Samuel Blanquart1,
- Gabriel V. Markov2,5 and
- Anne Siegel1,5
Abstract
Comparative analysis of genome-scale metabolic networks (GSMNs) may yield important information on the biology, evolution, and adaptation of species. However, it is impeded by the high heterogeneity of the quality and completeness of structural and functional genome annotations, which may bias the results of such comparisons. To address this issue, we developed AuCoMe, a pipeline to automatically reconstruct homogeneous GSMNs from a heterogeneous set of annotated genomes without discarding available manual annotations. We tested AuCoMe with three data sets, one bacterial, one fungal, and one algal, and showed that it successfully reduces technical biases while capturing the metabolic specificities of each organism. Our results also point out shared and divergent metabolic traits among evolutionarily distant algae, underlining the potential of AuCoMe to accelerate the broad exploration of metabolic evolution across the tree of life.
The comparison of genomic data gave rise to today's view of the three domains of life: bacteria, archaea, and eukaryotes, which are divided into several supergroups (Burki et al. 2020). The evolution of the organisms within these lineages is linked to their ability to adapt to their environment and, therefore, to the plasticity of their metabolic responses. In this context, the analysis of genome-scale metabolic networks (GSMNs) constitutes a powerful approach, both for graph-based and metadata comparison and, when compatible, for flux-based approaches (Gu et al. 2019). The number of sequences available in public databases is continuously rising, as illustrated by the NCBI GenBank database, which grew by 74.30% for whole-genome shotgun data in 2019 compared with 2018 (Sayers et al. 2019). GSMN reconstruction is theoretically possible for any genome and has already been used to explore evolutionary questions. Metabolic relationships in 975 organisms from the three domains of life showed that these domains were well separated (Schulz and Almaas 2020). Using GSMN reconstruction in bacteria, metabolic and phylogenetic distances between Escherichia coli and Shigella strains could be explained by the parasitic lifestyle of the latter (Vieira et al. 2011). Another GSMN-based study of 301 genomes from the human gut microbiota identified marginal metabolic differences at the microbiota family level but significant metabolic differences between closely related species (Bauer et al. 2015). Analysis of fungal GSMNs additionally showed correlation between metabolic distances and the phylogeny of Penicillium species, even if no connection was found between the metabolic distances and the species habitat (Prigent et al. 2018). In brown algae, the GSMNs of Saccharina japonica and Cladosiphon okamuranus (Nègre et al. 2019) were compared with the GSMN of Ectocarpus siliculosus, revealing that heterogeneity of genome annotations may have a stronger impact on GSMNs than genuine biological differences.
For most GSMN analyses, some limitations still need to be addressed (Bernstein et al. 2021). When comparing different GSMNs, two main biases concern the variable quality of genome annotations and the multitude of reconstruction approaches. A variety of methods exist to perform structural (gene structure prediction) and functional (association of functions to genes) annotation steps (Yandell and Ence 2012), and the method choice has previously been shown to have direct effects on the reconstructed GSMNs (Karimi et al. 2021). Similarly, numerous methods for GSMN reconstruction have been developed, for example, Pathway Tools (Karp et al. 2019), RAVEN (Wang et al. 2018), merlin (Dias et al. 2015; Capela et al. 2022), KBase (Arkin et al. 2018), ModelSEED (Devoid et al. 2013), AuReMe (Aite et al. 2018), AutoKEGGRec (Karlsen et al. 2018), CarVeMe (Machado et al. 2018), and gapseq (Zimmermann et al. 2021). They rely on one or several metabolic databases such as MetaCyc (Caspi et al. 2020), KEGG (Kanehisa and Goto 2000; Kanehisa et al. 2017), ModelSEED (Seaver et al. 2021), or BiGG (King et al. 2016). Despite efforts in the direction of database reconciliation (Moretti et al. 2021), the heterogeneity of metabolic databases requires time-consuming matching of their respective identifiers and may thus impede the comparison of the GSMNs.
One strategy to resolve the issue of GSMN comparison is to work directly on GSMNs. A first method is the reconstruction annotation jamboree (Thiele and Palsson 2010), a community effort to curate pathway discrepancies by examining reactions, gene–protein–reaction (GPR) associations, and metabolites in GSMNs in order to create a consensus GSMN for an organism. This is relevant for organisms for which multiple GSMNs exist in order to establish a reference one. This strategy was successfully applied to Salmonella typhimurium LT2 (Thiele et al. 2011), as well as Saccharomyces cerevisiae (Herrgård et al. 2008), and later multiple organisms to create a panmetabolism of 33 fungi (Correia and Mahadevan 2020). Although platforms now facilitate such community efforts (Cottret et al. 2018), these methods are costly in terms of the manpower involved.
A second strategy to resolve GSMN comparison issues is to adapt the GSMN reconstruction method. This strategy aims at reducing annotation biases through the reconstruction of GSMNs from homogeneously annotated genomes using the same method and database, possibly followed by the propagation of annotations with sequence alignments (Vieira et al. 2011; Prigent et al. 2018). This strategy was pushed forward and automatized in the tool CoReCo, which enabled the reconstruction of gap-less metabolic networks from several nonannotated genomes (Pitkänen et al. 2014; Castillo et al. 2016). The main limitation of such approaches is that the reannotation of the genomes supplants the previous genome annotation.
Annotations of genomes in databases also reflect the expertise of scientists. Their quality and precision, ranging from structural features, such as the accuracy of intron–exon boundaries, to functional inferences, like the assignation to a specific catalytic activity based on previous biochemical evidence, highly depend on the amount of curation effort performed after the initial automated steps. Such valuable information is lost during a systematic reannotation step. For a reliable interpretation of data, expert annotations therefore ought to be preserved while automatically inferring metabolic networks from any type of genomic resource. In this article, we introduce a new method, automated comparison of metabolism (AuCoMe), that creates a set of homogenized GSMNs from heterogeneously annotated genomes. This enables a less biased functional comparison of the networks and the determination of metabolic distances using the presence/absence of reactions. Our objective was to develop an efficient and robust approach that does not depend on the quality of the initial annotations and is able to aggregate heterogeneous information in both prokaryote and eukaryote data sets. AuCoMe combines metabolic network reconstruction, propagation, and verification of annotations. The method automatizes the strategy of transferring information from the annotations of the genomes and complements this information transfer with local searches of missing structural annotations. AuCoMe was applied to three heterogeneous data sets composed of fungal, algal, and bacterial genomes. Our results show that AuCoMe succeeds at propagating missing reactions to degraded metabolic networks while capturing the metabolic specificities of organisms despite profound differences in the quality of genome annotations. This provides a knowledge base for the comparison of metabolisms between different organisms.
Results
A tool for homogenizing metabolism inference
AuCoMe is a Python package that aims to build homogeneous metabolic networks and panmetabolisms, starting from genomes with heterogeneous functional and structural annotations. AuCoMe propagates annotation information among organisms through a four-step pipeline (Fig. 1).
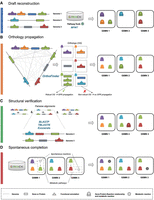
Reconstruction and homogenization of metabolisms with AuCoMe. Starting from a data set of partially structurally and functionally annotated genomes, AuCoMe's pipeline performs the following four steps. (A) Draft reconstruction. The reconstruction of draft genome-scale metabolic networks (GSMNs) is performed using Pathway Tools in a parallel implementation. (B) Orthology propagation. OrthoFinder predicts orthologs by aligning protein sequences of all genomes. The robustness of orthology relationships is evaluated (see Methods), and gene–protein–reaction (GPR) of robust orthologs are propagated. (C) Structural verification. The absence of a GPR in genomes is verified through pairwise alignments of the GPR-associated sequence to all genomes where it is missing. If the GPR-associated sequence is identified in other genomes, the gene is annotated, and the GPR is propagated. (D) Spontaneous completion. Missing spontaneous reactions enabling the completion of metabolic pathways are added to the GSMNs. (OG) Orthologs. Outlines around GPR or reaction indicate that the GPR or reaction is newly added during the corresponding step.
The AuCoMe pipeline was tested on three data sets composed of genomes that offer different levels of phylogenetic diversity. The bacterial data set includes 29 genomes belonging to different species of Escherichia and the closely related Shigella, the fungal data set (74 fungal genomes and three outgroup genomes) covers a range of different phyla within this kingdom, and, finally, the algal data set (36 algal genomes and four outgroup genomes) shows the highest phylogenetic diversity, including eukaryotes from the supergroups Stramenopiles, Alveolata, and Rhizaria (SAR); Haptophyta; Cryptophyta; and Archaeplastidia. For all species included in the three data sets, we used publicly available annotated genomes (see Supplemental Tables S1–S3). Run times of AuCoMe on a cluster were 7 h (10 CPUs), 25 h (40 CPUs), and 45 h (40 CPUs) for the bacterial, fungal, and algal data sets, respectively. Details for individual steps are reported in Supplemental File, section 2.
In the first step, the draft reconstruction step, draft metabolic networks are automatically inferred from the original annotations (especially Gene Ontology [GO] terms and Enzyme Commission [EC] numbers) using Pathway Tools (Fig. 1A). Only reactions supported by gene associations or spontaneous reactions were kept in the draft metabolic networks (see Methods). The GSMNs reconstructed at this step from the three data sets show highly heterogeneous reactions (Fig. 2A,B–D, blue bars; see also Supplemental Figs. S1–S3). Notably in the fungal data set, no reactions were inferred from annotations in seven species, and 12 draft GSMNs contained fewer than 10 reactions. For the latter, their respective genome annotations included no EC number, and 11 did not include any GO term.
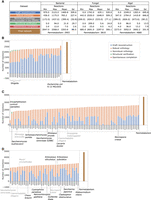
Application of the AuCoMe pipeline to the bacterial, fungal, and algal data sets of genomes. The summary table (A) depicts the number of reactions identified for each species at each step of the AuCoMe pipeline: reactions recovered by the draft reconstruction step (blue), unreliable reactions predicted by orthology propagation and removed by the filter (gray), robust reactions predicted by orthology propagation that passed the filter (orange), additional reactions predicted by the structural verification step (green), and spontaneous completion (red). The final metabolic networks encompass all these reactions except the nonreliable ones. Panels B–D illustrate the results for each genome of the three data sets. The panmetabolism of each data set (all the reactions occurring in any of the organisms after the final step of AuCoMe) is presented in brown in B–D. Organisms with gray labels are outgroups. See also Supplemental Figures S1–S3.
Similar observations were also made, although to a lesser extent, for the algal genome data set, with seven genomes having more than 2000 reactions and seven genomes having fewer than 500 reactions. At this step, high heterogeneity in the number of reactions can be attributed mainly to differences in the quality and quantity of the functional annotations provided, precluding biologically meaningful comparisons of the GSMNs obtained at the draft reconstruction step. Those initial results from Pathway Tools are a good proxy for the quality of initial genome annotations.
The resulting GSMNs and their proteomes were then subjected to comparative genomic analyses in the orthology propagation step. During this process, GPR associations are propagated across GSMNs according to orthology relations established using OrthoFinder (Fig. 1B). A robustness filter (see Methods) then selects the robust GPR relationships among all propagated associations. After this step, we observed a homogenization of the number of reactions in the data sets (Fig. 2, orange bars; Supplemental Figs. S1–S3). The fungal data set shows an outlier at this step; the GSMN of Encephalitozoon cuniculi contained only 681 reactions compared with more than 1000 reactions in the other fungal GSMNs. This is consistent with this species being a microsporidian parasite with a strong genome and gene compaction (Grisdale et al. 2013). In all data sets, among the reactions propagated by orthology, a few hundred were removed because they did not fulfill the robustness score criterion (see Methods).
A third step (the structural verification) consists in checking for the presence of additional GPR associations by finding missing structural annotations in all genomes (Fig. 1C). Compared with the orthology propagation, the structural verification step had a smaller impact on the size of the final networks (Fig. 2, green bars; Supplemental Figs. S1–S3). Ninety-five percent of the GSMNs received fewer than 28 reactions during this step, and the maximum was 209. In the bacterial data set, the six Shigella received more reactions at this step compared with the other strains (on average, 76.2 vs. 7.4). After a manual examination, a majority of these reactions were associated with pseudogenes. For the fungal data set, AuCoMe added 209 reactions for Saccharomyces kudriavzevii. These reactions were associated with 192 sequences recovered during the structural step. For all of these sequences, we found corresponding transcripts in a published transcriptome data set (Blevins et al. 2021). As for the algal data set, 86 reactions were added for Ectocarpus subulatus. We validated the presence of 59 out of 65 genes (83 out of 86 reactions) by associating them with existing transcripts. The remaining six genes (three reactions) corresponded to plastid sequences that had remained in the nuclear genome assembly. In both fungal and algal data sets, the structural completion step was, therefore, able to recover sequences likely to correspond to functional genes.
Finally, the spontaneous completion step (Fig. 1D) adds spontaneous reactions to each metabolic network if these reactions complete MetaCyc pathways (Fig. 2, red bars; Supplemental Figs. S1–S3). For the fungal data set, this step added between two and 23 spontaneous reactions, leading to two to 27 additional MetaCyc pathways that achieved a completion rate equal to 100%. For the algae, the same step added between four and 36 spontaneous reactions, yielding two to 31 additional pathways. The fewer reactions that were inferred at the draft reconstruction step, the more spontaneous reactions that were added to complete pathways (Pearson's r = −0.83 and −0.84 for the fungal and algal data sets, respectively). The addition of these spontaneous reactions to the ones predicted by Pathway Tools (only other step predicting this type of reaction) led to the prediction of fewer than a hundred spontaneous reactions per GSMN.
When looking at the size of the final networks, overall, in the three data sets, the final GSMNs were of similar size after applying AuCoMe regardless of the quantity and quality of their corresponding genome annotations. In the bacterial data set (Fig. 2B; Supplemental Fig. S1), the networks of Shigella strains comprised fewer reactions than the rest (an average of 2148 reactions vs. 2294, Wilcoxon rank-sum test W = 138, P = 2 × 10⁻⁴). This is consistent with the results of Vieira et al. (2011). On the other hand, E. coli K–12 MG1655 stood out with 2568 reactions compared with 2047 to 2342 for the other strains. This can be explained by the curation on this strain and the fact that reactions propagated from E. coli K–12 MG1655 to the other strains were frequently supported by only one gene predicted at the draft reconstruction step and were removed after the orthology propagation (see Methods).
Validation of AuCoMe predictions
To estimate the quality of the predictions made by AuCoMe, experiments were performed.
In the first experiment, we compared the GSMNs created by AuCoMe to those created by CarveMe, ModelSEED, and gapseq on the bacterial data set (Supplemental Fig. S4A–F). On this data set, AuCoMe performed well regarding the recovery of EC numbers, although it does not reconstruct the largest GSMNs, limiting the inference of reactions to those associated with genes. The ECs inferred by the different tools for E. coli K–12 MG1655 were compared with a reference containing ECs from EcoCyc, KEGG, BiGG, and ModelSEED associated with E. coli K–12 MG1655 (Supplemental Fig. S5A–D). In this comparison, AuCoMe predicted the highest number of true positives (Supplemental Fig. S6).
Then, a second comparison on the eukaryotes was performed with AuCoMe, the gapseq find module, and ModelSEED on five fungal genomes. Results on the eukaryotic genomes showed that AuCoMe predicts the most EC numbers, reactions, and pathways in species distant from the model ones (Supplemental Table S5; Supplemental Fig. S7). A comparison with metabolic pathways contained in YeastCyc for the genome of S. cerevisiae S288C was performed to estimate the quality of the predicted pathways. AuCoMe predicted a high number of pathways with a low completion rate not found in YeastCyc (Supplemental Fig. S8). For pathways with a completion rate >70%, AuCoMe and gapseq showed similar performance (Supplemental Fig. S9). Although these experiments should be confirmed by an exhaustive comparative study, these results suggest that AuCoMe is suitable for the study of the metabolism of multiple eukaryotic genomes by predicting robust gene–reaction associations.
The third evaluation of the reliability of the reconstruction process was performed on the final algal data set. We manually examined 100 random GPR associations across the metabolic networks generated by AuCoMe: 50 reactions that were predicted to be present and 50 reactions that were predicted to be absent (see Methods). Not counting spontaneous reactions, manual annotations and automatic predictions corresponded in 86% of all cases (42/49) for the reactions predicted to be present and in 91% (40/44) for the reactions predicted to be absent (see Supplemental Tables S6, S7). These data underline the robustness of the AuCoMe pipeline.
For the fourth verification, we extracted the EC numbers of all reactions of the fungal and the algal data set GSMNs for which GPR associations were only predicted by orthology. For each EC number, we extracted the associated protein sequence and used DeepEC (Ryu et al. 2019) to infer EC numbers and compared them to the EC numbers linked to the reaction by the pipeline. An enrichment of sequences confirmed by DeepEC is observed in robust GPR associations compared with those discarded by the filter: 26% versus 4.8% in the fungal data set and 13.6% versus 1.4% in the algal data set (see Supplemental Fig. S10). This confirms that the robustness filter removed predominantly poorly supported reactions.
In the fifth experiment, 32 data sets were formed, each containing the 29 bacterial E. coli and Shigella strains studied by Vieira et al. (2011), among them a replicate of the E. coli K–12 MG1655 genome degraded to a variable extent in its functional and/or structural annotations (see Methods) (Supplemental Table S4). The manually curated EcoCyc database (Karp et al. 2018a) was used to check the reliability of the GSMN reconstructed for each corresponding degraded genome. For each of the 32 data sets, F-measures were computed at each AuCoMe step according to comparisons of the reconstructed GSMN with the gold-standard EcoCyc database (see Methods). Figure 3A illustrates the number of reactions predicted by AuCoMe for the E. coli K–12 MG1655 GSMN in each of the 32 synthetic bacterial data sets to assess the importance of each step in the homogenization of the GSMN sizes. Figure 3B represents the F-measure for the corresponding data set. As expected, the more the genomes were degraded, the lower the F-measures were. The orthology propagation alleviated this degradation for functionally degraded genomes (data sets labeled one to 10). And the structural verification step compensated the loss of annotation in structurally degraded genomes (data sets labeled 22 to 31). With both types of degradation (data sets 11 to 21), the combination of the two steps recovered lost reactions.
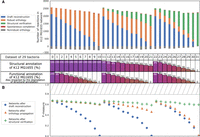
Efficiency of AuCoMe on degraded genome assemblies. (A) Number of reactions in E. coli K–12 MG1655 degraded networks after application of AuCoMe to 32 synthetic bacterial data sets. Each data set consists of the genome of E. coli K–12 MG1655, to which degradation of the functional and/or structural annotations was applied, together with 28 bacterial genomes. Each vertical bar corresponds to the result on the E. coli K–12 MG1655 within a synthetic data set, with the percentages of degraded annotations indicated below. The data set labeled “zero” was not subject to degradation of the E. coli K–12 MG1655 annotations. Three types of degradation have been performed: functional annotation degradation only (left side; data sets labeled one to 10), structural annotation degradation only (right side; data sets labeled 22 to 31), and both degradation types (middle; data sets labeled 11 to 21). The colored bars depict the number of reactions added to the degraded network at the different steps of the method (the blue, orange, green, gray, and red color legends are as described in Fig. 2). The table shown as axis indicates the data set number and the percentage of functional or structural annotation impacted by the degradation for the corresponding column in both subfigures. (B) F-measures after comparison of the GSMNs recovered for each E. coli K–12 MG1655 genome replicates with a gold-standard network. Reactions inferred by each AuCoMe step for each replicate were compared with the gold-standard EcoCyc GSMN, allowing for the computation of F-measures. F-measures obtained after the draft reconstruction step, the orthology propagation step, or the structural verification step are shown as blue circles, orange triangles, and green crosses, respectively. The hashed rectangle from F-measure 0.79 to one highlights the values of F-measure, which are unreachable because 1019 reactions in EcoCyc were not present in the panmetabolism of the 29 nondegraded bacteria.
Notably, even when 100% of the E. coli K–12 MG1655 functional and structural annotations are degraded, the information from the other 28 nonaltered genomes enabled the recovery of 2244 reactions (Fig. 3A, data set 31) and an F-measure of 0.60. Altogether, these results show that, by taking advantage of the annotations present in the other genomes of the considered data set, AuCoMe builds GSMNs with reactions even for genomes completely missing functional and structural annotations.
Exploration of Calvin cycle and pigment pathways in algae
The accuracy of the annotation transfer procedure by AuCoMe was further assessed using two pathways in which there were clear biological expectations in the algal data set. The Calvin cycle is a biochemical pathway present in photosynthetic organisms to fix CO2 into three-carbon sugars composed of 13 reactions (MetaCyc identifier: CALVIN-PWY) (Fig. 4).
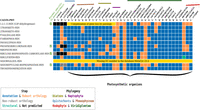
AuCoMe results on the Calvin cycle pathway in the algal data set. AuCoMe was applied to the data set of 36 algae and four outgroup species (columns). Each row represents a MetaCyc reaction of the pathway; the table shows whether it is predicted by AuCoMe: blue, draft reconstruction; orange, robust reactions predicted by orthology propagation that passed the filter; green, structural verification; gray, nonrobust reactions predicted by orthology propagation and removed by the filter; black, not predicted; and yellow, manually added because the MetaCyc database 23.5 does not contain a reference gene–reaction association for this reaction.
The three main AuCoMe steps are required to obtain a homogeneous view of this pathway in all organisms. The draft reconstruction (blue) and the orthology propagation (orange) steps provide most of the reactions. The robustness criterion (gray) applied during the orthology propagation step removed a GPR association with the reaction RIBULOSE-BISPHOSPHATE-CARBOXYLASE-RXN for the nonphotosynthetic fungus Neurospora crassa. The structural verification step added one reaction (RIBULP3EPIM-RXN) for Porphyra umbilicalis (Fig. 4, green square). The G3P dehydrogenase reaction (1.2.1.13-RXN) had to be added manually in brown algae, diatoms, and haptophytes because the canonical plastidial gene has been replaced by a cytosolic paralog (Liaud et al. 1997). Similarly, the EC number associated with the reaction SEDOBISALDOL-RXN was incomplete (only three digits) in the MetaCyc version used and not found in the 40 GSMNs and, therefore, was manually added to the 40 GSMNs (for GPR associations, see Fig. 4, yellow; for details, see Supplemental Data).
A similar analysis was performed on pathways producing phycobilins in five brown algae (Supplemental Fig. S11). As for the Calvin cycle, reactions in the pathways were added during draft reconstruction, orthology propagation, and spontaneous completion. The finding of those pathways in brown algae may appear contradictory with the loss of associated phycobiliproteins during evolution (Bhattacharya et al. 2004). However, the retention of enzymes related to phycobilin biosynthesis is linked with their co-option from a role as photosynthetic pigments to a function of signaling within photoreceptors (Rockwell and Lagarias 2017).
Both of these analyses highlight the potential of AuCoMe to help understand metabolism and its evolution in a group of nonmodel organisms by predicting candidate GPRs and pathways.
AuCoMe GSMNs are consistent with species phylogeny
To further assess the predictions of AuCoMe and to explore biological features, we clustered the GSMNs of the algal data set after the draft reconstruction as well as at the end of the pipeline by using the presence or absence of reactions in the GSMNs (see Fig. 5A,B). We compared these clusterings with a phylogeny compiled from Strassert et al. (2021). The initial GSMNs produced from the annotations showed low consistency with the phylogenetic relationships (Fig. 5A). Even well-established phylogenetic groups like red algae or brown algae were not recovered. At this step, the principal factor leading to the repartition of points in the MDS was the heterogeneity of genome annotations. An ANOSIM test supports this as it was not able to differentiate the main phylogenetic groups (R = 0, P-value = 0.45). However, in the MDS made from the GSMNs after the final step of AuCoMe (Fig. 5B), we observed a clear separation between the known phylogenetic groups, supported by an ANOSIM test (R = 0.811, P-value = 1 × 10⁻⁴). This is also visible in the dendrograms clustering the GSMNs generated by the complete AuCoMe pipeline, which was broadly consistent with the reference species phylogeny (Fig. 5C,D). There were only three higher-order inconsistencies concerning Cyanophora paradoxa, for which the genome version deposited in GenBank fully lacked expert annotations (Price et al. 2012); Guillardia theta, which belongs to the cryptophytes, for which the phylogenetic position is controversial (Strassert et al. 2021); and Nannochloropsis gaditana, which was the only representative of Eustigmatophycean Stramenopiles. The two other Stramenopile groups, diatoms and brown algae, were represented by multiple species, which likely minimizes errors linked with peculiarities of a single genome. There were also some minor inconsistencies in intra-group relationships in green algae, diatoms, brown algae, and opisthokonts.
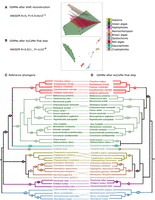
AuCoMe as a tool to improve taxonomic consistency of GSMNs. (A,B) MDS plots for GSMNs calculated with the AuCoMe draft reconstruction step (A) or after all AuCoMe steps (B). In both cases, ANOSIM values are indicated below (MDS and ANOSIM were computed using the vegan package [https://github.com/vegandevs/vegan] with R 4.1.2 [R Core Team 2023]). (C,D) Tanglegram evaluating the taxonomic consistency between reference phylogeny, compiled from Strassert et al. (2021) (C) with AuCoMe dendrograms based on metabolic distances using the pvclust package version 2.0.0 (Suzuki and Shimodaira 2006) with R 3.4.4 (R Core Team 2023) with the Jaccard distance (D). Full lines join species for which the position in the AuCoMe dendrogram is consistent with the reference phylogeny. Dotted lines join species for which the metabolic dendrogram and the reference phylogeny diverge. (A/C) Archeplastids/cryptophytes, (A) archeplastids, (R) rodophytes, (Gr) green algae, (M) Mamiellales, (Chla) Chlamydomonadales, (Sph) Sphaeropleales, (T) Trebouxiophyceae, (Chlo) Chlorellaceae, (St) streptophytes, (Gl) glaucophytes, (C) cryptophytes, (H) haptophytes, (I) Isochrysida, (D) diatoms, (S) Stramenopiles, (B) brown algae, (E) Ectocarpales, (Ec) Ectocarpaceae, (Ch) Chordariaceae, (Op) opistochonts, (F) fungi, (As) ascomycetes.
An illustration of the efficiency of AuCoMe was the de novo reconstruction of the GSMN of the glaucophyte C. paradoxa. For the reconstruction of this GSMN, we used the initially published genome sequence, which contained only two functionally annotated genes (Price et al. 2012). The draft reconstruction by AuCoMe enabled us to retrieve 1675 GPRs, a number within the same range as the other species from the data set. Accordingly, C. paradoxa branched at the basis of the dendrogram after the draft reconstruction step, whereas it moved to the archeplastids after the orthology propagation step. Even if the grouping of C. paradoxa within archeplastids with the streptophytes Chara braunii and Klebsormidium nitens does not reflect the phylogenetic relationships, this shows that AuCoMe is a reasonable proxy for handling nearly unannotated genome sequences.
By exploring cluster of reactions shared in phylogenetic groups (as shown in Supplemental Fig. S12), results of AuCoMe could pave the way to the identification of gene candidates for enzymatic reactions. We analyzed a cluster of 14 reactions present in C. okamuranus and S. japonica but absent in other brown algae (see Supplemental Table S8). Among those 14 reactions, 12 were enzymatic reactions assigned based on annotations, but orthology propagation in the AuCoMe pipeline identified only a subset of the potential orthologs (see Supplemental Table S9). A focus was made on the o-aminophenol oxidases. Comparative genomics analysis using sequences from additional BLASTP searches showed that potential homologs were present for the other brown algae (see Supplemental Fig. S13). The o-aminophenol oxidase family proteins present in the genome of E. siliculosus are predicted to be cytoplasmic or extracellular or to target the membrane (see Supplemental Table S10), suggesting different roles depending on their subcellular localization. In this case, AuCoMe, with the support of more focused analyses, led to the identification of numerous candidate o-aminophenol oxidases in Stramenopiles.
By exploring the group of Stramenopiles in the final GSMN dendrogram (Fig. 5D), we noticed that it grouped with the small unicellular alga G. theta, which belongs to the cryptophytes, usually grouping with the archeplastids (Fig. 5C) or the haptophytes. Its plastid is derived from a secondary endosymbiosis event with a red alga (Curtis et al. 2012). The phylogenetic position of cryptophytes is unclear, but they have been suggested to be phylogenetically separate from haptophytes closer to the green algae lineage (Burki et al. 2012). To further examine the position of G. theta in our metabolic trees, we analyzed the presence/absence matrix of metabolic reactions to determine which of them most clearly linked G. theta to each of the three groups in question (Stramenopiles, archeplastids, haptophytes). We focused on reactions that distinguished at least two of these groups, namely, that were present in at least 80% of the networks of at least one group and absent from at least one other group (Supplemental Table S11). A total of 216 reactions met this criterion, 109 of which were found in G. theta and 107 were absent. We found that the network of G. theta shared the presence or absence of a similar number of distinctive reactions with all three groups: 120 with Stramenopiles, 112 with haptophytes, and 101 with archeplastids.
Next, we examined the metabolic pathways represented by the reactions that associated G. theta with the three groups, focusing on pathways that were >50% complete. The metabolic networks showed, for instance, that G. theta (1) possesses, like haptophytes in our data set, parts of the mitochondrial L-carnitine shuttle pathway, (2) comprises, like the Stramenopiles, the complete pathway of glycine betaine synthesis, and (3) can synthesize, like terrestrial plants, carnosine. We also manually examined the genes associated with these reactions and found that, in all cases, their sequences differed strongly from other sequences in the database and could not be clearly associated with either archeplastids, Stramenopiles, or haptophytes (see Supplemental Table S12).
These examples underline the fact that cryptophytes diverged from the other lineages early in the history of eukaryotes and support the hypothesis that the metabolic capacities of extant cryptophytes might reflect adaptation to their specific environment more clearly than their ancient evolutionary history.
Discussion
Numerous sequencing projects and available annotation approaches generate heterogeneously annotated data. There is currently a need to homogenize annotations to make them comparable for wider-scale studies. In this work, we introduced a method to automatically homogenize functional predictions across heterogeneously annotated genomes for large-scale metabolism comparisons between species across the tree of life. We illustrated how the tool can be applied both to prokaryotes and eukaryotes, even with high levels of annotation degradation.
Accounting for existing annotations in the inference of homogenized GSMNs
Automatic inference of single-species GSMNs is now routinely achieved, especially for prokaryotic species, and is often systematically performed for multiple genomes. With such data at hand, one may compare the predicted metabolism among related species from a given clade and subsequently identify metabolic specificities or putative functional interactions in microbial communities (Frioux et al. 2018; Machado et al. 2018). Such applications require consistent genome quality and similar data treatment (genome annotation, metabolic network reconstruction) to minimize biases in predictions. However, ensuring the latter is complex for eukaryotic genomes, as their enzymatic functions are difficult to characterize automatically and as they often need expert annotation. Moreover, annotation efforts can greatly vary between genomes, resulting in heterogeneous annotation and metabolic prediction quality. As the automatization of both (meta)genome reconstruction and annotation is now routinely applied, it is likely that efforts toward manual annotation will decline. However, we believe the need to manually curate annotations will remain (Karimi et al. 2021). In addition, AuCoMe could also be used to homogenize annotations in several genome versions of the same species or to reconcile several annotations performed on the same genome.
We have shown above that the performance of AuCoMe is superior to or on par with other commonly used reconstruction pipelines, notably gapseq, ModelSEED, and CarveMe. The originality of our metabolic inference method resides in the possibility to account for, and preserve, available expert genome annotations. Not considering the genome annotations performed by specialists may lead to the omission of unique metabolic functions that are not well described in reference databases. On the other hand, comparing metabolic networks built from well-curated annotations to those built from poorly or automatically annotated genomes will result in biases. In such cases, real metabolic differences between species cannot be distinguished from missing annotations in some genomes. AuCoMe constitutes a solution to such challenges through the propagation of expert annotations to less-characterized genomes in the process of metabolic network reconstruction. By accounting for possibly missing functional, but also structural, annotations in the input genomes, the resulting metabolic networks are homogeneous and can therefore be directly compared in both prokaryotes and eukaryotes.
Method limitations and improvements
AuCoMe incorporates several strategies to optimize the method's selectivity and sensitivity. Together, these strategies collectively achieve comparable GSMN reconstruction with two objectives: having comparisons as homogeneous as possible given the initial heterogeneity and incompleteness of databases and, thus, identifying errors that can be corrected during further analysis.
A first limitation is illustrated by the comparison of AuCoMe reconstructions to the EcoCyc database considered as ground truth in our experiment. We observed that the GSMN automatically reconstructed from the reference genome substantially differs from the database. Extensive and systematic manual curation has been performed on this database since its creation in 1998, and we hypothesize that these efforts have not been all translated in the E. coli K–12 MG1655 annotations. As a result, several reactions were systematically missing from the automatic inferences provided by AuCoMe. This example illustrates the role of curation in producing high-quality models. The homogenization of metabolic inference proposed by AuCoMe does not aim at replacing this step but rather enabling an unbiased metabolic comparison between species.
Running AuCoMe on the bacterial data set highlighted the impact of a single highly annotated genome on metabolic inference. This data set included a single well-annotated reference genome of the E. coli K–12 MG1655 strain, which caused a number of reactions initially propagated by orthology from the E. coli K–12 MG1655 genome to others to be discarded by the AuCoMe filter. Reasoning on ortholog clusters, the filter implies that several congruent genome sources are mandatory to confidently achieve an annotation propagation. Although the relevance of the filter was shown on the algal data set by avoiding the propagation of annotations related to photosynthesis to nonphotosynthetic organisms, it may be too stringent in some applications. Several improvements of the filtering approach could be devised. For example, the structural annotation step could be improved: The annotation of pseudogenes in Shigella species would have been avoided by considering the annotations as pseudogenes available for the identified loci. More generally, in addition to the difficulties of automatically estimating protein homology, the link between orthology and conservation of function is still a matter of active investigation and methodological debate (Stamboulian et al. 2020; Begum et al. 2021).
Finally, we want to emphasize that our attempts to limit the inference of false-positive reactions also directed the choice of method for the initial draft metabolic inference. We used Pathway Tools because of its several advantages such as the capacity to work with eukaryotic genomes, the suitability for parallel computing (Belcour et al. 2020a), and the possibility to limit gap-filling of metabolic networks. However, metabolic pathway completion performed by Pathway Tools does not systematically extend to ensuring the production of biomass. Pathway Tools was therefore adapted to our objective of avoiding to go beyond the strict interpretation of genome annotations. This goal was fulfilled, as attested by the benchmark shown in Supplemental Figure S4, which confirms that AuCoMe GSMNs have, by design, no reaction lacking gene association.
A typical use for GSMNs is their simulation, generally with flux-based approaches. As AuCoMe performs a homogenization step on GSMNs but does not provide de novo annotation, using AuCoMe without further curation might lead to missing reactions in organisms. In addition, the complexity of eukaryotes and their strong dependency on their environment make it difficult to provide a flux-based simulation-ready gap-filled model that would minimize the risk of adding false positives. For further simulation studies, GSMNs built with AuCoMe therefore still need to be gap-filled and curated (Karp et al. 2018b; Latendresse and Karp 2018). However, regarding the reactions that are present in at least one GSMN reconstructed by AuCoMe, the tool ensures that their absence in other organisms is true. In that sense, AuCoMe reduces the need for curation.
Biological insights from comparison of metabolic networks across species
Evolution
Our examples of the Calvin cycle and phycobiliprotein synthesis show that, once all steps of the AuCoMe pipeline have been executed, the predicted metabolic capacities of the analyzed genomes reflect the biological knowledge we have of the corresponding organisms. Our approach, therefore, enables GSMNs to be compared in the light of evolutionary biology. The metabolic dendrogram calculated from the final AuCoMe reconstruction is mostly consistent with reference-species phylogeny. Indeed, numerous studies have shown that comparing GSMNs by computing a metabolic distance and arranging them into a dendrogram allows clustering organisms into groups close to the ones known by phylogenetic analysis. However, the position of species inside these groups is often different from the one of the phylogenetic groups (Vieira et al. 2011; Bauer et al. 2015; Prigent et al. 2018; Schulz and Almaas 2020). It furthermore gives support to the hypothesis of a metabolic clock based on the congruence between molecular and metabolomic divergence in phytoplankton (Marcellin-Gros et al. 2020). The difference observed in the tanglegram (Fig. 5B) between phylogeny and metabolic distances could be further explored. One possibility could be to look at different similarity measures for the clustering. In this work, the Jaccard distance has been used but other measures could be used. For example, if we consider an absence of a reaction in two organisms as a similarity (to represent the loss of a function) then other measures could be envisaged such as the Simple Matching Coefficient. This also opens the perspective of inferring ancestral metabolic networks to better understand the dynamics of character evolution across time (Psomopoulos et al. 2020).
Adaptation
The second aim of reconstructing comparable GSMNs is to determine to what extent metabolic changes are the result of or the prerequisite for adaptation. In our study, we made a first attempt at this question regarding the cryptophyte G. theta. This species has several potentially plesiomorphic metabolic traits in common with other marine lineages, which may constitute adaptations to their shared marine environment. Glycine betaine, for instance, is known to be an osmoregulator or osmoprotectant in green plants (Di Martino et al. 2003), and carnosine has been proposed to function as an antioxidant in red algae (Tamura et al. 1998). Regarding carnitine, its physiological significance in photosynthetic organisms is still largely unknown, but antioxidant and osmolyte properties along with signaling functions have also been suggested (Jacques et al. 2018). However, for now, all of this remains purely hypothetical. To dig deeper into such questions in the future, we need to be able to distinguish changes that simply result from random processes, such as metabolic drift (Belcour et al. 2020b), from changes that have an adaptive value. Currently, we envision two approaches that will help with this distinction. The first approach will be to further increase the number of species and lineages included in order to identify adaptive patterns, for example, among organisms occupying similar ecological niches. In phylogenomics, wide taxon sampling is recognized as one of the key features for reliable comparisons (Young and Gillung 2020), whereas pairwise genomic comparisons across species are generally viewed as problematic (Dunn et al. 2018). Given that, as shown above, phylogenetic signals in metabolism are stronger than the adaptive signals we can expect, this approach would also benefit from the development or adaptation of statistical models that could help detect signals of adaptation in an overall noisy data set. Such models exist, for instance, to detect selective signatures in the evolution of the protein-coding gene (Shapiro and Alm 2008) but, to our knowledge, have not been developed for metabolic networks or presence/absence signatures of genes. The second related strategy consists in focusing on phylogenetically closely related species that have only recently diverged and adapted to different environments. In such cases, we anticipate that the relative importance of drift along with the noise from the phylogenetic signal will be reduced owing to the short evolutionary time since the separation. With such data sets, we may be able to reduce the level of replication required to find biologically relevant metabolic adaptations. The range of questions that could be addressed with the appropriate data set is long and includes metabolic adaptations to different environments (Xu et al. 2020), food sources and domestication (Giannakou et al. 2020), multicellularity (Cock et al. 2010), or even life-history transitions to endophytism (Bernard et al. 2019).
Interactions
Lastly, we anticipate that AuCoMe will provide new opportunities to study metabolic interactions between symbiotic organisms. For example, the tentative o-aminophenol oxidase activities pointed out by AuCoMe in brown algae could be involved in the protection against pathogen attacks at the cell surface. Indeed, a molecular oxygen-scavenging function in the chloroplast (Constabel et al. 1995) and a defense role (Gandía-Herrero et al. 2005) have been suggested for these enzymes in terrestrial plants. An o-aminophenol oxidase Streptomyces griseus is known to be involved in the grixazone biosynthesis, that is, an antibiotic (Suzuki et al. 2006). Similarly, brown algal o-aminophenol oxidases or tyrosinases might be involved in the production of specific antibiotics. The o-aminophenol oxidase enzymes resemble laccases or tyrosinases. They can be involved in catechol or pigment production by oxidation (Le Roes-Hill et al. 2009). Numerous references have also shown that tyrosinases are efficiently inhibited by some phlorotannins, antioxidant compounds specific to the brown algae (Kang et al. 2004; Manandhar et al. 2019), suggesting there might be a regulation of polyphenol oxidation in certain conditions.
In the same vein, metabolic complementarity has previously been used to predict potentially beneficial metabolic interaction between a host and its associated microbiome (Frioux et al. 2018) and to successfully predict metabolic traits of the communities (Burgunter-Delamare et al. 2020). These studies have, so far, examined large numbers of symbionts (all sequenced and annotated with identical pipelines), but usually they consider one specific host whose metabolic network was manually curated. With AuCoMe, these previous efforts could be expanded to incorporate a range of different hosts with their associated microbiota, thus facilitating the identification of common patterns in host–symbiont metabolic complementarity as well as their differences in these complementarities across different species and lineages. Just as for the question of adaptation, we believe this new scale of comparisons enabled by tools such as AuCoMe will enable researchers to move from the study of specific examples to the identification of general trends, thus approaching the biologically most relevant evolutionary constraints.
Methods
Genomes and models
The bacterial data set includes the 29 bacterial E. coli and Shigella strains studied previously (Vieira et al. 2011), downloaded from public databases (see Supplemental Table S1).
The fungal data set includes 74 fungal genomes which were selected according to the method of Wang et al. (2009) as representative of the fungal diversity, together with three outgroup genomes: Caenorhabditis elegans, Drosophila melanogaster, and Monosiga brevicollis. All proteomes and genomes were downloaded from the NCBI Assembly Database (Kitts et al. 2016). See Supplemental Table S2.
The algal data set contains 36 algal genomes selected to represent a wide diversity of photosynthetic eukaryotes and downloaded from public databases. The data set includes 16 Viridiplantae (green algae), five Phaeophyceae (brown algae), five Rhodophyceae (red algae), four diatoms, three haptophytes, one cryptophyte (G. theta), one Eustigmatophyceae (N. gaditana), and one Glaucophyceae (C. paradoxa). The genomes of C. elegans (Witting et al. 2018), Mucor circinelloides (Vongsangnak et al. 2016), N. crassa (Dreyfuss et al. 2013), and S. cerevisiae (Lu et al. 2019) were selected as outgroup genomes (see Supplemental Table S3).
Each annotated genome of the data sets was curated manually in order to make it compatible with Pathway Tools v23.5. Curated genomes are available at Zenodo (https://doi.org/10.5281/zenodo.7851053).
AuCoMe, a method to reconstruct GSMNs homogenized across related species
AuCoMe is a Python package implementing a pipeline whose steps are described in Figure 1. The method aims at producing homogenized GSMNs for a set of heterogeneously annotated genomes containing closely related or outlier species of a taxonomic group. AuCoMe takes as input GenBank files containing the genome sequences, the structural annotation of the genomes (gene and protein locations), the functional annotations (especially with GO terms and EC numbers), and the protein sequences. The output of AuCoMe is a set of GSMNs, provided in SBML and PADMET formats (Aite et al. 2018; Hucka et al. 2018). AuCoMe also produces a global report describing the sets of reactions added at all steps of the pipeline. The global panmetabolism, which is the complete family of metabolic reactions included in at least one GSMN of the set of genomes, is described in a tabulated file.
At the initialization step, the command aucome init creates a template folder in which the user puts the input GenBank files.
The aucome reconstruction command runs the draft reconstruction step, which consists in reconstructing draft GSMNs according to the set of available genome annotations. During this step, the pipeline first checks the input GenBank files using Biopython (Cock et al. 2009). Then using the mpwt package (Belcour et al. 2020a), AuCoMe launches parallel processes of the PathoLogic algorithm of Pathway Tools (Karp et al. 2019). Pathway Tools creates Pathway/Genome Databases (PGDBs) for all genomes. The resulting PGDBs are converted into PADMET and SBML files (Hucka et al. 2003, 2018) using the PADMet package (Aite et al. 2018). During this conversion, pathway hole reactions (reactions predicted by Pathway Tools for which no enzymes were detected in the genomes) are removed as they are not associated with a gene and are not spontaneous reactions. For example, in Figure 1A, the draft reconstruction step generates six GPRs in total for the three considered genomes.
The aucome orthology command runs the orthology propagation step, which complements the previous GSMNs with GPR associations whose genes are predicted to be orthologs to genes from GPR relations of other GSMNs of the data set (Fig. 1B). To that purpose, the pipeline relies on OrthoFinder (Emms and Kelly 2015, 2019) for the inference of orthologs defined as clusters of homologous proteins shared across species. For each pair of orthologous genes shared between two species, the pipeline checks whether one of the genes is associated with an existing GPR association. If so, a putative GPR association with the orthologous gene is added to the GSMN. At the end of the analysis of all genomes, a robustness score is calculated for assessing the confidence of each putative GPR association based on the number of annotated GPR associations between the orthologs (see below). Nonrobust GPR associations are not integrated in the final GSMNs. In the example shown in Figure 1B, applying the robustness criteria leads to generating a putative new GPR association in the GSMN 2 (see the green orthogroup). In this example, the pipeline does not validate the GPR association related to the blue orthogroup because of insufficient annotation support.
The aucome structural command runs the structural verification step to identify GPRs associated with missing structural annotations of the input genomes. This pipeline step complements GSMNs with GPR associations from other GSMNs according to protein-against-genome alignment criteria. This enables the identification of reactions that are associated with gene sequences absent from the initial structural annotations of the input genomes. A pairwise comparison of the reactions in the GSMNs produced during the previous step is performed (Fig. 1C). In this comparison, if a reaction is missing in an organism, a structural verification will be performed. For each protein sequence associated with a GPR relation in a GSMN, a TBLASTN (Altschul et al. 1990; Camacho et al. 2009) with Biopython (Cock et al. 2009) is performed against the other genome. If a match (e-value <1 × 10⁻²⁰) is found, the gene prediction tool Exonerate (Slater and Birney 2005) is run on the region linked to the best match (region ± 10 kb). If Exonerate finds a match, then the reaction associated with the protein sequence is added. In Figure 1C, one reaction is added to the GSMN 2.
The command aucome spontaneous runs the spontaneous completion step to fill metabolic pathways with spontaneous reactions, in order to complement each GSMN obtained after the structural completion step with spontaneous reactions. For each pathway of the MetaCyc database (Caspi et al. 2020) that was incomplete in a GSMN, AuCoMe checks whether adding spontaneous reactions could complete the pathway. When this is the case, the spontaneous reaction is added to the GSMN. In Figure 1D, two spontaneous reactions are added to the GSMN 1 and GSMN 3. Then, the final PADMET and SBML files are created for each studied organism.
Robustness criteria for GPR association predicted by orthology
The robustness score of GPR associations of the panmetabolic network after the orthology propagation was defined as illustrated
in Algorithm 1 and detailed in the following. We denote by org(g) the organism of a gene g. For every pair of genes g1, g2 of two different organisms, we denote orth(g1, g2) = 1 if the genes are predicted to be orthologs. We denote by association(r, g) = 1 a GPR association between a reaction r and a gene g that is predicted by the AuCoMe algorithm. When the gene association is predicted by the draft reconstruction step, we denote
 (and zero otherwise). When the gene association is predicted according to orthology criteria, we denote
  (and zero otherwise).
Let us consider now a reaction r of the panmetabolic network. We denote by  the number of organisms for which the reaction r has been associated with a GPR relationship with any gene g:
  (L2, Algorithm 1). For every gene g with
  , we denote by
  the number of organisms different from org(g) the GPR association between r and g has been propagated to according to an orthology relation with the gene
 . The GPR association between r and g is considered robust: robust(r, g) = 1 as long as
  .
.
The robustness assessment of a GPR between r and g propagated by orthology (L7, Algorithm 1) distinguishes two scenarios. In the first scenario, g belongs to an orthology cluster that is supported by at least two annotations. Formally, this means that there exist two
genes, g1 to g2, both orthologs to g, such that  and
and 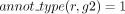 . The presence of these genes leads us to consider g robustly associated with r (L8–L9, Algorithm 1).
In the second scenario, the GPR association between r and g was propagated from a unique gene g1 with  in the orthology cluster (L11, Algorithm 1). For these genes, our strategy is to be as stringent as possible, and we introduce a robustness criterion to reduce the
risk of propagating false-positive reactions. The GPR association is considered robust if the number of organisms to which
the reaction is propagated according to the annotation of g1 remains low with respect to the total number of considered organisms. More precisely, robust(r, g) = 1 if
in the orthology cluster (L11, Algorithm 1). For these genes, our strategy is to be as stringent as possible, and we introduce a robustness criterion to reduce the
risk of propagating false-positive reactions. The GPR association is considered robust if the number of organisms to which
the reaction is propagated according to the annotation of g1 remains low with respect to the total number of considered organisms. More precisely, robust(r, g) = 1 if  (L12–L13, Algorithm 1). The robustness function
 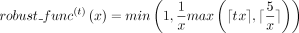 was chosen such that it is one for low values of
  and then decreases to a threshold value (by default t = 0.05) for large values of
  (see a plot in Supplemental Fig. S14).
Altogether, the robustness criterion removes orthology predictions for GPR associations that are supported by a unique gene annotation and propagated to a large number of organisms. A toy example of the application of the algorithm is detailed in Supplemental Methods Section and Supplemental Fig. S15.
Robustness criterion algorithm
1: for r in panmetabolism do
2:  ▹ Number of organisms with GPR relations to r
3: for all genes g s.t.  do
do
4: robust(r, g) = 1
5: 
 ▹ Number of organisms to which the GPR has been propagated
6: end for
7: for all genes g s.t.  and
and  do ▹ Restrict the family of gene candidates to be associated with a new reaction
8: if  and
and  then ▹ At least two annotations support the GPR relation
9: robust(r, g) = 1
10: else ▹ Prevent the propagation of an isolated annotation to too many organisms
11: g1 ← unique gene s.t. orth(g,g1) = 1 and 
12: if  then
then
13: robust 
14: else
15: robust 
16: end if
17: end if
18: end for
19: end for
Validation of AuCoMe predictions
A first experiment was performed on the bacterial data set, for which we reconstructed the metabolic networks (29 bacteria containing strains of E. coli) using CarveMe 1.5.1 (Machado et al. 2018) with default parameters, gapseq 1.2 (Zimmermann et al. 2021) with default parameters, and ModelSEED with KBase. For the latter, we first imported the genomes and annotated them with “bulk annotate genomes/assemblies with RASTtk–v1.073” (Aziz et al. 2008; Overbeek et al. 2014; Brettin et al. 2015) and then reconstructed the models with “build multiple metabolic models” 2.0.0 (Henry et al. 2010). We compared the ECs predicted by these methods to the ones contained in a reference EC catalog for E. coli K–12 MG1655 created from four databases (KEGG, EcoCyc, ModelSEED, and BiGG). For more information on the reference EC catalog, see the Supplemental File (section “Methods”).
A second comparison was made on the eukaryotes and especially the fungal data set (using five organisms: Laccaria bicolor, N. crassa, Rhizopus oryzae, S. cerevisiae S288C, and Schizosaccharomyces pombe). We used KBase (Arkin et al. 2018) and gapseq 1.2 (Zimmermann et al. 2021). The genomes were imported into KBase, and the metabolic networks were reconstructed with “build fungal model” 1.0.0 (with gap-filling). We also used gapseq to predict the metabolic pathways present in an organism using its find module associated with the option “-t Fungi.” We did not use CarveMe as it has been developed for bacteria or archaea (Capela et al. 2022). We compared the completion rate of metabolic pathways predicted by AuCoMe and gapseq. Then for S. cerevisiae S288C, we used the reference network YeastCyc to estimate the quality of the pathways predicted by both gapseq and AuCoMe.
In a third evaluation, 100 random GPR associations were randomly selected and examined across the metabolic networks generated by AuCoMe for the algal data set. Among them were 50 reactions that were predicted to be present and 50 reactions that were predicted to be absent in the metabolic networks. Regarding the former, their first associated gene was manually annotated based on reciprocal BLAST searches against UniProt (Bateman et al. 2021) and the presence of conserved domains, and the result of this manual annotation was compared with the predicted metabolic reaction. For absent reactions, we searched for characterized proteins known to catalyze the reaction in question and then performed reciprocal BLASTP searches with the corresponding algal proteome.
A fourth experiment was performed to analyze the results of the orthology propagation and the robustness filter. DeepEC (version 0.4.0) (Ryu et al. 2019) was applied both to fungal and algal protein sequences. This tool predicts EC numbers for protein sequences. We extracted the EC numbers of reactions for which at least one GPR association was predicted according to orthology propagation for all reactions of the fungal and the algal data sets. For each EC number, we extracted the protein sequences associated with the considered reaction in the GSMNs, and we used DeepEC to infer an EC number for these proteins. Then we compared the EC number found by DeepEC (if found) to the EC number linked to the reaction by the pipeline.
Finally, the complementarity between the orthology propagation step (second step) and the structural verification step (third step) was assessed using the E. coli K–12 MG1655 genome modified to generate replicates with randomly degraded annotations associated with GPR of the nondegraded E. coli K–12 MG1655 GSMN. Two degradation types were simulated: (1) a degradation of the functional annotations of the genes, in which all the annotations like GO terms, EC numbers, gene names, etc., associated with a reaction were removed, and (2) a degradation of the structural annotation of the genes, in which gene positions and functional annotations were removed from the genome annotations. A third type of replicate was considered, including the degradation of both structural and functional annotations. Replicates with increasing percentages of degraded annotations were generated for each of the three types of degradation. Details on the degradation algorithm are shown in the Supplemental File (section “Methods”). Furthermore, the taxonomic ID associated with the E. coli K–12 MG1655 genome was degraded to cellular organism to focus on the impact of genome annotations on GSMN reconstructions by AuCoMe rather than on the effect of the automatic completion by the EcoCyc source performed by Pathway Tools when analyzing E. coli K–12 MG1655. Each degraded replicate was associated with the 28 other E. coli and Shigella genomes, generating 31 synthetic bacterial data sets, plus the data set with nondegraded E. coli K–12 MG1655 genome, which was called data set 0. Their characteristics are detailed in Supplemental Table S4. For each E. coli K–12 MG1655 replicate in a data set, AuCoMe produced a GSMN, which was compared with EcoCyc, considered as ground truth (Karp et al. 2002, 2018a; Keseler et al. 2021). For more information on the computation of the F-measure, see the Supplemental File (section “Methods”).
Phylogenetic analysis of the brown algal o-aminophenol oxidases
A data set of 193 protein sequences was constructed using the closest homologs of the S. japonica o-aminophenol oxidase (SJ09941) in brown algae and extended to more distant sequences present in other organisms. Sequences were submitted to NGPhylogeny.fr via the “A la carte” (Lemoine et al. 2019) pipeline. The alignment was performed by MAFFT (Katoh and Standley 2013) using default parameters and automatically cleaned with trimAl (Capella-Gutiérrez et al. 2009) to obtain 372 informative positions. Then a maximum likelihood phylogenetic reconstruction was performed using the default parameters of the PhyML-SMS tool (Guindon et al. 2010; Lefort et al. 2017), allowing the best substitution model selection. Bootstrap analysis (Lemoine et al. 2018) with 100 replicates was used to provide estimates for the phylogenetic tree topology. The Newick file (Junier and Zdobnov 2010) was further formatted by MEGA v10.1.1 (Tamura et al. 2021) to obtain the simplified dendrogram (see Supplemental Fig. S13).
Software availability
AuCoMe is a Python package under GPL-3.0 license, available through the Python Package Index at https://pypi.org/project/aucome. The source code and the complete documentation are freely available at GitHub (https://github.com/AuReMe/aucome) and as Supplemental Code.
Running AuCoMe on the data sets studied in the paper required as dependencies BLAST v2.6.0 (Altschul et al. 1990), DIAMOND v0.9.35 (Buchfink et al. 2015), Exonerate v2.2.0 (Slater and Birney 2005), FastME v2.1.15 (Lefort et al. 2015), MCL (Enright et al. 2002), MMseqs2 v11-e1a1c (Steinegger and Söding 2017), OrthoFinder v2.3.3 (Emms and Kelly 2015, 2019), and Pathway Tools v23.5 (Karp et al. 2019). The following Python packages are needed to install AuCoMe: Matplotlib, mpwt v0.6.3 (Belcour et al. 2020a), padmet v5.0.1 (Aite et al. 2018), rpy2 v3.0.5, seaborn, supervenn, and tzlocal. The pvclust R package is also required.
A docker or a singularity container can be created and enriched according to the dockerfile available on GitHub (https://github.com/AuReMe/aucome/blob/master/recipes/Dockerfile). A version of AuCoMe, PADMet source code, and the scripts used to run some figures is available at Zenodo (https://doi.org/10.5281/zenodo.7752449) and as Supplemental Files S1–S14.
Competing interest statement
The authors declare no competing interests.
Acknowledgments
We thank the GenOuest bioinformatics core facility (https://www.genouest.org) for providing the computing infrastructure. We also thank Erwan Corre (ABiMS Platform) and Pauline Hamon-Giraud for fruitful discussions. This work benefited from the support of the French government via the National Research Agency investment expenditure program IDEALG (ANR-10-BTBR-04) and from Région Bretagne via the grant SAD 2016-METALG (9673).
Author contributions: A.B. was responsible for conceptualization, data curation, methodology, formal analysis, software, validation, visualization, writing the original draft, and reviewing and editing. J.G. was responsible for data curation, formal analysis, resources, software, validation, visualization, writing the original draft, and reviewing and editing. M.A. was responsible for conceptualization, data curation, methodology, and software. L.D. was responsible for formal analysis, validation, writing the original draft, and reviewing and editing. J.C. was responsible for formal analysis, validation, and reviewing and editing. C.F. was responsible for methodology, software, visualization, writing the original draft, and reviewing and editing. C.L. was responsible for funding acquisition, writing the original draft, and reviewing and editing. S.M.D. was responsible for conceptualization, data curation, formal analysis, funding acquisition, methodology, validation, writing the original draft, and reviewing and editing. S.B. was responsible for conceptualization, methodology, writing the original draft, and reviewing and editing. G.V.M. was responsible for data curation, formal analysis, methodology, supervision, validation, visualization, writing the original draft, and reviewing and editing. A.S. was responsible for conceptualization, formal analysis, funding acquisition, methodology, supervision, writing the original draft, and reviewing and editing.
Footnotes
-
[Supplemental material is available for this article.]
-
Article published online before print. Article, supplemental material, and publication date are at https://www.genome.org/cgi/doi/10.1101/gr.277056.122.
- Received June 22, 2022.
- Accepted May 23, 2023.
This article is distributed exclusively by Cold Spring Harbor Laboratory Press for the first six months after the full-issue publication date (see https://genome.cshlp.org/site/misc/terms.xhtml). After six months, it is available under a Creative Commons License (Attribution-NonCommercial 4.0 International), as described at http://creativecommons.org/licenses/by-nc/4.0/.


