
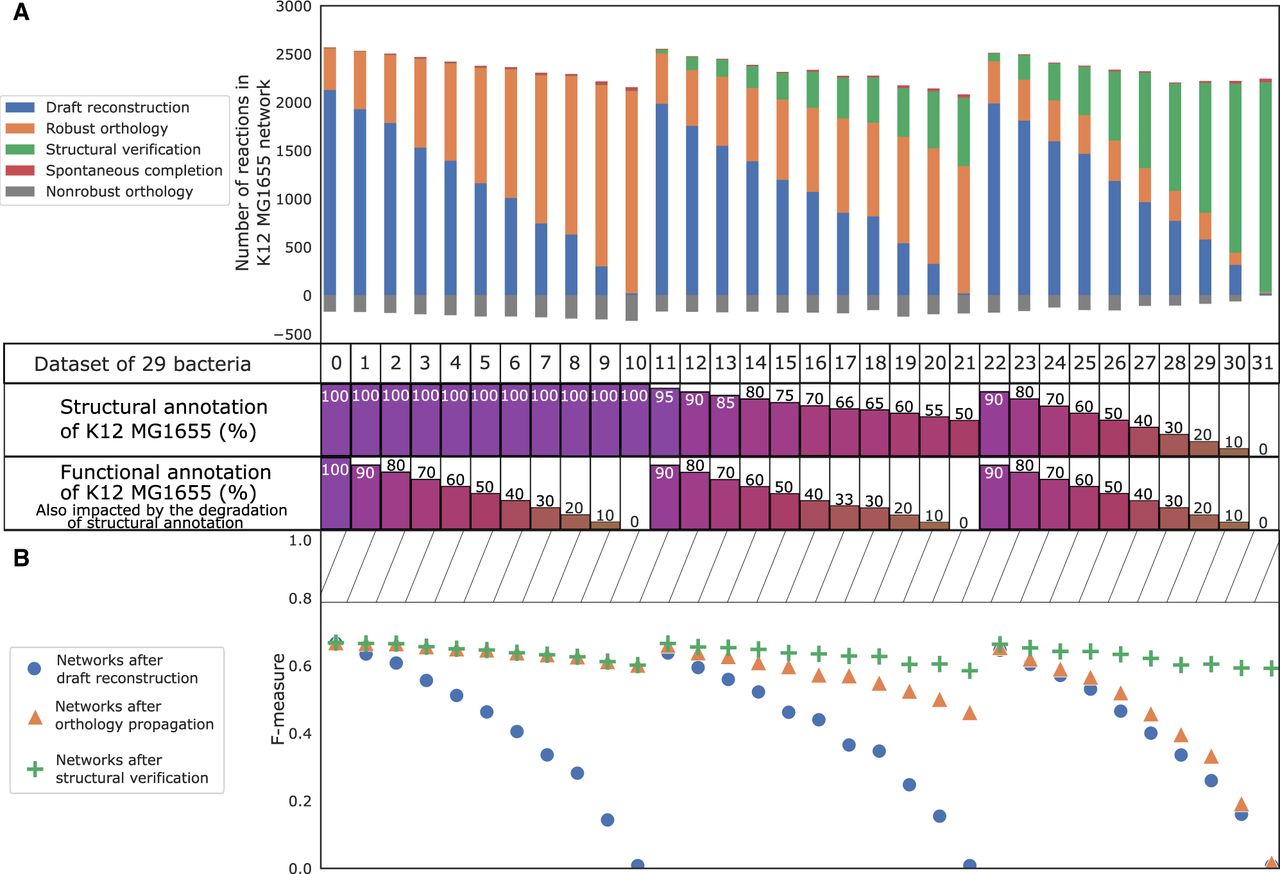
Efficiency of AuCoMe on degraded genome assemblies. (A) Number of reactions in E. coli K–12 MG1655 degraded networks after application of AuCoMe to 32 synthetic bacterial data sets. Each data set consists of the genome of E. coli K–12 MG1655, to which degradation of the functional and/or structural annotations was applied, together with 28 bacterial genomes. Each vertical bar corresponds to the result on the E. coli K–12 MG1655 within a synthetic data set, with the percentages of degraded annotations indicated below. The data set labeled “zero” was not subject to degradation of the E. coli K–12 MG1655 annotations. Three types of degradation have been performed: functional annotation degradation only (left side; data sets labeled one to 10), structural annotation degradation only (right side; data sets labeled 22 to 31), and both degradation types (middle; data sets labeled 11 to 21). The colored bars depict the number of reactions added to the degraded network at the different steps of the method (the blue, orange, green, gray, and red color legends are as described in Fig. 2). The table shown as axis indicates the data set number and the percentage of functional or structural annotation impacted by the degradation for the corresponding column in both subfigures. (B) F-measures after comparison of the GSMNs recovered for each E. coli K–12 MG1655 genome replicates with a gold-standard network. Reactions inferred by each AuCoMe step for each replicate were compared with the gold-standard EcoCyc GSMN, allowing for the computation of F-measures. F-measures obtained after the draft reconstruction step, the orthology propagation step, or the structural verification step are shown as blue circles, orange triangles, and green crosses, respectively. The hashed rectangle from F-measure 0.79 to one highlights the values of F-measure, which are unreachable because 1019 reactions in EcoCyc were not present in the panmetabolism of the 29 nondegraded bacteria.


