
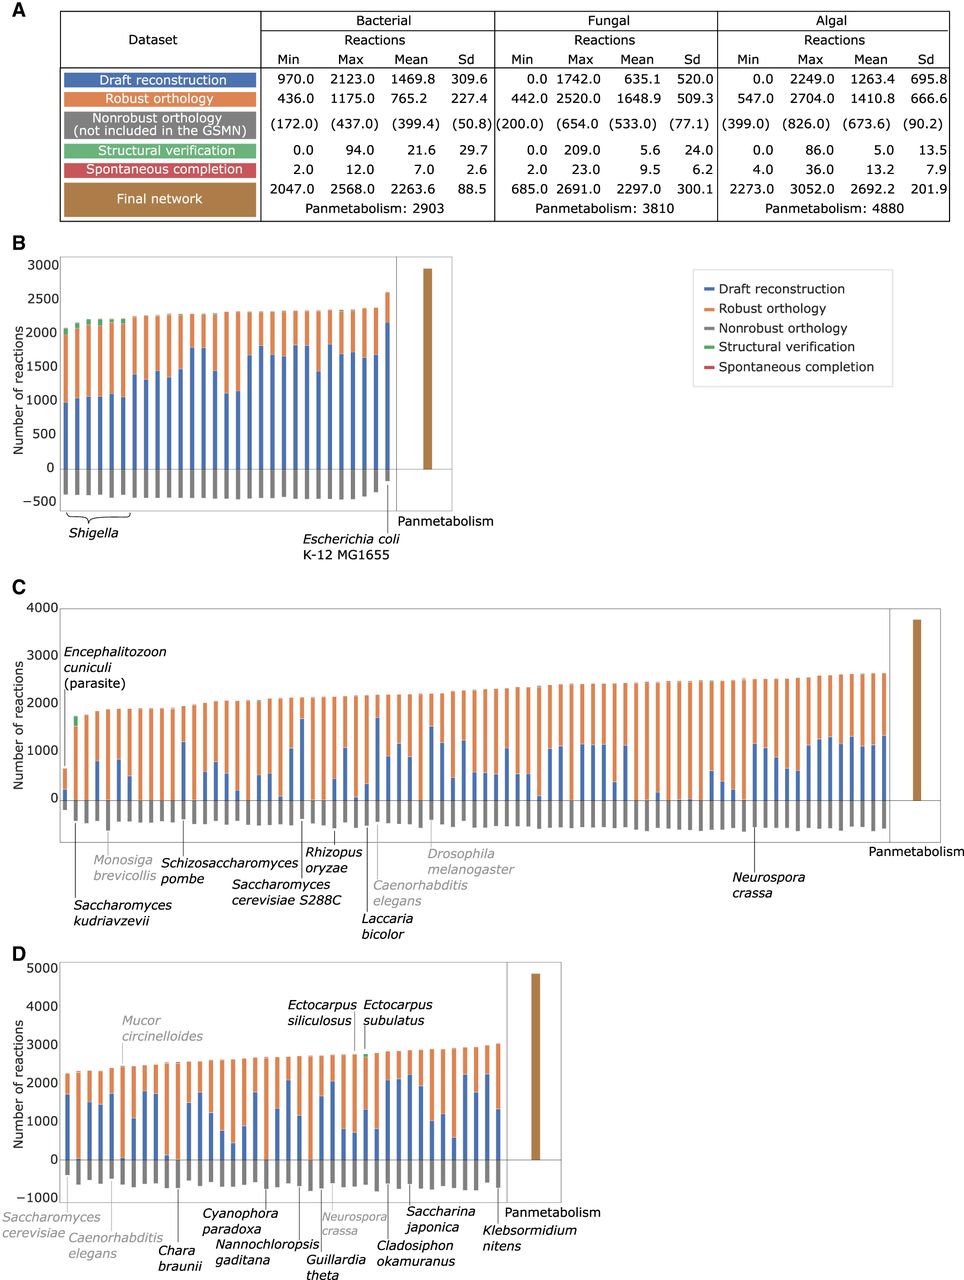
Application of the AuCoMe pipeline to the bacterial, fungal, and algal data sets of genomes. The summary table (A) depicts the number of reactions identified for each species at each step of the AuCoMe pipeline: reactions recovered by the draft reconstruction step (blue), unreliable reactions predicted by orthology propagation and removed by the filter (gray), robust reactions predicted by orthology propagation that passed the filter (orange), additional reactions predicted by the structural verification step (green), and spontaneous completion (red). The final metabolic networks encompass all these reactions except the nonreliable ones. Panels B–D illustrate the results for each genome of the three data sets. The panmetabolism of each data set (all the reactions occurring in any of the organisms after the final step of AuCoMe) is presented in brown in B–D. Organisms with gray labels are outgroups. See also Supplemental Figures S1–S3.


