
Linking the dynamics of chromatin occupancy and transcription with predictive models
Abstract
Though the sequence of the genome within each eukaryotic cell is essentially fixed, it exists within a complex and changing chromatin state. This state is determined, in part, by the dynamic binding of proteins to the DNA. These proteins—including histones, transcription factors (TFs), and polymerases—interact with one another, the genome, and other molecules to allow the chromatin to adopt one of exceedingly many possible configurations. Understanding how changing chromatin configurations associate with transcription remains a fundamental research problem. We sought to characterize at high spatiotemporal resolution the dynamic interplay between transcription and chromatin in response to cadmium stress. Whereas gene regulatory responses to environmental stress in yeast have been studied, how the chromatin state changes and how those changes connect to gene regulation remain unexplored. By combining MNase-seq and RNA-seq data, we found chromatin signatures of transcriptional activation and repression involving both nucleosomal and TF-sized DNA-binding factors. Using these signatures, we identified associations between chromatin dynamics and transcriptional regulation, not only for known cadmium response genes, but across the entire genome, including antisense transcripts. Those associations allowed us to develop generalizable models that predict dynamic transcriptional responses on the basis of dynamic chromatin signatures.
Organisms require transcription to produce the proteins necessary for biological functions like growth, replication, repair, and responses to environmental changes. Transcription is tightly regulated by the intricate interplay of myriad DNA-binding factors, including transcription factors (TFs), polymerases, and the histone octamers at the core of a nucleosome. The proteins and complexes involved in transcription, along with the many others that interact with DNA, determine the chromatin landscape. How these constituents of the chromatin bind, unbind, move, and interact to regulate transcription remains an open area of research.
Numerous studies have made major strides in characterizing the roles of protein complexes involved in transcription. Chromatin immunoprecipitation (ChIP) has been used to assay binding sites of hundreds of proteins on a genomic scale, including factors involved in SAGA-dominated stress-related pathways and TFIID-dominated housekeeping pathways (Venters et al. 2011). Likewise, studies have probed proteins involved in the formation of the pre-initiation complex required for transcription initiation (Rhee and Pugh 2012). The role of numerous chromatin remodelers and their interactions have been characterized in detail through ChIP, proteomics, and gene expression analysis of deletion mutants (Krogan et al. 2006; Mavrich et al. 2008; Shivaswamy and Iyer 2008; Lenstra et al. 2011; Weiner et al. 2012, 2015). However, limitations in these methods, including lack of antibodies for ChIP or viability of deletion strains, are often constraining. Analysis can be complicated by the difficulty in disentangling direct chromatin effects from the pleiotropic action of the many factors and remodelers that impinge upon transcription, often indirectly. These and other issues contribute to our still limited understanding of the dynamic interplay of the chromatin landscape and transcription.
An alternative approach has been to profile chromatin occupancy in a protein-agnostic manner using nuclease digestion. Digestion by a nuclease, such as micrococcal nuclease (MNase), provides a complementary perspective to understanding chromatin occupancy by probing accessibility at base-pair precision. Recent genome-wide mapping studies have used nucleosome-sized MNase-seq fragments to characterize the dynamics of nucleosomes under various conditions, including the cell cycle (Nocetti and Whitehouse 2016), DNA damage (Tripuraneni et al. 2021), and heat shock (Teves and Henikoff 2011). Additionally, studies have attempted to understand the roles of the smaller DNA-bound factors that correspond to subnucleosomal MNase-seq fragments (Henikoff et al. 2011; Teves and Henikoff 2011; Belsky et al. 2015; Chereji et al. 2017; Kubik et al. 2017; Ramachandran et al. 2017; Brahma and Henikoff 2019). These studies highlight the challenge of characterizing the vast heterogeneity of—and interactions among—proteins and complexes involved in DNA-mediated processes, including transcription.
Factor-agnostic chromatin occupancy profiles from MNase provide an opportunity to link changes in chromatin at nucleotide resolution with transcriptional regulation, especially regulation induced by environmental perturbations. Here, we utilize a high-resolution spatiotemporal stress response data set to elucidate the relationship between chromatin organization and gene expression by developing general strategies and models to analyze chromatin dynamics relative to changes in transcription, genome-wide.
Results
Paired-end MNase-seq captures high-resolution chromatin occupancy dynamics associated with transcription during cadmium stress
We sought to precisely characterize the dynamics of chromatin organization in yeast cells responding to cadmium stress, while simultaneously monitoring the large-scale changes to their transcriptional program. A nucleotide-resolution view of chromatin dynamics would allow us to associate and infer relationships between changes in transcription and in chromatin occupancy, at two different levels: the occupancy and organizational structure of nucleosomes, and the occupancy of smaller transcription-related proteins.
Yeast cells were exposed to cadmium and samples were collected over a two-hour time course. Chromatin occupancy and positioning dynamics were profiled using paired-end MNase-seq to map DNA-binding factors at base-pair resolution (Fig. 1A; Supplemental Method S1). Concurrently, transcripts were interrogated using strand-specific total RNA-seq (Fig. 1A; Supplemental Method S1).
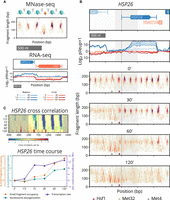
Paired-end MNase-seq and stranded RNA-seq capture high-resolution chromatin occupancy and transcriptome state throughout a perturbation time course. (A) Examples of MNase-seq and RNA-seq data. Top: Depiction of nucleosomes flanking a small (subnucleosomal) binding factor, and fragments that result upon digestion by MNase. Paired-end MNase-seq fragments appear in the typhoon plot based on their center position and length. Bottom: Strand-specific RNA-seq is plotted as the log of the pileup, the number of total RNA-seq reads at each genomic position, separately mapped to Watson (blue) and Crick (red) strands. RNA-seq levels over the time course are plotted using progressive coloring for each strand. (B) Beneath time course RNA-seq data, four typhoon plots show dynamics of MNase-seq data near HSP26 (gray shading highlights the [–200,+500] region around the TSS that we analyze for all genes). Nucleosomes in the promoter region are replaced by small fragments, and gene body nucleosomes disorganize. Small fragments appear around motifs for known regulators Hsf1 (red triangle), Met4 (green triangle), and Met32 (obscured by green triangle). (C) Plots of processed chromatin metrics around HSP26 over time. Top: Heat map of differential cross-correlation values through the time course, summarizing how gene body nucleosomes initially shift downstream and eventually disappear, and how promoter nucleosomes are rapidly displaced as small fragments accumulate. Higher values (more red) indicate higher cross-correlation with subnucleosomal fragments; lower values (more blue) indicate a stronger signal for nucleosomal fragments. Bottom: Line plot summarizing the change in occupancy of promoter small fragments (orange), disorganization of gene body nucleosomes (turquoise), and transcription rate (purple) of HSP26 over the time course.
To evaluate our data and methods, we considered the well-studied stress response gene HSP26, whose role is to facilitate the disaggregation of misfolded proteins (Cashikar et al. 2005). Hsp26 has been implicated in responses to many stress conditions, including heat shock (Franzmann et al. 2008; Benesch et al. 2010), acidity (Kawahata et al. 2006), sulfur starvation (Pereira et al. 2008), and metal toxicity (Momose and Iwahashi 2001; Hosiner et al. 2014). Furthermore, several transcription factors, including Hsf1, Met4, and Met32, have been found to bind in the well-characterized promoter of HSP26 (Susek and Lindquist 1990; Chen and Pederson 1993; Treger et al. 1998; Boy-Marcotte et al. 1999; Carrillo et al. 2012). Given this context, HSP26 serves as a useful test case because we understand many aspects of its local chromatin dynamics when it is activated under stress conditions.
We observed significant changes in the chromatin around the transcription start site (TSS) of HSP26 (Fig. 1B), coinciding with an increase in its transcript level. Upstream, in the promoter of HSP26, nucleosome-sized fragments of length 144–174 bp are replaced by small fragments of length <100 bp. In the gene body of HSP26, nucleosome-sized fragments become “fuzzy,” increasing in positional and fragment-length variability. Nucleosomes upstream of HSP26 are known to be evicted (Lee et al. 2004) and replaced by smaller factors associated with transcription initiation, pushing gene body nucleosomes downstream (Fig. 1C). As RNA polymerases begin active transcription, they displace and evict nucleosomes in their path (Lee et al. 2004; Schwabish and Struhl 2004; Kulaeva et al. 2010), a phenomenon apparent in our data in the significant loss of nucleosomal fragments within the gene body of HSP26.
To quantify these kinds of complex transcription-associated chromatin dynamics genome-wide, we defined two scores for each gene: “small fragment occupancy,” counting the number of small fragments appearing in its promoter, and “nucleosome disorganization,” using information entropy to summarize the disorganization of the first three nucleosomes within its gene body. Additionally, to compensate for variations in RNA stability, we used published mRNA decay rates (Miller et al. 2011; Geisberg et al. 2014; Presnyak et al. 2015) to estimate transcription rates from our measured transcript levels.
Using these measures, we were able to succinctly describe relationships between chromatin dynamics and transcription in a range of genes, from activated HSP26 (Fig. 1C), to repressed RPS7A (Supplemental Fig. S1), to unchanging CKB1 (Supplemental Fig. S2). Averaging these two measures of the chromatin across the time course and then ranking all genes by the resulting “combined chromatin” score, we observed large-scale coordination between chromatin and transcription across a significant proportion of the genome (Fig. 2A,B).
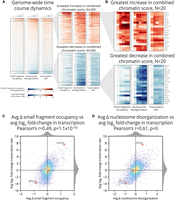
Cadmium induces genome-wide chromatin dynamics that correlate well with genome-wide transcriptional dynamics. (A) Heat maps of changes in chromatin occupancy measures and transcription rate for all genes and all times, relative to 0 min (left: promoter small fragment occupancy; middle: gene body nucleosome disorganization; right: transcription rate). Genes (rows) are sorted by combined chromatin score. (B) Detailed heat maps of the 20 genes whose combined chromatin scores increase (top) or decrease (bottom) most. (C) Scatterplot of relationship between change in small fragment occupancy and log2 fold-change in transcription rate, each averaged over the time course. (D) Scatterplot of relationship between change in nucleosome disorganization and log2 fold-change in transcription rate, each averaged over the full time course.
Globally, log fold-changes in transcription show a significant positive Pearson's correlation with changes in each of our chromatin measures: 0.49 for small fragment occupancy (Fig. 2C); 0.61 for nucleosome disorganization (Fig. 2D); and 0.68 for combined chromatin (Supplemental Fig. S3A). The high correlation between combined chromatin and transcription, along with a lower 0.33 correlation between small fragment occupancy and nucleosome disorganization (Supplemental Fig. S3B), suggest that small fragment occupancy and nucleosome disorganization provide nonredundant information for statistically associating changes in chromatin to changes in transcription.
Changes in nucleosome and small factor occupancy at TSSs recapitulate genome-wide transcriptional response to cadmium
To determine whether we could recapitulate the known response to cadmium exposure from chromatin dynamics alone, we performed Gene Ontology (GO) enrichment analysis of the 300 genes with the highest and lowest values for each chromatin measure (Supplemental Method S2; Supplemental Fig. S4 shows each replicate separately), with significance expressed in terms of false discovery rate (FDR). We identified regulation pathways known to be involved in cadmium response and validated these chromatin-identified pathways using the literature, as well as with a separate GO enrichment analysis based only on changes in transcription (Supplemental Tables S1, S2).
One of the established responses for cells undergoing stress involves shutting down ribosomal and other translation-related pathways (Hosiner et al. 2014; Reja et al. 2015; Vinayachandran et al. 2018). Using our simple chromatin measures, ribosomal and translation-related GO terms emerged as the most significantly down-regulated, with FDR values often much lower than 10−10 (Supplemental Fig. S5A).
Likewise, pathways known to be activated under cadmium exposure are recovered as the most significantly up-regulated by our chromatin scores, albeit with FDR values above 10−4 (Supplemental Fig. S5B). Consistent with previous cadmium and heavy metal stress response studies (Hartwig 2001; Fauchon et al. 2002; Faller et al. 2005) and our own transcriptional GO enrichment analysis (Supplemental Table S2), two major cadmium-response pathways were detected through changes in the chromatin: those related to sulfur processing and to protein refolding. Whereas small fragment occupancy identified sulfate assimilation and stress response terms with the highest significance (FDR 10−3.9), nucleosome disorganization identified protein refolding and sulfur amino acid metabolic process terms. In conclusion, our different chromatin measures are sufficient to recover the high-level stress response pathways induced and repressed by yeast cells exposed to cadmium.
High-resolution time course recovers cascading induction of sulfur pathways
Because of the significant involvement of sulfur assimilation in the cell's response to cadmium, we next sought to detail changes in the chromatin related to the activation of sulfur pathways. The heavy demand for sulfur arises because it is required for the biosynthesis of the cadmium-chelating glutathione (Fauchon et al. 2002). Sulfur pathways are activated through Met4 and its binding complex, comprised of cis-binding factors Cbf1 and Met31/Met32, and accessory factor Met28 (Kuras et al. 1996; Blaiseau and Thomas 1998). Met4 is negatively regulated through ubiquitination by SCFMet30 (Fig. 3A; Kaiser et al. 2000; Kuras et al. 2002; Barbey et al. 2005). In our study, we were able to identify novel features of the chromatin during the cascade of events that regulate sulfur metabolic pathways (Fig. 3B): (1) the activation of the Met4 complex through its cofactors; (2) the activation of the sulfur pathways by Met4; and (3) the subsequent down-regulation of Met4 activity by SCFMet30, evident in diminished transcription of Met4-regulated genes.
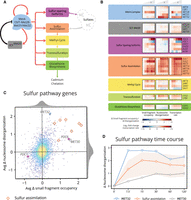
Chromatin and transcription dynamics detail Met4 and Met32 functional activation, induction of sulfur genes, and subsequent regulation. (A) The Met4 complex activates cascading sulfur pathways required for cadmium chelation and also activates its negative regulator SCFMet30. (B) Heat map of changes in chromatin occupancy and transcription rate for the sulfur pathway genes. Cofactors of the Met4 complex exhibit chromatin changes in small fragment occupancy (for MET28) and nucleosome disorganization (for MET32). Sulfur sparing isoforms occur as isoenzyme pairs; members of each pair exhibit inverse chromatin dynamics (most pronounced between PDC6 and PDC1). Nearly all of the sulfur assimilation pathway members show an increase in small fragment occupancy and nucleosome disorganization. (C) Scatterplot of average change in small fragment occupancy and average change in nucleosome disorganization. Chromatin dynamics in sulfur-related genes may manifest primarily in a single measure of the chromatin, as with MET32 (blue triangle), MET30 (gray circle), and PDC6/PDC1 (violet crosses), or in both small fragment occupancy and nucleosome disorganization, such as with the sulfur assimilation genes (orange diamonds). (D) Line plot of the change in nucleosome disorganization for the activator gene MET32, regulator gene MET30, and sulfur assimilation genes (orange line represents mean and light orange region represents full range of values across all seven genes). Nucleosome disorganization for Met4 complex cofactor MET32 peaks at 7.5 min whereas targets of the Met4 complex peak later: sulfur assimilation genes within 15–30 min and the negative regulator MET30 more gradually.
Upon cadmium-induced deubiquitination of Met4 (Barbey et al. 2005), Met4 becomes functionally active and induces its own cofactors (Barbey et al. 2005; McIsaac et al. 2012) and, through feedforward regulation between Met4 and Met32, activates sulfur pathway genes (Carrillo et al. 2012; McIsaac et al. 2012). We observed this activation not only in increased transcription within 7.5 min for MET32 and MET28 but also in increased nucleosome disorganization for MET32 (Supplemental Fig. S6) and increased small fragment occupancy for MET28.
Although Met31 shares a binding motif and largely overlaps in function with Met32 (Blaiseau et al. 1997), it is not as prominent as Met32 in the activation of sulfur pathways (Carrillo et al. 2012; McIsaac et al. 2012; Petti et al. 2012). In response to cadmium, the transcription of MET31 is repressed, but the chromatin around the gene exhibits an unexpected behavior in light of this: although MET31 expression is repressed, its nucleosomes become highly disorganized. Leveraging our stranded RNA-seq data, we noticed significantly increasing antisense transcription over the time course (Supplemental Fig. S7). Additionally, downstream of the transcription end site (TES) of MET31, small fragments become enriched at a Met31/Met32 binding motif. Taken together, our data suggest that MET31 is being regulated by noncoding RNA (ncRNA) antisense transcription.
Following activation of the Met4 complex (Carrillo et al. 2012; McIsaac et al. 2012), small fragment occupancy, nucleosome disorganization, and transcription increase for the seven sulfur assimilation genes and many downstream genes (Fig. 3B; average effect on the chromatin measures in Fig. 3C), most within 15 min. Additionally, the Met4 complex induces a sulfur-sparing transcriptional-switch between functionally similar isoenzymes to indirectly contribute sulfur required for chelation. This switch includes replacing sulfur-rich Pdc1 with sulfur-lacking Pdc6, Ald6 with Ald4, and Eno2 with Eno1 (Fauchon et al. 2002). We see evidence of these substitutions between isoenzyme pairs in our data, the most evident between the small fragment occupancy of PDC6 (Supplemental Fig. S8) and PDC1.
Following induction of the sulfur pathways, the activating roles of Met32 and Met4 diminish upon regulation by SCFMet30 (Patton et al. 2000; Ouni et al. 2010). This regulation is observed in our data in the gradually increasing transcription and nucleosome disorganization of MET30 throughout the time course, as well as in how the nucleosome disorganization scores of MET32 and many of the sulfur assimilation genes gradually diminish after an early peak (Fig. 3B,D).
Together, these results and analyses complement established transcriptional and ChIP-based studies by detailing chromatin dynamics of the sulfur metabolic pathways and identifying a potentially novel regulatory mechanism for MET31 through antisense transcription.
Cadmium induces chromatin dynamics that exhibit distinct temporal clusters, including ones linked to antisense transcription
We selected the 500 genes exhibiting the greatest average increase in either small fragment occupancy or nucleosome disorganization and performed hierarchical clustering on the resulting 832 genes (fewer than 1000 because 168 were in both sets) (Supplemental Method S3). Clustering revealed distinct temporal patterns in small fragment occupancy and nucleosome disorganization among the genes (Fig. 4A). GO enrichment analysis identified pathways relating to sulfur assimilation in cluster 1 and protein refolding in cluster 2, suggesting that chromatin changes in these pathways differ in their temporal pattern. Clusters 6–8 reveal unexpected anticorrelated relationships between chromatin and transcription for genes in these clusters. For genes in cluster 6, some of the anticorrelation can be attributed to antisense transcription (Fig. 4B), as previously highlighted in MET31. However, in cluster 7, MCD4, which codes for an endoplasmic reticulum membrane protein, counterintuitively exhibits chromatin with nucleosomes that become more organized despite increased sense and no evident antisense transcription (Supplemental Fig. S9).
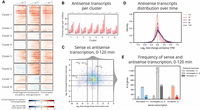
Small fragment occupancy in the promoter and nucleosome disorganization in the gene body reveal timing of stress response pathways and patterns of antisense transcription. (A) Hierarchical clustering of 832 genes (union of the 500 with greatest increase in average small fragment occupancy and the 500 with greatest increase in average nucleosome disorganization). Clusters 6–8 contain genes exhibiting anticorrelated chromatin dynamics. (B) Median (black dot) and interquartile range (red bar) of antisense transcript levels for genes within each cluster across the time course. Cluster 6 genes display a marked increase in antisense transcripts, perhaps explaining why the cluster exhibits increased nucleosome disorganization despite decreased small fragment occupancy in panel A. (C) Distribution of the log2 fold-change in sense transcription rate against the log2 fold-change in antisense transcripts from 0–120 min. Antisense transcripts are enriched genome-wide by 120 min. (D) Distribution of the log2 fold-change in antisense transcripts for each time point following 0 min. Antisense transcripts monotonically increase throughout the time course. (E) Counts of genes that exhibit decreased, unchanged, and increased sense and antisense transcripts from 0–120 min. Genes in each category of sense transcription exhibit positively skewed enrichment of antisense transcripts.
Genome-wide, we observed that antisense transcription manifests itself with minimal apparent connection to sense transcription (Fig. 4C). Nevertheless, we did detect two general phenomena, each consistent with prior studies. First, as also seen in other environmental conditions (Wilhelm et al. 2008; Kim et al. 2010; Till et al. 2018), yeast cells undergoing cadmium stress induce pervasive antisense transcription. As the time course progresses, more and more genes exhibit increased levels of antisense transcription (Fig. 4D). Even among the 3199 genes with minimally changing sense transcription, 542 exhibit at least a fourfold increase in antisense transcription (Fig. 4E). Second, previous studies have found antisense transcription can be associated with either repression or activation of target genes (Kornienko et al. 2013; Swamy et al. 2014; Vance and Ponting 2014; Till et al. 2018), and we observed the same phenomenon. Under cadmium stress, we identified 200 genes with a greater than fourfold increase in antisense transcripts and a fourfold change in sense transcripts. Among those, 104 had repressed sense transcription—for example, MET31 and UTR2, which has been linked with endoplasmic reticulum stress (Supplemental Fig. S10; Miller et al. 2010)—but 96 had activated sense transcription, including the gene YBR241C (Supplemental Fig. S11), coding for a vacuole localization protein (Wiederhold et al. 2009).
Motif analysis identifies transcription factors with largest changes in binding
To explore small fragment occupancy more closely, we identified peaks in the signal and quantified the change in binding at each peak over 60 min (Supplemental Fig. S12A). We ran the motif finder FIMO (Grant et al. 2011) near peak locations to associate peaks with TFs and then computed the average change in binding occupancy for each TF (Supplemental Fig. S12B). TFs exhibiting the greatest average increase in occupancy include not only the sulfur pathway activators Met4 and Met32, general stress regulators Msn2 and Msn4, and glycolytic activators Gcr1 and Gcr2, but also the iron homeostasis regulators Aft1 and Aft2. Genes with the greatest increase in both Aft1 and Aft2 binding include SER33, LEE1, and ENB1.
For SER33, a gene involved in Ser and Gly biosynthesis (Albers et al. 2003), we see evidence of Aft1/Aft2 binding near Gcr2 in the promoter (Supplemental Fig. S12C). Whereas Gcr2 is known to interact with Gcr1, an established regulator of SER33 (Hu et al. 2007), Aft1 and Aft2 have yet to be identified as regulators for SER33 (Supplemental Fig. S12D). Additionally, we see enrichment of small fragments near the motifs for known regulators Met32 and Met4, previously identified through ChIP (Carrillo et al. 2012). Similarly strong evidence of Aft1/Aft2 binding is found in the promoters of LEE1 (Supplemental Fig. S13A), a zinc-finger of unknown function, and ENB1 (Supplemental Fig. S13B), a ferric enterobactin transmembrane transporter (Heymann et al. 2000). ENB1 has only been identified to be regulated by Aft1 through microarrays (Hu et al. 2007). Whereas the iron homeostasis pathways have been previously implicated in heavy metal stress conditions (Hosiner et al. 2014; Halimaa et al. 2019), our analysis further elucidates the binding dynamics of regulators Aft1 and Aft2 under cadmium stress and, more generally, demonstrates the richness of small fragment signals in MNase-seq data.
Chromatin occupancy changes are predictive of changes in gene expression
Finally, we sought to develop a model to quantify the relationship between our measures of chromatin dynamics and changes in transcription. We used Gaussian process regression to predict the transcription at each time point based solely on chromatin dynamics and initial transcript levels (at 0 min, before cadmium treatment). We constructed four models to evaluate the inclusion of various measures of the chromatin, culminating in a “full” model that incorporates additional occupancy measures, nucleosome positional shifts (Supplemental Fig. S14; Supplemental Method S4), and chromatin measures relative to called antisense transcripts (Supplemental Fig. S15).
Under 10-fold cross-validation, we evaluated each model using the coefficient of determination (R2), reflecting the proportion of variance each model is able to explain. For each feature-containing model, prediction performance gradually worsens through the time course as genes’ transcript levels increasingly diverge from their initial values (Fig. 5A). However, models that include chromatin features consistently outperform a model that just uses initial transcript levels (“RNA-only”), with the gap growing over time. Nucleosome disorganization is more informative than small fragment occupancy, especially at intermediate time points; consistent with our other results, combining both measures provides more predictive power than either alone. The full model does not add much to this combination at 7.5 and 15 min (Fig. 5B) because early predictions are driven mainly by initial transcript levels. However, by 30 min (Fig. 5C), the full model begins to outperform all other models, maintaining an R2 of 0.44 even 2 h after exposure of the cells to cadmium (Fig. 5D).
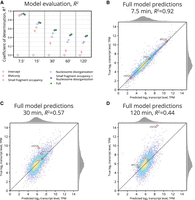
Chromatin occupancy dynamics are predictive of gene expression. (A) Comparison of the performance of each GP model using the coefficient of determination, R2. The full model incorporating all chromatin features and initial transcript level outperforms all other models after 15 min. Later time points rely less on initial transcript level for prediction, so the statistical benefits of chromatin features become more evident over time (compared to RNA-only baseline). (B) Comparison between true and predicted log2 transcript level for the full model after 7.5 min. Most genes are well predicted using 0 min transcript level. (C) Full model predictions at 30 min. Predictions remain well correlated, but less than at 7.5 min. (D) Full model predictions at 120 min. After two full hours have elapsed, transcript level predictions have become a bit less correlated, but still, R2 remains 0.44.
Although our models cannot ascertain causal links between changes in chromatin and transcription, and although they use measures that do not fully characterize the chromatin state, they nevertheless provide strong evidence that a large proportion of the transcriptional state of the cell can be predicted from simple measures of its chromatin state, even after significant environmental perturbation.
Discussion
As this study demonstrates, MNase digestion is a powerful tool to explore the chromatin landscape, surveying the occupancy of all DNA-binding factors across the genome, without regard to their identities. It provides an alternative to ChIP-based approaches which use an antibody to ensure the identity of a single factor whose occupancy is being surveyed. Because thousands of different factors bind to a cell's genome, each approach has its limitations: ChIP cannot easily scale to surveying the full chromatin landscape, let alone doing so under dynamic conditions, whereas MNase digestion cannot easily determine the identities of the bound factors it detects.
MNase digestion characterizes nucleosomes very effectively, owing to their high abundance and distinctively sized longer fragments, but using the smaller fragments to profile the TFs and complexes that regulate gene expression is a more challenging, open problem. Motif analysis, along with prior studies exploring the dynamics of various individual promoter-binding factors including TFs, general TFs, polymerases, mediator, SAGA, TFIID, and chromatin remodelers (Huisinga and Pugh 2004; Shivaswamy and Iyer 2008; Venters et al. 2011; Rhee and Pugh 2012; Weiner et al. 2012, 2015; Reja et al. 2015; Chereji et al. 2017; Vinayachandran et al. 2018), provided us with useful context to interpret the dynamics of small fragments in our MNase-seq data, such as in our characterizations of HSP26 (Fig. 1B,C), the sulfur pathways (Fig. 3), and the iron homeostasis regulators Aft1/Aft2 (Supplemental Fig. S12). Development of methods that facilitate further interpretation of small fragments will be an important future direction.
In our analysis of the Met4 cofactor gene MET31, we detected chromatin changes linked with increased antisense transcription, potentially explaining how its sense transcription is regulated. Moreover, we observed pervasive antisense transcription under cadmium stress (Fig. 4C–E), and although this has previously been shown to occur under a variety of environmental perturbations (Camblong et al. 2007; Toesca et al. 2011; Nadal-Ribelles et al. 2014; Swamy et al. 2014), we were able to characterize relationships between sense and antisense transcription with regulatory insight from the perspective of the local chromatin landscape. We identified antisense transcripts for 667 genes. Incorporating chromatin measures relative to the antisense transcripts of these genes improved our model (marginally) for predicting sense transcription (Fig. 5A). This benefit could be further explored by narrowing in on the effect size of these antisense-related chromatin measures and by examining the expression of the individual genes that appear to have a relationship with antisense transcription.
Using just the initial transcript level and simple measures of chromatin dynamics, our regression model is able to predict the level of sense transcript with an R2 of at least 0.44, even 2 h after cadmium exposure (Fig. 5A). This model can be extended in multiple directions. We can further quantify the chromatin by including additional classes of fragments, by computing new measures of chromatin dynamics, and by considering chromatin beyond 200 bp of a promoter and the first 500 bp of a gene body. Additionally, our data could be modeled with other statistical methods including generalized linear models, deep neural networks, or random forests. This model and its predictions serve as a baseline showing the potential modeling opportunities and rich statistical power of MNase-derived time-series chromatin data.
Methods
Yeast strain
The yeast strain used in this study has the W303 background with the genotype: MATa, leu2-3,112, trp1-1, can1-100, ura3-1, ade2-1, his3-11,15.
Growing and sampling cells over the time course
Cells were grown asynchronously in YEPD at 30°C to an OD600 of 0.8. Immediately before the addition of CdCl2, one sample was removed and cross-linked with formaldehyde to a final concentration of 1% for MNase-seq, and another was pelleted and flash-frozen for RNA-seq; these represent time 0. After the addition of CdCl2 to a final concentration of 1 mM, samples were taken at 7.5 min, 15 min, 30 min, 60 min, and 120 min, and processed in the above manner, respectively, in preparation for MNase-seq and RNA-seq. All experiments were repeated independently as biological replicates. The CdCl2 concentration of 1 mM was chosen to study acute cellular response to cadmium (cells do not grow at this concentration [Supplemental Fig. S16]).
Preparing chromatin
Cells were resuspended with 20 mL of buffer Z (0.56 M sorbitol, 50 mM Tris at pH 7.4) and 14 µL of β-ME, and 0.5 mL of a 10 mg/mL solution of zymolyase (Sunrise Science Products) prepared in buffer Z was added. Samples were incubated for 30 min at 24°C with shaking. Cells were centrifuged at 1500 rpm for 6 min at 4°C and then resuspended in 2.5 mL of NP buffer (1 M sorbitol, 50 mM NaCl, 10 mM Tris at pH 7.4, 5 mM MgCl2, 1 mM CaCl2), supplemented with 0.5 mM spermidine, 0.007% β-ME, and 0.075% NP-40. To determine the best digestion conditions, a four-step titration of 15 U/µL MNase (Worthington) was added to 400 µL of zymolyase-treated cells (Supplemental Fig. S17). Samples were inverted to mix and digested on the benchtop for 20 min. The reaction was halted by adding 100 µL of stop buffer (5% SDS, 50 mM EDTA). Next, Proteinase K was added to a 0.2 mg/mL final concentration, and the samples were inverted and then incubated overnight at 65°C. DNA was recovered by phenol/chloroform extraction and isopropanol precipitation.
Processing reads from MNase-seq and RNA-seq replicates
After confirming high concordance between them, MNase-seq and RNA-seq replicates were subsampled and merged to increase read depth and reduce bias from library preparation, sequencing, and digestion. Details are provided in Supplemental Method S5. After merging, we had 24,152,389 mapped MNase fragments (pairs of reads) and 42,107,377 mapped RNA reads for each time point.
Selecting a set of genes for analysis
We compiled a set of 4427 genes for analysis. A gene was chosen if it satisfied five criteria: it (1) is classified as either verified or uncharacterized by sacCer3/R64, (2) contains an open reading frame (ORF) at least 500 bp long (Supplemental Fig. S18A), (3) contains an annotated TSS, (4) has a reported mRNA half-life, and (5) has adequate MNase-seq coverage (Supplemental Fig. S18B). Additional details are provided in Supplemental Method S6.
Defining classes of MNase-seq fragments and measures of their occupancy
MNase-seq fragments can be associated with different DNA-binding factors on the basis of their length (Supplemental Fig. S19). To summarize the chromatin occupancy of different factors around genes, fragments were first filtered into two classes: fragments associated with nucleosomes (length between 144 and 174 bp; see below for justification), and fragments associated with smaller factors (length <100 bp; see below for justification).
Nucleosomal fragment lengths were determined by examining the distribution of MNase-seq fragments prior to cadmium treatment around the top 2500 unique nucleosome positions reported by a highly sensitive chemical assay (Brogaard et al. 2012). In our MNase-seq data, the distribution of fragment lengths at these sites had a clear mode at 159 bp; we chose a ±15-bp interval around this mode to capture most of the nucleosomal fragments, resulting in the final 144- to 174-bp range.
As for fragments associated with smaller factors, because prior studies have found clear enrichment of small fragments at Abf1 sites (Henikoff et al. 2011), we examined the distribution of fragments prior to cadmium treatment around 279 Abf1 binding sites, as determined by phylogenetic conservation and motif discovery, obtained from http://fraenkel-nsf.csbi.mit.edu/improved_map/p001_c2.gff (MacIsaac et al. 2006). In our MNase-seq data, most of the fragments at these sites were shorter than 100 bp (mode: 75 bp), so those were classified as small fragments.
For each gene, two regions were defined relative to its TSS. The promoter region was defined as a 200-bp region upstream of the TSS. The length of this region was chosen as previously described (Smale and Kadonaga 2003; Lubliner et al. 2013). The gene body region was defined as a 500-bp region including and downstream from the TSS, chosen to include the +1, +2, and +3 nucleosomes. The occupancy of a class of fragments within a particular region is computed simply as the number of fragments of that class whose centers lie within that region.
Computing chromatin scores with cross-correlation kernels
Some chromatin statistics require more spatial precision than is provided by occupancy in a region—for example, when determining the position or organization of a factor. In these cases, we used cross-correlation scores in a similar manner to that described in Tripuraneni et al. (2021). Around the TSS for each gene, a per-bp cross-correlation score was computed to smooth positional variation and filter out irrelevant fragments. Three two-dimensional cross-correlation kernels were constructed: an idealized, well-positioned nucleosome kernel (Supplemental Fig. S20A); a clearly bound small factor kernel (Supplemental Fig. S20B); and a triple-nucleosome gene body summary kernel (Supplemental Fig. S20C). Each kernel was applied to the region local to the TSS of each gene for each time point to compute a cross-correlation score at each base pair (Supplemental Fig. S20D).
The nucleosome and small factor kernels were constructed using a bivariate Gaussian distribution parameterized by the mean and variance for the position and length of MNase-seq fragments. The parameters for each kernel were determined using the fragment length and position distributions at positions in Brogaard et al. (2012) and MacIsaac et al. (2006), as described in the previous subsection.
To summarize the gene body chromatin as a whole, a triple-nucleosome kernel was constructed to dampen the effect of the +1 nucleosome tending to be more well-positioned (Mavrich et al. 2008; Nocetti and Whitehouse 2016). The triple-nucleosome kernel was constructed by repeating the nucleosome kernel and increasing the variance to take into account variable linker spacing. The nucleosome kernel spacing was determined using the average peak spacing between the [+1,+2] and the [+2,+3] nucleosome cross-correlation scores (Supplemental Fig. S20E).
This method of summarizing the nucleosome signal was found to be robust, whether we used positions from Brogaard et al. (2012) (Supplemental Fig. S21A,B) or those called by DANPOS (Chen et al. 2013) with default paired-end parameters (Supplemental Fig. S21C,D).
Quantifying nucleosome disorganization
Nucleosome disorganization was computed for each gene at each time point using information entropy. Entropy measures whether the nucleosomal fragments observed in the gene body match a sliding triple-nucleosome kernel extremely well in only a few positions (well-organized) or marginally well in many positions (disorganized).
Cross-correlation scores computed using the triple-nucleosome kernel over a 150-bp window downstream from the TSS were normalized
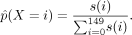
to form the empirical probability distribution of a categorical random variable X:

A window of size 150 bp around the +1 nucleosome was used because the triple kernel already incorporates the +2 and +3 nucleosome occupancy into its score.
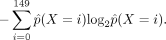
Nucleosome disorganization is then defined as the information entropy of the probability distribution of X (examples are shown in Supplemental Fig. S20F):
Identifying transcription factor binding sites
TF binding sites were called using small fragment cross-correlation scores and motif finding as follows. For each gene's promoter, the cross-correlation scores at each position and time point were sorted in a list. The position corresponding to the highest score was labeled as a small fragment peak and then removed from the list; positions within 50 bp of this peak (at any time point) were also removed. This procedure was repeated until all positions for that promoter were removed. Then, for each small fragment peak, the occupancy of small fragments within 50 bp of the peak was computed at each time point, enabling us to identify peaks whose occupancy changed over time.
Within each called peak, the motif finder FIMO (Grant et al. 2011) was run against the motif database from MacIsaac et al. (2006) using the default P-value threshold. Select binding sites with supporting literature were annotated on typhoon plots.
Estimating transcription rates
To account for potential differences in mRNA stability, we estimated transcription rates from our measurements of transcript levels. Changes in the two were found to be highly correlated, and each correlated with various chromatin measures in nearly identical ways (Supplemental Fig. S22). As previously described in Cashikar et al. (2005), Rabani et al. (2011), and Yang et al. (2003), transcription rates were computed by incorporating mRNA decay rates into difference equations describing zero-order growth with first-order decay. Details are provided in Supplemental Method S7.
Identifying and quantifying antisense transcripts
TSSs and TESs for antisense transcripts were determined using RNA-seq pileup, the number of reads covering a genomic position. To increase signal and decrease noise, we added the antisense pileup values across time points at each genomic position to produce a cumulative pileup, and then smoothed that with a Gaussian kernel.
Starting with the highest cumulative pileup value within a gene's transcript boundary on the antisense strand, the antisense TSSs and TESs were identified by progressively searching upstream and downstream, respectively, to identify the positions at which the cumulative pileup values were minimized (Supplemental Fig. S15A). Antisense transcripts were not called if they did not meet a minimum threshold of pileup at any position within the transcript boundary.
For the 667 genes where an antisense transcript could be called (Supplemental Fig. S15B), antisense transcription levels were quantified using a TPM calculation (Wagner et al. 2012) for strand-specific RNA-seq reads on the antisense strand within the respective antisense transcript boundaries. We also computed nucleosome disorganization and small fragment occupancy chromatin measures relative to these called antisense transcripts, as previously described for the sense strand.
Predicting transcript levels using Gaussian process regression models
Gaussian process regression models were constructed to predict the log2 transcript level for each time point using the log2 transcript level and features of the chromatin at 0 minutes, along with features of the chromatin for the time being predicted. Gaussian process regression was chosen to better incorporate multiple signals and model nonlinearity (Supplemental Fig. S23A) compared to simpler linear models based on average nucleosome occupancy (Supplemental Fig. S23B), average nucleosome disorganization (Supplemental Fig. S23C), average small fragment occupancy (Supplemental Fig. S23D), or combined chromatin score (Supplemental Fig. S23E).
To compare various combinations of chromatin features, four Gaussian process regression models were constructed: a promoter small fragment occupancy model; a gene body nucleosome disorganization model; a model using both chromatin measures; and a full model incorporating all previous models’ features plus nucleosome occupancy within the promoter and within the gene body, small fragment occupancy within the gene body, +1, +2, and +3 nucleosome position shift relative to 0 min (Supplemental Fig. S14; Supplemental Fig. S24 confirms nucleosome shifts not due to asymmetric digestion), and measures of chromatin relative to called antisense transcripts (Supplemental Fig. S15).
Each Gaussian process regression model was estimated via scikit-learn (Pedregosa et al. 2011) using a radial-basis function (RBF) kernel with length scale bounded between 0.1 and 100 and a white kernel with noise level 10−4 as priors for covariance. The length scale bounds and noise parameters were determined empirically through a sensitivity analysis on a subset of the data.
Small fragment occupancy and nucleosome disorganization measures were each log-transformed to yield an approximately normal distribution. Then, every chromatin measure (including all those added to the full model) was z-normalized to allow the RBF length parameter to be successfully estimated.
Performance for each model was evaluated under 10-fold cross-validation using the coefficient of determination, R2.
Data access
All raw and processed sequencing data generated in this study have been submitted to the NCBI Gene Expression Omnibus (GEO; https://www.ncbi.nlm.nih.gov/geo/) under accession number GSE153609. Code to reproduce the results in this study is included in Supplemental Code and available on GitHub (https://github.com/HarteminkLab/cadmium-paper).
Competing interest statement
The authors declare no competing interests.
Acknowledgments
The authors thank Dr. Yulong Li, Dr. Greg Crawford, and Dr. Raluca Gordân for their suggestions and helpful comments during the development of this research. The work was supported by the following grants from the National Institutes of Health, National Institute of General Medical Sciences: R35-GM127062 (D.M.M.) and R01-GM118551 (A.J.H.).
Footnotes
-
[Supplemental material is available for this article.]
-
Article published online before print. Article, supplemental material, and publication date are at https://www.genome.org/cgi/doi/10.1101/gr.267237.120.
- Received July 3, 2020.
- Accepted April 19, 2021.
This article is distributed exclusively by Cold Spring Harbor Laboratory Press for the first six months after the full-issue publication date (see https://genome.cshlp.org/site/misc/terms.xhtml). After six months, it is available under a Creative Commons License (Attribution-NonCommercial 4.0 International), as described at http://creativecommons.org/licenses/by-nc/4.0/.


