
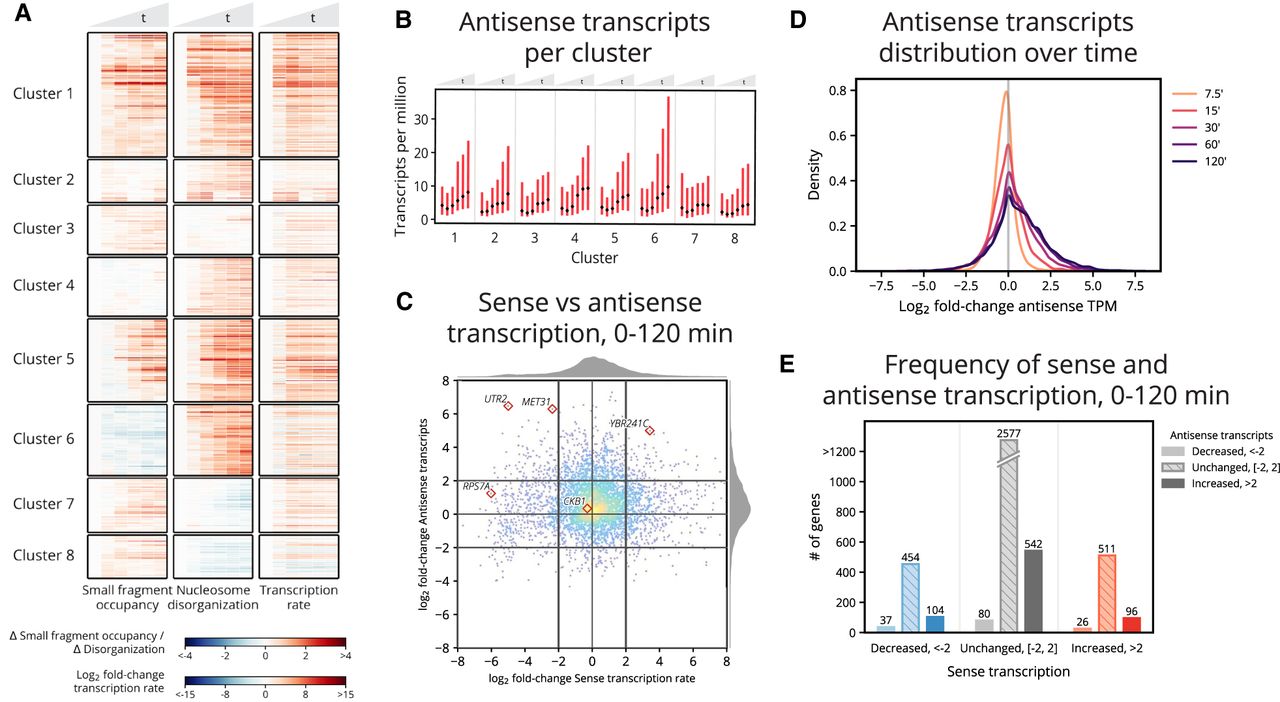
Small fragment occupancy in the promoter and nucleosome disorganization in the gene body reveal timing of stress response pathways and patterns of antisense transcription. (A) Hierarchical clustering of 832 genes (union of the 500 with greatest increase in average small fragment occupancy and the 500 with greatest increase in average nucleosome disorganization). Clusters 6–8 contain genes exhibiting anticorrelated chromatin dynamics. (B) Median (black dot) and interquartile range (red bar) of antisense transcript levels for genes within each cluster across the time course. Cluster 6 genes display a marked increase in antisense transcripts, perhaps explaining why the cluster exhibits increased nucleosome disorganization despite decreased small fragment occupancy in panel A. (C) Distribution of the log2 fold-change in sense transcription rate against the log2 fold-change in antisense transcripts from 0–120 min. Antisense transcripts are enriched genome-wide by 120 min. (D) Distribution of the log2 fold-change in antisense transcripts for each time point following 0 min. Antisense transcripts monotonically increase throughout the time course. (E) Counts of genes that exhibit decreased, unchanged, and increased sense and antisense transcripts from 0–120 min. Genes in each category of sense transcription exhibit positively skewed enrichment of antisense transcripts.


