
Characterization of functional relationships of R-loops with gene transcription and epigenetic modifications in rice
- Yuan Fang1,6,
- Lifen Chen1,6,
- Kande Lin1,
- Yilong Feng1,
- Pengyue Zhang1,
- Xiucai Pan1,
- Jennifer Sanders2,
- Yufeng Wu1,
- Xiu-e Wang1,
- Zhen Su3,
- Caiyan Chen4,
- Hairong Wei2,5 and
- Wenli Zhang1
- 1State Key Laboratory for Crop Genetics and Germplasm Enhancement, JiangSu Collaborative Innovation Center for Modern Crop Production, Nanjing Agricultural University, Nanjing, Jiangsu 210095, P.R. China;
- 2School of Forest Resources and Environmental Science, Michigan Technological University, Houghton, Michigan 49931, USA;
- 3State Key Laboratory of Plant Physiology and Biochemistry, College of Biological Sciences, China Agricultural University, Beijing 100193, P.R. China;
- 4Institute of Subtropical Agriculture, Chinese Academy of Sciences, Changsha, Hunan, 410125, P.R. China;
- 5Beijing Advanced Innovation Center for Tree Breeding by Molecular Design, Beijing Forestry University, Beijing 100083, P.R. China
-
↵6 These authors contributed equally to this work.
Abstract
We conducted genome-wide identification of R-loops followed by integrative analyses of R-loops with relation to gene expression and epigenetic signatures in the rice genome. We found that the correlation between gene expression levels and profiled R-loop peak levels was dependent on the positions of R-loops within gene structures (hereafter named “genic position”). Both antisense only (ASO)-R-loops and sense/antisense (S/AS)-R-loops sharply peaked around transcription start sites (TSSs), and these peak levels corresponded positively with transcript levels of overlapping genes. In contrast, sense only (SO)-R-loops were generally spread over the coding regions, and their peak levels corresponded inversely to transcript levels of overlapping genes. In addition, integrative analyses of R-loop data with existing RNA-seq, chromatin immunoprecipitation sequencing (ChIP-seq), DNase I hypersensitive sites sequencing (DNase-seq), and whole-genome bisulfite sequencing (WGBS or BS-seq) data revealed interrelationships and intricate connections among R-loops, gene expression, and epigenetic signatures. Experimental validation provided evidence that the demethylation of both DNA and histone marks can influence R-loop peak levels on a genome-wide scale. This is the first study in plants that reveals novel functional aspects of R-loops, their interrelations with epigenetic methylation, and roles in transcriptional regulation.
DNA–RNA hybrids, also referred to as R-loops, are three-stranded nucleic acid structures, and each is composed of a DNA–RNA duplex and a DNA strand displaced in a single-stranded conformation. R-loops were first found in the f1 phage in 1967 (Milman et al. 1967) and were subsequently characterized in Escherichia coli (Thomas et al. 1976). In mammals, R-loops are often found at genic loci with high guanine-cytosine (GC) content that includes intrinsic unmethylated CpG island promoters (Ginno et al. 2012) and GC-skewed regions (Ginno et al. 2013). It has been shown that purine (G,A)-rich RNA has a higher affinity to its complementary DNA than a similar purine-rich DNA to its complementary DNA (Roberts and Crothers 1992), which indicates that DNA–RNA hybrids (or R-loops) are thermodynamically more stable than DNA–DNA duplexes. R-loops also display several specific epigenomic signatures and tend to colocalize with open chromatin and heterochromatic regions (Nadel et al. 2015).
As to their functions, R-loops were initially reported to be associated with some cellular processes, such as DNA replication initiation in E. coli plasmids and mammalian mitochondrial DNA, and immunoglobulin class switching (Itoh and Tomizawa 1980; Kogoma 1997; Yu et al. 2003). Recently, R-loops have also been shown to be involved in impairment of transcription elongation (Huertas and Aguilera 2003), DNA replication obstacle (Gan et al. 2011), DNA-damage response (Sollier et al. 2014; Hamperl et al. 2017), environmental adaptation (Cloutier et al. 2016), DNA repair (Lu et al. 2018), DNA translocation (Cohen et al. 2018), genome instability (Wahba et al. 2013; García-Pichardo et al. 2017), and shortening lifespan (Salvi et al. 2014). Considering this list, it is evident that R-loops have detrimental as well as beneficial effects. The accumulation of R-loops can increase genome instability because the ssDNA in the R-loop structure is susceptible to lesions and transcription-associated mutagenesis or recombination (Skourti-Stathaki and Proudfoot 2014). However, R-loops can also have positive effects on some biological processes such as the regulation of gene expression (Aguilera and García-Muse 2012; Costantino and Koshland 2015). R-loops are crucial for activating gene expression by recruiting H3K4me3 or the DNA demethylation complex (Ginno et al. 2012), regulating a transcriptional pause or termination (Skourti-Stathaki et al. 2011; Chen et al. 2017), and controlling gene expression by mediating pairing of DNA with antisense transcripts or noncoding RNAs (Cloutier et al. 2016).
R-loops in plants have recently gained increasing attention. They have been found to play a role in regulating flowering time (Sun et al. 2013), root development (Shafiq et al. 2017), gene splicing (Conn et al. 2017), and genome instability (Yang et al. 2017). The first global characterization of R-loops in Arabidopsis thaliana revealed a potential role in gene activation by repressing the expression of antisense lncRNA (Xu et al. 2017). However, a direct association between R-loops and gene expression has not been reported in plants nor has a connection between R-loops and epigenetic modifications. In this study, we adapted the DRIP-seq method to identify R-loops in rice calli and seedlings and then characterized their sequence features. We studied the relationships between different types of R-loops and expression levels of overlapping genes. We also studied the interrelationships between R-loops and various epigenetic signatures and provided evidence that a crosstalk exists between them and that epigenetic modifications affect R-loop formation.
Results
The relationships between R-loops and gene transcription in the rice genome
The promotional and repressive roles of R-loops in gene transcription have been characterized in mammals (Sanz et al. 2016; Grunseich et al. 2018), but how the R-loop functions in plant gene transcription has not been characterized. To investigate this, we used an adapted DRIP-seq approach (Supplemental Fig. S1B) and identified a total of 38,223 and 38,613 Watson DNA strand–related R-loops (wR-loops) and 38,012 and 37,408 Crick DNA strand–related R-loops (cR-loops) in rice seedlings and calli, respectively (Supplemental Fig. S2A). We then classified the R-loops into sense R-loops (S-R-loops), antisense R-loops (AS-R-loops), and sense and antisense R-loops (S/AS-R-loops) based on R-loop formation in relation to the transcriptional direction of overlapping genes (Supplemental Fig. S3A). Next, we classified all genes, including transposable element (TE) and non-TE genes, into four categories: (1) genes with sense only R-loops (SO-R-loops), (2) genes with antisense only R-loops (ASO-R-loops), (3) genes with sense and antisense R-loops (S/AS-R-loops), and (4) genes without R-loops (Supplemental Table S1). After assessing the expression levels of non-TE genes with different types of R-loops, we found that the median and average expression levels of genes with ASO-R-loops or S/AS-R-loops were significantly higher than those of control genes without R-loops in both seedlings and calli (Supplemental Fig. S3B). In contrast, the expression levels of genes with SO-R-loops were not significantly different from those of control genes in seedlings but were slightly higher than those of control genes in calli (Supplemental Fig. S3B).
After classifying all genes with R-loops into five bins according to their expression levels (FPKM values) in both tissues, we plotted R-loop read densities from 1 kb upstream of transcription start sites (TSSs) to 1 kb downstream from the transcription end sites (TESs) for all genes with R-loops (Fig. 1A). R-loops were associated with both expressed and nonexpressed (FPKM = 0) genes. SO-R-loops, when present in gene bodies, showed an inverse relationship to the expression levels of overlapping genes (Fig. 1A); however, when SO-R-loops were present around TSSs, there was a stronger relationship between R-loop read densities and gene expression levels (Fig. 1A). In contrast, a positive correspondence was observed between normalized read densities of ASO-R-loops and expression levels of genes containing ASO-R-loops in the promoter regions. However, a similar positive relationship was found for genes with S/AS-R-loops in promoter regions in seedlings (Fig. 1A). In calli, however, a weaker relationship was observed between S/AS-R-loop densities around TSSs and expression levels of overlapping genes, presumably owing to the excessive distribution of S/AS-R-loops in gene bodies. To assess this further, we sorted all genes with S/AS-R-loops located within ±500 bp of TSSs in calli and then divided them into three subclasses according to FPKM values. A positive correspondence between S/AS-R-loop read densities and expression levels of overlapping genes was observed (Supplemental Fig. S3C).
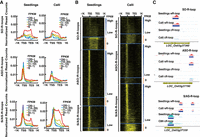
The relationship between R-loops and expression levels of non-TE genes. (A) Curve plots showing the distribution of R-loop read densities from 1 kb upstream of the TSS to 1 kb downstream from the TES. Genes with each type of R-loops (SO-, ASO-, S/AS-R-loops) were classified into one of five bins based on their FPKM values (0, 0–1, 1–10, 10–20, and more than 20). (B) Heatmap showing the distribution of R-loop read counts from 1 kb upstream of the TSS to 1 kb downstream from the TESs of genes that were arranged in descending order based on FPKM values. The transition from black to yellow corresponds to R-loop read intensities from low to high levels. (C) Representative genic loci associated with SO-R-loops, ASO-R-loops, and S/AS-R-loops, respectively.
To test if the correspondence between R-loops and gene expression is genic position dependent, we regrouped all expressed genes (FPKM > 0) into two categories (greater or less than 10). We then plotted the normalized read counts within ±500 bp of TSSs and also from TSSs to TESs. Both positive and negative correspondences were observed between R-loop densities and gene expression levels around TSSs and in gene bodies for each type of R-loops (Supplemental Fig. S4A). Consistent with the bar plots shown in Supplemental Figure S4A, S-R-loops were distributed more in exons but less in promoters than were AS-R-loops (Supplemental Fig. S4B).
To view R-loop levels with respect to different genic regions within gene frames, we generated a heatmap for R-loops from each tissue, in which all genes were ranked by their expression levels from the highest to the lowest values (FPKM) (Fig. 1B). SO-R-loop reads spanned the entire gene bodies and were highly enriched in nonexpressed genes (FPKM = 0). In contrast, ASO-R-loop and S/AS-R-loop reads were specifically enriched around the TSSs of genes with higher expression levels but tended to be dispersed in gene bodies, especially when genes had low expression levels (Fig. 1B). S/AS-R-loop reads were noticeably enriched in the entire gene bodies of nonexpressed genes (FPKM = 0) (Fig. 1B). The three types of typical read distributions corresponding to SO-R-loops, ASO-R-loops, and S/AS-R-loops, respectively, are illustrated in Figure 1C. Collectively, these analyses imply that genes associated with SO-R-loops tend to have no or low expression, whereas genes associated with ASO-R-loops or S/AS-R-loops have higher expression levels.
Functions of R-loops in gene transcription are genic position dependent
To further investigate the distribution of R-loops in different genic regions, we plotted normalized R-loop read counts in the first three exons (sequentially named Exon1, Exon 2, and Exon 3). We found that R-loop reads tend to be enriched to a large extent in the first exon in both seedlings and calli compared with the other two exons or the random control (Fig. 2A). Next, we specifically plotted each type of normalized R-loop read counts in Exon 1 (including 5′ UTR and CDS1) (Fig. 2B), Exon 2 (Fig. 2C), and the TSS (Fig. 2D). The profiles of S- and AS-R-loops in the TSS and Exons 1 and 2 were noticeably distinct. First, the normalized read counts of AS-R-loops were primarily distributed in Exon 1, whereas the normalized read counts of S-R-loops were relatively low in Exon 1, Exon 2, and the TSS. In Exon 1, AS-R-loops peaked sharply at the TSS (Fig. 2D) and then decreased through the first exon and eventually reached the level of the random control. The normalized read counts of S-R-loops in Exon 1 increased gradually in the 5′ UTR and peaked in the CDS 1 (Fig. 2B), but only slightly increased in Exon 2 compared with the upstream region (Fig. 2C).
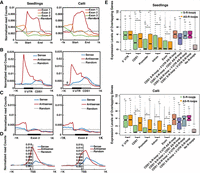
Genic distribution of R-loops and their effects on gene expression. (A) Distribution of R-loop read densities in the first three exons (Exon 1, 2, and 3) and ±1-kb flanking regions in seedlings and calli. (B) Distribution of S- and AS-R-loop read densities around 5′ UTRs, CDS1s, and ±1-kb flanking regions in seedlings and calli. (C) Distribution of S- and AS-R-loop read densities around Exon 2 and ±1-kb flanking regions in seedlings and calli. (D) Distribution of S- and AS-R-loop read densities within ±1 kb of TSSs in seedlings and calli. Ten thousand shuffled genic loci were used as the random control. (E) Boxplots displaying the expression levels of genes with R-loops in different subgenic regions. Green and orange boxes represent genes with only one S- or AS-R-loop, respectively. (CDS1 S-RL + 5′ UTR AS-RL) One S-R-loop in the first CDS and one AS-R-loop in the 5′ UTR; (CDS1 S-RL + CDS1 AS-RL) one S-R-loop and one AS-R-loop in first CDS; (CDS1 AS-RL + 5′ UTR AS-RL) one AS-R-loop in the first CDS and another one in the 5′ UTR region; (CDS1 S-RL + 5′ UTR S-RL) one S-R-loop in the first CDS and another one in the 5′ UTR region. P-value < 0.05 (*) and P-value < 0.01 (**) were determined by the Wilcoxon rank-sum test.
To investigate the effects of the leader introns in 5′ UTRs on the distributions of normalized read counts of different R-loops, we extracted 6020 transcripts with alternative splicing at their 5′ UTRs. We plotted the normalized R-loop read counts and found that AS-R-loops were primarily located in the first 5′ UTR, were dispersed into the subsequent intron, and eventually reached a level below the random control at the 3′ end of the intron (Supplemental Fig. S5; Supplemental Table S2). These results imply that AS-R-loops around the TSS play a role in transcriptional initiation.
To specifically examine the effects of R-loops on gene expression levels in a genic-dependent manner, we investigated genes that have only one R-loop in different subgenic regions, including 5′ UTRs, CDS1s, promoters, introns, and exons; the regions with no or two R-loops were used for comparison. As shown in Figure 2E, when only one AS-R-loop was present in each of these regions (orange), the median gene expression levels were ranked as follows: 5′ UTRs > CDS1s > promoters > introns > exons. The positional effect of S-R-loops (green) on gene expression in either tissue was similar to that observed for AS-R-loops in the same tissue, although generally smaller in magnitude, especially in calli. Because the magnitude of the effect of S-R-loops on gene expression in the 5′ UTR was nearly the same as that of AS-R-loops, this suggests that S-R-loops might also be positively associated with gene expression levels when present in this region (Fig. 2E). Compared with that of AS-R-loops or no R-loops, the positional effects of S-R-loops were negligible when they were present in any of other genic regions.
In addition, we found that the expression levels of genes with two R-loops, one in the 5′ UTR and the other in the CDS1, were comparable to the expression levels of genes with only one AS-R-loop in the 5′ UTR but higher than the expression levels of genes with two R-loops in CDS1s and with one R-loop in CDS1s, promoters, introns, and exons. This was true for both tissues (Fig. 2E). These results suggest that R-loops function in a genic position–dependent manner to promote gene expression in rice. The more pronounced effect on gene expression was observed when multiple R-loops were present, implying that these genic positional effects are additive to some degree.
Interrelation of R-loops and DNA methylation
The association of DNA hypomethylation with R-loops has been documented in humans and A. thaliana genomes, particularly when R-loops are present in promoter regions (Ginno et al. 2012; Sanz et al. 2016; Xu et al. 2017); however, the exact nature of the relationship between R-loops and DNA methylation is still undetermined. To investigate this, we profiled the methylation levels in ±1 kb of R-loops using published bisulfite sequencing data from rice seedlings (Hu et al. 2014), with 10,000 randomly selected regions (500 bp) as the controls. Compared with the flanking regions, R-loops were clearly associated with decreased CG methylation levels, slightly increased CHG (H = A, T, or C) methylation, and greatly increased CHH (H = A, T, or C) methylation (Supplemental Fig. S6A). Significantly lower CG methylation was observed in R-loops with G4+, whereas significantly higher CHH methylation occurred at the centers and the boundaries of R-loops with G4+ (Supplemental Fig. S6A). Compared with random controls, higher R-loop peak levels corresponded to lower CG methylation but higher CHH methylation levels (Supplemental Fig. S6B).
To investigate the relationship between R-loops and TE/non-TE genes, we examined DNA methylation levels of TE and non-TE genes with R-loops from 1 kb upstream of TSSs to 1 kb downstream from TESs. We found that the overall CG/CHG methylation levels of TE genes with R-loops (+) were significantly lower than those without R-loops (R-loops [−]) (Fig. 3A). When R-loops were present in non-TE genes, we found that CHG and CHH methylation in promoters and CG methylation in gene bodies were increased, whereas CG and CHG methylation were noticeably reduced in 1-kb downstream regions (Fig. 3A). The lowest CG and CHG methylation levels were observed in TEs with S/AS-R-loops, especially in promoter regions (Fig. 3B). Compared with TE genes with SO-R-loops, those ASO-R-loops or S/AS-R-loops generally showed decreased CG and CHG methylation. In particular, TE genes with S/AS-R-loops manifested lower CHG methylation in whole-gene regions (Fig. 3B). In contrast, in whole-gene regions, non-TE genes with SO-R-loops displayed higher CG and CHG methylation than other genes with either ASO- or S/AS-R-loops. CHH methylation in non-TE genes with ASO- or S/AS-R-loops was much higher in promoters but lower in gene bodies than other genes with SO-R-loops (Fig. 3B). However, overall, a positive correlation was found between total DNA methylation levels and R-loop peak levels in rice (Fig. 3C).
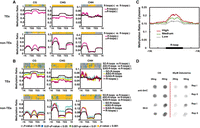
CG, CHG, and CHH methylation levels in TEs and non-TE genes in relation with R-loops. (A) Average ratios of CG, CHG, and CHH methylation between the TSS and TES and in ±1-kb flanking regions. Methylation ratios are shown with light red or black lines corresponding to genes with or without R-loops, respectively. The window size in flanking regions was 20 bp, and gene-body regions were equally divided into 50 bins for calculation of DNA methylation rates. The colored strips at the top of each plot reflect P-values from the Wilcoxon rank-sum test. Gray bands represent P-values > 0.05; blue bands, 0.05 < P-values < 0.01; green bands, 0.001 < P-values < 0.01; and yellow bands, P-values < 0.001. (B) As in A, except methylation ratios are shown with cyan, yellow, red, and black lines when the genes have SO-R-loops, ASO-R-loops, S/AS-R-loops, or no R-loops, respectively. (C) R-loop peak levels (high, medium, or low) and their corresponding total cytosine methylation ratios in rice. The window size in flanking regions was 20 bp, and all R-loop peaks were equally divided into 50 bins for calculating DNA methylation rates. (D) Dot blotting assays of normal and zebularine-treated plants with anti-5mC and anti-S9.6 antibodies. Each sample had two technical repeats in each blot. Dot signals were cut from the original blot that can be found in Supplemental Figure S10. Zebularine is known as a methylation inhibitor.
To determine if DNA demethylation can affect R-loop formation on a genome-wide scale, blotting assays were performed at least two times with DNA extracted from rice seedlings pretreated with or without zebularine, a DNA methyltransferase inhibitor used for the induction of global DNA demethylation in both mammals and plants (Zhou et al. 2002). Zebularine treatment reduced overall DNA methylation levels by ∼30%, and this led to a global reduction in R-loop intensities of ∼22% (Fig. 3D; Supplemental Fig. S6C).
To investigate which types of TEs are most affected by R-loops, we classified TEs into four categories—CACTA transposons (2114), centromere-specific retrotransposons (619), Ty1/3 retrotransposons (4502), and the remainder (Supplemental Fig. S7A)—that were extracted from the annotation file of rice genes (http://rice.plantbiology.msu.edu/). We sorted 3120 and 2321 TEs with SO-R-loops, 1539 and 1484 TEs with ASO-R-loops, and 772 and 1773 TEs with S/AS-R-loops in seedlings and calli, respectively. The genomic percentages of the four types of TEs that overlapped one of three different type of R-loops are displayed in the pie chart in Supplemental Figure S7A. In seedlings, 26.9% of CACTA TEs have S/AS-R-loops, whereas only 15.2% and 11.2% CACTA TEs have SO-R-loops and ASO-R-loops, respectively. In addition, 34.1% and 38.0% of Ty1/3 retrotransposons have ASO-R-loops in seedling and calli, respectively. This type of TE having either SO-R-loops or S/AS-R-loops did not exceed 16.9% in each tissue.
It is well known that DNA methylation has profound effects on silencing genes, especially TE genes. As anticipated, overall, the expression of TE genes was much lower than the expression of non-TE genes (Supplemental Fig. S7B). It is worth noting that the TEs overlapping R-loops displayed higher expression levels than those without R-loops (Supplemental Fig. S7B). The expression levels of TEs increased as their R-loops changed from SO-R-loops to ASO-R-loops and then to S/AS-R-loops. These findings are in agreement with what we observed for non-TE genes (Supplemental Fig. S3B). Our results imply that both TE and non-TE genes with R-loops, especially those with ASO-R-loops and S/AS-R-loops, have higher expression levels.
DNA N6-methyladenine affects R-loops
DNA N6-methyladenine (6mA) has recently been reported to differentially regulate gene transcription in rice (Zhou et al. 2018). To ascertain if R-loops and 6mA are interrelated, we integrated the DRIP-seq data with published 6mA-related IP-seq data (GEO is GSE103145). We detected 6119 overlaps between R-loops and 6mA enrichment in rice. We found that the presence of 6mA corresponded to higher read intensities of R-loops in promoters (Fig. 4A) and gene bodies (Fig. 4B). This conclusion was drawn based on comparison with total R-loops without 6mA in the same regions (10,540 in promoters and 9117 in gene bodies) or with three random sets, each containing the same number of R-loops as the R-loops with 6mA (2020 in promoters or 1937 in gene bodies).
The relationships among DNA 6mA, R-loops, and gene expression. (A) Distribution of normalized read counts for R-loops with 6mA (+) or/without 6mA (−) and ±1-kb flanking regions when R-loops in promoters. (B) As in A, except R-loops in gene bodies. Each random set in both A and B contained the same number of R-loops as those contained in the 6mA+ or 6mA− sets. (C) Distribution of normalized read counts in genes with 6mA+ that overlapped R-loops or non-R-loops. Regions from 1 kb upstream of TSSs and 1 kb downstream from TESs of these genes are shown. (D) Distribution of normalized read counts in genes with 6mA+ that overlapped three types of R-loops or without R-loops. (E) Box plots showing the median (black lines) and average (green triangles) expression levels of genes with 6mA (6mA+) or without 6mA (6mA−) that overlapped different types of R-loops. Significance was determined using the Wilcoxon rank-sum test. (**) P-values < 0.01. (F) The dot blotting assays with anti-S9.6 and anti-6mA antibodies. Each sample had two technical repeats per blot. Dot signals were cut from the original blot that can be found in Supplemental Figure S10.
To further assess the relationships between R-loops and 6mA modification, we examined how R-loops affect 6mA enrichment. We divided all 6mA-associated genes into two subgroups, one with R-loops (R-loops+) and one without R-loops (R-loops-), and then plotted normalized 6mA-related read counts from 1 kb upstream of TSSs to 1 kb downstream from TESs of non-TE genes (Fig. 4C). We found that genes with R-loops displayed more 6mA in gene bodies and in a short region downstream from TESs, but there tended to be less 6mA than genes without R-loops in the furthest upstream regions of promoters (Fig. 4C). After splitting the R-loops with 6mA into three types, we found that, in promoter regions, the normalized read counts of 6mA occurred in genes with ASO-R-loops, A/AS-R-loops, and then SO-R-loops (in descending order). Genes with any type of R-loops consistently displayed more 6mA enrichment in gene bodies than genes without R-loops (Fig. 4D). Furthermore, we found that genes with 6mA were more highly expressed than genes without 6mA for all types of R-loops (Fig. 4E) and that genes with different types of R-loops influenced gene expression differently, depending on the type of R-loops.
To determine if 6mA affects R-loop formation on a genome-wide scale, we conducted dot blotting assays at least two times using DNA extracted from CRISPR-Cas9–related transgenic lines in which either LOC_Os02g45110 or LOC_Os10g31030 was mutated. Both genes contain a MT-A70 domain, and each can function as a 6mA methyltransferase as reported in A. thaliana (Luo et al. 2014). Although we found that each mutant reduced overall 6mA levels by ∼75% (compared with wild type), the two mutant lines produced opposite effects on loop intensities: R-loop intensities increased ∼48% in the LOC_Os02g45110 mutant but decreased ∼26% in the LOC_Os10g31030 mutant (Fig. 4F; Supplemental Fig. S6C).These results indicate that different 6mA methyltransferases may modulate R-loops in distinct ways or that other factors in addition to 6mA methyltransferases may be involved in R-loop modulation in these two rice lines.
Interrelation between R-loops and chromatin signatures
To investigate the chromatin epigenomic signatures in relation to R-loops in the rice genome, we calculated the read densities of 16 different epigenetic marks from 1 kb upstream of to 1 kb downstream from the summits of R-loops, including DNase-seq, MNase-seq, and 14 histone marks (Supplemental Fig. S8). We found that all histone marks examined were highly enriched ∼250 bp upstream of the summits. In contrast, DNase I hypersensitive sites (DHSs) and nucleosomes were primarily positioned downstream from the summits compared with the 10,000 randomly selected 2-kb regions (Supplemental Fig. S8).
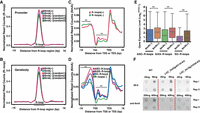
To further examine the chromatin signatures associated with each type of R-loops, we performed k-means clustering analyses to profile R-loops and all chromatin signatures across ±1 kb of TSSs of non-TE genes with SO-R-loops, ASO-R-loops, and S/AS-R-loops. We obtained five clusters (C) and three distinct profiling patterns for each type of R-loops (Fig. 5A). SO-R-loops had two highly enriched subregions (−100 to ∼450 bp [SC1] and 400 bp to ∼1 kb [SC2]), and one slightly enriched subregion with a diffuse read distribution across the entire ±1-kb region of TSS (SC3–SC5). ASO-R-loops were highly enriched in three subregions: −200 to ∼50 bp (ASC1), −100 to ∼250 bp (ASC2 and ASC3), and −50 to ∼300 bp (ASC4 and ASC5). S/AS-R-loops were also highly enriched in three subregions: 0 to 1 kb downstream from TSSs (S/ASC1 and S/ASC2), −250 bp upstream of to 100 bp downstream from TSSs (S/ASC3), and −50 bp upstream of to 450 bp downstream from TSSs (S/ASC5). We found that SC1, SC2, and S/ASC1 were dominant in nonexpressed genes (mean FPKM = 0); compared with other clusters, these “nonexpressed” clusters were particularly enriched with the histone repressive marks, H3K9me1/2/3, but lacked active marks, including DHSs and phased nucleosomes. In contrast, the genes in the SC3, ASC1, and S/ASC2 clusters appeared to exclusively recruit H3K27me3, which either completely repressed their expression or did so to a very low level. On the contrary, the genes in the ASC4, ASC5, and S/ASC5 clusters showed the highest range of expression and were highly enriched with all active marks, including DHSs and well-phased nucleosomes. A KEGG enrichment analysis was performed to investigate primary functions of each cluster, and the results are provided in Supplemental Table S3. As an example, the genes in the SC3 cluster primarily function in protein processing in the endoplasmic reticulum, and the genes in the ASC3 cluster are primarily involved in starch and sucrose metabolism as well as phenylpropanoid biosynthesis.
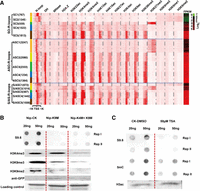
Epigenomic signatures associated with R-loop overlapping genes. (A) k-Means clustering analysis of read densities (normalized read counts) calculated with a 50-bp sliding window using sequencing data from DRIP-seq, ChIP-seq, DNase-seq, or MNase-seq approaches (where k = 5). The resulting profiles of epigenomic features of non-TE genes are displayed as a heatmap; region shown is ±1 kb of the TSSs. Non-TE genes were organized based on the types of R-loops present: SO-R-loops, ASO-R-loops, and S/AS-R-loops. The number of genes in each cluster is listed in brackets immediately after the cluster name; expression levels of genes (FPKM values) involved are shown in the rightmost lane. (B) Dot and western blotting assays using antibodies as shown at the left side. Each sample had two technical repeats per blot for the dot blotting but only one replicate for the western blotting. The experiment was repeated twice with similar results being obtained. The three wells from left to right in the row of “Loading control” are Coomassie Blue stained and contain the same amount of total proteins extracted from the Nip, Nip-K9M, and Nip-K4M + K9M lines. (C) Dot and western blotting assays used antibodies as shown. Each DNA sample had two technical repeats per blot, and each experiment was repeated two times and the results were stable. Dot signals or western bands were cut from original blots that can be found in Supplemental Fig. S10.
Experimental validation of the effects of histone marks on R-loops was performed using transgenic lines with either K9M (lysine to methionine single amino acid mutation) or K4M + K9M double mutations. These experiments were performed at least two times using DNA dot blotting and western blotting assays with S9.6 and histone mark antibodies (Fig. 5B). The K9M mutation caused a global reduction in H3K9me2 and H3K9me3, which is in agreement with previous reports of K9M in yeast and Drosophila (Herz et al. 2014; Shan et al. 2016). The addition of the K4M mutation induced a global decrease in H3K4me3. Both mutant lines had decreased R-loop intensities compared with the wild type: The reduction was ∼93% for K9M and 56% for the K4M + K9M double mutant (Fig. 5B; Supplemental Fig. S6C). We also investigated the effect of trichostatin A (TSA) on R-loop intensities. TSA is an organic compound that inhibits the class I and II mammalian histone deacetylase (HDAC) families. We found that TSA treatment induced a 20% increase in H3ac but induced ∼25% and 73% reductions in 5mC levels and R-loop intensities, respectively (Fig. 5C; Supplemental Fig. S6C).
Discussion
Involvement of R-loops in regulating gene transcription
Our computational studies and analyses revealed a number of correlations between R-loops and TE/non-TE gene expression in rice, which indicates that R-loops may serve as global regulators in controlling gene expression in plants. In addition, this study also generated multiple lines of in silico and experimental evidence that are instrumental in unveiling some specific roles and functions of R-loops in influencing gene expression in rice.
-
Regulation of gene expression generally requires the positioning of R-loop structures at genic boundaries, for example, promoters, TSSs, and 5′ UTRs, the first exons, or 3′ end terminators (Skourti-Stathaki et al. 2011; Ginno et al. 2012). Our study showed that R-loops tend to be primarily located at TSSs and can extend to 5′ UTRs and gene bodies in rice. The ASO-R-loops and S/AS-RL-R-loops were associated with high-level gene expression (Fig. 1A; Supplemental Fig. S4A), whereas SO-R-loops corresponded with low-level gene expression. A plausible explanation for this is that the formation of AS-R-loops promotes the release of antisense DNA strands, the templates for transcription, making them more accessible to transcription factors and/or transcriptional machinery. In contrast, the formation of S-R-loops restricts or prevents access of trans-factors and/or transcriptional machinery to antisense DNA template strands. Finally, S/AS-R-loops, as shown in Supplemental Figure S9, B though F, were often associated with much longer genes than the other two types of R-loops. As a result, an S-R-loop and an AS-R-loop in a given S/AS-R-loop may be spatially separated, which can promote, rather than impede, the initiation and prolongation of transcription.
-
There exist some correlations or concordances between different types of R-loops and various epigenomic marks (Fig. 3C,D); for example, ASO-R-loop peaks corresponded with H3K4me3, H3K4ac, and H3K9ac peaks around TSSs. To examine if methylation affects R-loop formation, we experimentally proved that the changes in DNA and histone modifications led to the changes in R-loop signals (Fig. 5B,C). The validation of a causal effect of R-loops on DNA/histone methylation remains challenging owing to the lack of technology to increase or deplete R-loops in plants. However, some recent experimental studies have shown that R-loops can alter epigenetic marks; for example, GADD45A (growth arrest and DNA damage protein 45A) binds directly to R-loops to mediate local DNA methylation by recruiting TET1 (ten-eleven translocation 1) (Arab et al. 2019). In addition, our study showed that a high percentage of R-loops was colocalized with DHSs (Fig. 5A), indicating the depletion of nucleosomes in R-loops overlapping promoters and TSSs. These results suggest R-loops and epigenomic markers can interact with each other to modulate gene expression.
Our data and results appear to support that R-loops can facilitate the access of trans-factors or transcriptional machinery to TSSs and proximal regions by displacing nucleosomes and/or modifying the DNA/histone methylation. Such a proposition is aligned well with some recent experimental evidence. In one study, it was shown that the binding of GADD45A to the R-loop in the TCF21 promoter triggers local DNA demethylation and TCF21 expression (Arab et al. 2019). In the other study, BRCA1-dependent R-loop mitigation contributes to luminal cell-specific transcription and differentiation (Chiang et al. 2019). Mutation of BRCA1 causes R-loops to accumulate at enhancer and/or promoter regions of luminal fate genes, which in turn down-regulate expression of luminal fate genes.
The coordination of R-loops and histone marks
As mentioned above, we have shown the evidence that R-loops and epigenomic markers can affect each other, suggesting that a crosstalk exists between R-loops and chromatin modifications in regulating gene expression. R-loops positively correlated with majority of active marks and active gene transcription but were inversely correlated with the repressive mark, H3K27me3, and with low or nonexpressed genes, especially for ASO- or S/AS-R-loops. One plausible explanation for this is that active marks promote R-loop formation, leading to the activation of gene transcription; this is supported by colocalization of R-loops with DHSs around TSSs that provide a niche for binding with transcriptional machinery. In addition, methylation of the histone repressive marks-H3K9 was colocalized with SO- and S/AS-R-loops predominantly in gene bodies of nonexpressed or minimally expressed genes (Fig. 5A). A previous study showed that R-loops with the H3K9me2 mark can repress FMR1 gene expression (Colak et al. 2014), and this scenario aligns well with the results from other studies (Al-Hadid and Yang 2016; Sanz et al. 2016; García-Benítez et al. 2017; García-Pichardo et al. 2017), which found that epigenetic marks are linked to R-loop formation. We validated this finding experimentally in methylation-deficient mutants using dot blot and western blotting (Fig. 5B; Supplemental Fig. S6C). Because the technology to partially deplete R-loops on a genome-wide scale is not yet available, we could not verify the causal effects of R-loops on epigenetic modifications on a large scale, although we indeed provided multiple lines of computational evidence to support this. In addition, two other studies have shown that R-loops have effects on histone modifications (Castellano-Pozo et al. 2013; Al-Hadid and Yang 2016).
The interrelation of R-loops and DNA methylation
In this study, we observed a positive association between R-loops and 6mA (Fig. 4F). In LOC_Os02g45110 and LOC_Os10g31030 mutants, a reduced 6mA was observed, indicating that each of these MTA genes can play a role in DNA 6mA modification in rice. R-loop formation was enhanced in the LOC_Os02g45110 mutant lines, but inhibited in the LOC_Os10g31030 mutant lines. This differential effect on R-loop formation may be associated with the different modes of action of the two MTA proteins.
The interactions between R-loops and 5mC are known to be influenced by multiple factors that include the following.
Methylation regulators including DNA methyltransferases
For example, CGGBP1, a cytosine methylation regulator protein, modulates DNA methylation homeostasis and may be responsible for creating or eliminating the niches for R-loop formation (Patel et al. 2018). On the contrary, it has been reported that R-loops can reduce DNA methylation by preventing the recruitment of the DNA methyltransferase 3 (DNMT3) family (Ginno et al. 2012). DNA demethylation in promoter CG islands in humans is associated with G4s in R-loops, whose structure can modulate DNA methyltransferase 1 (DNMT1) activity (Mao et al. 2018). Our findings in rice are in agreement with these results. R-loops correlated with the reduced CG methylation, especially when G4s are present in R-loops (Supplemental Fig. S6A). In addition, the depletion of R-loops engendered by mutation of senataxin protein influences promoter methylation in more than 1200 genes in amyotrophic lateral sclerosis (ALS4) patients, supporting preventive roles of R-loops in recruitment of DNMT1, which facilitates DNMT-mediated methylation-induced silencing (Grunseich et al. 2018). However, there is still no evidence to show that R-loops influence total 5mC levels through preventing DNMT recruitment in rice.
Types of genes (TE and non-TE genes) involved
Differential impacts of R-loops on CG and CHG methylation between TE and non-TE genes were observed (Fig. 3A). Ours is the first study showing different effects of R-loops on DNA methylation levels in TE and non-TE genes in plants.
The types of R-loops
The effects of R-loops on methylation are largely contingent on the types of R-loops present (Fig. 3A). Although all R-loops were associated with reduced CG and CHG methylation for TE genes, S/AS-R-loops had the most noticeable effect on CG and CHG methylation, followed by AS-R-loops.
Cytosine contexts (CG, CHG, and CHH)
Our study indicates that the relationship of R-loops and DNA methylation is context dependent. CHH is the most frequent methylation in rice, and there was a positive correlation between ASO- and S/AS-R-loops and CHH methylation levels in the promoter regions of both TE and non-TE genes (Fig. 3B). As to the overall relationship between R-loops and methylation, our experimental validation, which involved combining zebularine treatment with computational analyses, suggests that there is a positive correlation between R-loops and 5mC methylation on a genome-wide scale (Fig. 3C,D). Although multiple lines of in silico and experimental evidence suggest that a crosstalk exists between methylation and R-loops, the effects of R-loops on methylation should be characterized further using R-loops depletion or accumulation studies.
Methods
Preparation of rice seedlings, calli, and chemical-treated rice seedlings
Detailed procedures for preparation of rice seedlings and calli are reported in the Supplemental Methods. For chemical treatment, 100 5-d-old rice seedlings grown in Petri dishes were treated with 80 µM zebularine (Sigma-Aldrich Z4775) or 50 µM TSA (Sigma-Aldrich T8552); both chemicals were dissolved in DMSO, and DMSO was used as the control. After a 3-d treatment, seedlings with or without zebularine or TSA treatment were collected for extracting genomic DNA or total proteins. Purified genomic DNA and protein were used for dot and western blotting assays, respectively.
Generation of histone H3.3 and 6mA modifier-related rice transgenic lines
The CDS of the rice histone H3.3 gene (LOC_Os06g04030.1) was amplified using RT-PCR and then cloned into the pCAMBIA1305 vector for Agrobacterium-based rice transformation. Lysine to methionine single or double amino acid mutations (K9M and K4M + K9M, respectively) were created using primers synthesized with a specific nucleotide point mutation. The transformation procedures followed a published protocol (Hiei and Komari 2008). Detailed procedures for rice transformation are provided in the Supplemental Methods. All primers are listed in Supplemental Table S4.
DRIP and DRIP-seq library preparation
The DNA:RNA hybrid immunoprecipitation (DRIP) experiment (Nadel et al. 2015) and the preparation of DRIP-seq libraries using DRIPed DNA (Wang et al. 2011) were performed according to published procedures with some modifications. Detailed protocols are reported in the Supplemental Methods.
Preparation of RNase R–treated directional RNA-seq library
Total RNA was prepared using TRIzol (Thermo Fisher Scientific 15596026) followed by DNase I treatment and removal of the majority of mRNA with oligo(dT)-conjugated magnetic beads (Promega Z5310). Approximately 80 µg of RNA from each sample was treated with RNase R (Lucigen RNR07250). After adding additional “A” base, RNA was treated again with RNase R. Finally, ∼1 µg of RNA was used for directional RNA-seq library preparation according to published procedures. The final RNase R–treated RNA-seq libraries were quality controlled and sequenced using the Illumina HiSeq X Ten platform.
Analysis of DRIP-seq data
Raw data sets were processed using Trim Galore! (version 0.4.3, Babraham Bioinformatics) that can perform adapter trimming, remove low-quality bases, and do quality control. Clean reads were aligned to the rice reference genome with MSU version 7.0 (ftp://ftp.plantbiology.msu.edu/pub/data/Eukaryotic_Projects/o_sativa/annotation_dbs/pseudomolecules/version_7.0/all.dir/) using Bowtie (Langmead et al. 2009) with the following parameters --best--strata -m 1 - x 800. We then obtained files in SAM format, which included all uniquely mapped reads; we removed additional duplicate reads by using the SAMtools rmdup, version 1.4 (Li et al. 2009). Finally, we distinguished the strand-specific reads using flags of SAM files. The directions of single DNA strands or nascent RNA strands of R-loops were concordant with the directions of the R2 reads (R1 for the paired-end reads) aligned to the genome. We then extracted wR-loop reads by flags of R2 reads equal to 163, and we extracted cR-loop reads by flags of R2 reads equal to 147. Uniquely mappable reads corresponding to w/c R-loops were used for R-loop peak calling. R-loop peak calling was performed using MACS2 (Zhang et al. 2008) using the following command and parameters: macs2 callpeak --keep-dup 1 -g 3.8e+8 -B --extsize 200 -q 0.01 --nomodel --SPMR. The Spearman's rank correlation coefficients between biological replicates in seedlings and calli were calculated using the plotCorrelation program of deepTools (Ramirez et al. 2014) after the read coverage was normalized to 1× sequencing depth using bamCoverage with these following parameters: --normalize To1×3.8e+8 --binSize 5 --smoothLength 15 --ignoreDupicates. All of the public data sets that were analyzed are summarized in Supplemental Table S5.
Analysis of NBS-seq and BS-seq
Briefly, the raw nondenaturing bisulfite sequencing (NBS-seq) data sets from seedlings and calli and the public BS-seq data from rice seedlings were used for DNA methylation calculations. Detailed procedures for NBS-seq library preparation and data analysis are reported in the Supplemental Methods.
Analysis of other public data
All information regarding public data sets is listed in Supplemental Table S5. For RNA-seq, the expression levels (FPKM) of all genes were calculated using a previously described approach (Zhang et al. 2012). DNase-seq data were computationally analyzed using a previously described pipeline (Zhang et al. 2012). A previously described pipeline (Zhang et al. 2012) was used for analyzing all of the ChIP-seq data. MNase-seq data were analyzed using a previously described pipeline (Zhang et al. 2015). For DNA-6mA IP-seq, 6mA IP-seq data were reanalyzed following published procedures (Zhou et al. 2018).
Gene Ontology, KEGG enrichment analyses, and motif prediction
agriGO (Du et al. 2010) and ClueGO (Bindea et al. 2009) were used for Gene Ontology (GO) and KEGG analyses, respectively. MEME (Bailey et al. 2009), DREME (Bailey 2011), and CentriMo (Bailey and Machanick 2012) were used for motif analysis. Detailed protocols for each analysis are reported in the Supplemental Methods.
Data access
The DRIP-seq, NBS-seq, and RNase R–treated RNA-seq data generated in this study have been submitted to the NCBI Gene Expression Omnibus (GEO; http://www.ncbi.nlm.nih.gov/geo/) under accession number GSE111944.
Acknowledgments
This research was supported by grants from the National Natural Science Foundation of China (31571579, 31470443, and 31371239), the Fundamental Research Funds for the Central Universities (KYYJ201808), and an “Innovation and Enterprise Scholar” of Jiangsu Province for W.Z. We thank the Bioinformatics Center, Nanjing Agricultural University for providing computing facilities for data processing and analyses. This research was partially supported by the China Scholarship Council (grant no. 201706850071), which awarded a fellowship to Y.F.
Author contributions: W.Z. conceived and designed the study; W.Z. developed the DRIP-seq methodology and generated DRIP-seq and NBS-seq data sets. Y.F. analyzed the data; P.Z. analyzed the 6mA data. L.C. prepared all transgenic rice lines and conducted G4-ChIP-qPCR and histone-related western blotting experiments. K.L. grew the material and performed the 6mA and 5mC dot blotting assays. Y.L.F. prepared the genomic DNA and conducted the G4-ChIP experiments. J.S. proofread the manuscript. X.P. performed the qPCR and dot blotting assays. C.C. assisted in the NBS-seq library sequencing and provided 6mA-related cas9 rice transgenic lines. X.W. helped with DNA fragmentation. Z.S. helped with rice callus preparation. Y.W. and H.W. supervised the data analysis. W.Z., Y.F., and H.W. interpreted the results. W.Z. and H.W. wrote the paper. All authors read and approved the final version of the manuscript.
Footnotes
-
[Supplemental material is available for this article.]
-
Article published online before print. Article, supplemental material, and publication date are at http://www.genome.org/cgi/doi/10.1101/gr.246009.118.
- Received November 11, 2018.
- Accepted June 27, 2019.
This article is distributed exclusively by Cold Spring Harbor Laboratory Press for the first six months after the full-issue publication date (see http://genome.cshlp.org/site/misc/terms.xhtml). After six months, it is available under a Creative Commons License (Attribution-NonCommercial 4.0 International), as described at http://creativecommons.org/licenses/by-nc/4.0/.


